THE PMP® EXAM CONTENT FROM THE MONITORING AND CONTROLLING PERFORMANCE DOMAIN COVERED IN THIS CHAPTER INCLUDES THE FOLLOWING:
✓ Measure project performance using appropriate tools and techniques in order to identify and quantify any variances and corrective actions.
✓ Manage changes to the project by following the change management plan in order to ensure that project goals remain aligned with business needs.
✓ Verify that project deliverables conform to the quality standards established in the quality management plan by using appropriate tools and techniques to meet project requirements and business needs.
✓ Monitor and assess risk by determining whether exposure has changed and evaluating the effectiveness of response strategies in order to manage the impact of risks and opportunities on the project.
✓ Review the issue log, update if necessary, and determine corrective actions by using appropriate tools and techniques in order to minimize the impact on the project.
✓ Capture, analyze, and manage lessons-learned, using lessons learned management techniques in order to enable continuous improvement.
✓ Monitor procurement activities according to the procurement plan in order to verify compliance with project objectives.
Monitoring and Controlling is the fourth of the five project management process groups and accounts for 25 percent of the questions on the PMP® exam. The processes in the Monitoring and Controlling process group concentrate on monitoring and measuring project performance to identify variances from the project management plan and get them back on track. Regularly monitoring project performance provides insight into the current state of the project and allows you to correct areas that are falling off track before they impact your project significantly. The Monitoring and Controlling process group is concerned not only with monitoring the project work but also with the project as a whole. In multiphase projects, this process group coordinates the project phases.
Measuring Project Performance
As the project work is carried out, it is important to monitor the project performance closely. This can be done by using various tools and techniques that assist in identifying and quantifying variances as well as determining the necessary corrective action needed. Monitoring project performance occurs through the Monitor and Control Project Work process, part of the Project Integration Management Knowledge Area.
Work performed by sellers (resources external to the organization) are monitored and controlled through the Control Procurements process. Control Procurements is a process that belongs to the Project Procurement Management Knowledge Area.
Monitor and Control Project Work
The Monitor and Control Project Work process involves monitoring all the processes in the Initiating, Planning, Executing, and Closing process groups to meet the performance objectives outlined in the project management plan. Collecting data, measuring results, and reporting on performance information are some of the activities performed during this process.
According to the PMBOK® Guide, the Monitor and Control Project Work process encompasses the following:
Reporting and comparing actual project results against the project management plan
Analyzing performance data and determining whether corrective or preventive action is needed
The process names, inputs, tools and techniques, outputs, and descriptions of the project management process groups and related materials and figures in this chapter are based on content from A Guide to the Project Management Body of Knowledge (PMBOK ® Guide), Fifth Edition (PMI®, 2013).
Monitoring project risks
Documenting all appropriate product information throughout the life of the project
Gathering, recording, and documenting project information
Monitoring approved change requests
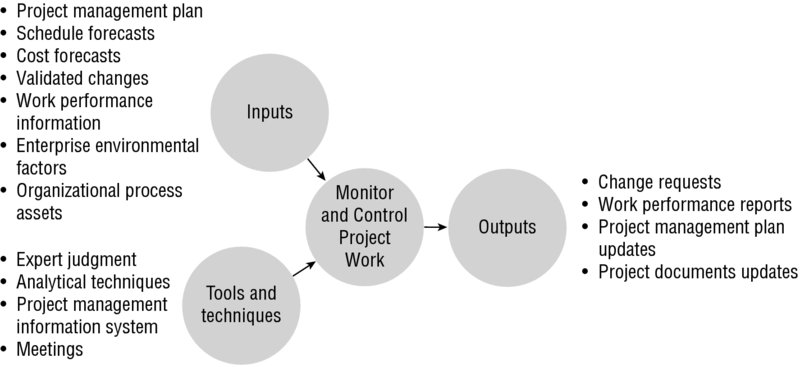
Figure 5.1 shows the inputs, tools and techniques, and outputs of the Monitor and Control Project Work process.
FIGURE 5.1 Monitor and Control Project Work process
Inputs of Monitor and Control Project Work
Know the following inputs of the Monitor and Control Project Work process:
Project management plan
Schedule forecasts
Cost forecasts
Validated changes
Work performance information
Enterprise environmental factors
Organizational process assets
Project Management Plan The project management plan provides the information necessary to monitor the project work and determine whether the project is progressing as planned.
Schedule Forecasts Schedule forecasts reflect whether the project is on track, ahead, or behind schedule, typically expressed in the form of schedule variance (SV) or schedule performance index (SPI). SV and SPI are calculated using earned value management (EVM) techniques.
Cost Forecasts Cost forecasts reflect whether the project is on, over, or under budget. Like schedule forecasts, cost forecasts may be calculated using EVM, and expressed in the form of cost variance (CV) or cost performance index (CPI). In addition to CV and CPI, the estimate at completion (EAC) may be calculated to determine whether forecasts are within a tolerable range from the planned budget.
Validated Changes Validated changes are those changes that have been reviewed and approved by a change control board and have also been validated from a quality perspective. Through this process, changes are reviewed to ensure that they have been implemented correctly and the desired result has been achieved.
Work Performance Information Work performance information provides information produced as a result of carrying out various processes within the Monitoring and Controlling process group. It reflects performance data that has been analyzed and can therefore be used to make project decisions.
Enterprise Environmental Factors The enterprise environmental factors provide the following information used by this process:
Government or industry standards
Work authorization systems
Stakeholder risk tolerances
Organizational Process Assets The following organizational process assets are used as inputs:
Communication requirements
Procedures for financial controls, risk control, and problem solving
Lessons learned database
Tools and Techniques of Monitor and Control Project Work
The Monitor and Control Project Work process has four tools and techniques: expert judgment, analytical techniques, project management information system, and meetings.
Expert Judgment Expert judgment involves interpreting the information that results from this process and making key project decisions as a result of the information.
Analytical Techniques In the scope of this process, analytical techniques involve using various techniques to forecast possible scenarios based on existing variables. The PMBOK® Guide provides the following examples:
Regression analysis
Grouping methods
Causal analysis
Root cause analysis
Forecasting methods
Failure mode and effect analysis (FMEA)
Fault tree analysis (FTA)
Reserve analysis
Trend analysis
Earned value management
Variance analysis
Project Management Information System There are various project management information systems (PMISs) that may be used through this process. Typically, these tools are used to help in forecasting calculations.
Meetings This process involves a high degree of interaction and analysis by project experts. When used appropriately, meetings can be a powerful mechanism for project team members and other subject matter experts to discuss project performance and to make decisions.
Outputs of Monitor and Control Project Work
The Monitor and Control Project Work process has four outputs:
Change Requests As a result of assessing project performance and making decisions on how to proceed based on this information, changes may be required. Change requests typically include the following items:
Corrective actions, intended to bring the project back on track with the plan
Preventive actions, intended to prevent the project from getting off track with the plan
Defect repairs, intended to address product or product components that do not conform to requirements
Work Performance Reports As a result of assessing work performance information, work performance reports are compiled through this process; according to the PMBOK® Guide, work performance reports are physical or electronic representations of performance data. By documenting this information, it can be distributed to stakeholders and archived for future reference. Work performance reports can also be used as a means of increasing awareness and making decisions in relation to the project.
Project Management Plan Updates Project management plan updates may include updates to one or more of the following:
Schedule management plan
Cost management plan
Quality management plan
Scope baseline
Schedule baseline
Cost baseline
Project Documents Updates Project documents updates may include updates to the following:
Forecasts
Performance reports
Issue log
Control Procurements
The Control Procurements process is concerned with monitoring the vendor’s performance and ensuring that all requirements of the contract are met. This process also manages the procurement relationships overall and makes changes and corrections as needed.
According to the PMBOK® Guide, you must integrate and coordinate the Direct and Manage Project Work, Control Quality, Perform Integrated Change Control, and Control Risks processes during the Control Procurements process.
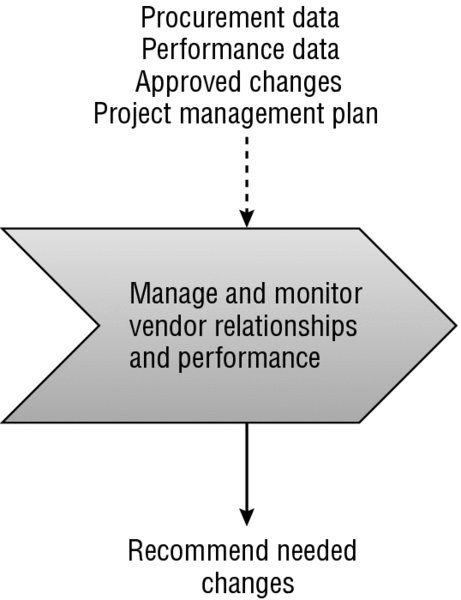
Figure 5.2 shows the inputs, tools and techniques, and outputs of the Control Procurements process.
Know the following inputs of the Control Procurements process:
Project management plan
Procurement documents
Agreements
Approved change requests
Work performance reports
Work performance data
Project Management Plan The project management plan includes the procurement management plan, which guides the project management team in properly carrying out the process. It also documents how the contracts will be managed through to closure.
Procurement Documents Procurement documents may include the following supporting documents:
Procurement contract awards
Procurement statement of work
Agreements To administer the relevant contracts, you must first include each contract as an input to this process.
Approved Change Requests Approved change requests include changes that have been approved to the contract, such as these:
Modifications to deliverables
Changes to the product or service of the project
Changes in contract terms
Termination for poor performance
Work Performance Reports Work performance reports refer to seller-related documents, such as seller performance reports and technical documentation.
Work Performance Data Work performance data involves monitoring work results and examining the vendor’s deliverables. This includes monitoring their work results against the project management plan and making sure that certain activities are performed correctly and in sequence.
Tools and Techniques of Control Procurements
Be familiar with the following tools and techniques of the Control Procurements process:
Contract change control system
Procurement performance reviews
Inspections and audits
Performance reporting
Payment systems
Claims administration
Records management system
Contract Change Control System The contract change control system describes the processes needed to make contract changes. Since the contract is a legal document, it cannot be changed without the agreement of all parties. It documents and includes the following items:
Instructions for submitting changes
Instructions for establishing the approval process
Instructions outlining authority levels
A tracking system for numbering the change requests and recording their status
Procedures for dispute resolution
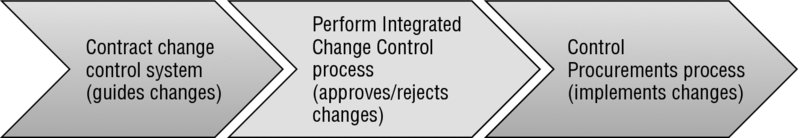
Figure 5.3 demonstrates where the contract change control system fits into the contract change process.
A formal process must be established to process and authorize (or deny) changes.
Procurement Performance Reviews Procurement reviews examine the contract terms and seller performance. If the seller is not in compliance, action must be taken to either get them back into compliance or terminate the contract. These reviews can be conducted at the end of the contract’s life cycle or at intervals during the contract period.
Inspections and Audits The purpose of inspections and audits is to determine whether there are any deficiencies in the seller’s product or service. These are conducted by the buyer or a designated third party.
Performance Reporting Performance reporting involves providing managers and stakeholders with information about the vendor’s progress in meeting the contract objectives.
Payment Systems Vendors submit seller invoices as an input to this process, and the payment system is the tool and technique used to issue payments.
Claims Administration Claims administration involves documenting, monitoring, and managing contested changes to the contract. Contested changes usually involve a disagreement about the compensation to the vendor for implementing the change. Here are some things to know about claims administration:
Contested changes are also known as disputes, claims, or appeals.
Claims can be settled directly between the parties themselves, through the court system, or by a process called arbitration.
Records Management System A records management system can be part of the project management information system (PMIS) and involves the following:
Documentation
Policies
Control functions
Automated tools
Records management systems typically index documents for easy filing and retrieval.
Outputs of Control Procurements
Know the following five outputs of the Control Procurements process:
Work performance information
Change requests
Project management plan updates
Project documents updates
Organizational process assets updates
Work Performance Information Work performance information reflects performance data of the vendor that has been analyzed; this information will be used to make decisions in regard to any corrective action or changes needed regarding the vendor’s performance. According to the PMBOK® Guide, work performance information may also include contract compliance reports.
Change Requests Change requests may result from performing the Control Procurements process and may include changes to plans and baselines. Changes may involve addressing any vendor-related performance issues or may even include requests for contract changes.
Change requests are submitted and processed through the project’s change control system.
Project Management Plan Updates Project management plan updates that may result from the Control Procurements process typically include updates to the procurement management plan and baselines.
Project Documents Updates Project documents typically updated as a result of carrying out this process include procurement documentation. Procurement documentation produced as part of this process includes, but is not limited to, the following:
Contract
Performance information
Warranties
Financial information
Inspection and audit results
Supporting schedules
Technical documentation
Approved and unapproved contract changes
Organizational Process Assets Updates According to the PMBOK® Guide, organizational process assets updates typically include the following items:
Correspondence Correspondence is information that needs to be communicated in writing to either the seller or the buyer, such as contract changes, audit results, notice of unsatisfactory performance, and notification of contract termination.
Payment Schedules and Requests Payment schedules and requests include information about paying the vendor on time and verifying that payment terms are met to warrant payment.
Seller Performance Evaluation Documentation Seller performance evaluation is a written record of the seller’s performance on the contract and is prepared by the buyer. It should include information about whether the seller successfully met contract dates and fulfilled the requirements of the contract and/or contract statement of work and whether the work was satisfactory.
Managing Changes to the Project Scope, Schedule, and Costs
Managing the triple constraints is an important part of monitoring and controlling a project. This includes managing changes to the project scope, schedule, and costs, which requires that the project management plan be updated as needed. The Validate Scope, Control Scope, Control Schedule, and Control Costs processes focus on managing these changes and uncovering existing variance to the plan. As the plan is updated with approved changes, these changes should be communicated to the team to ensure that revised project goals are met.
Validate Scope
Managing and reporting on project progress is the primary focus of the Monitoring and Controlling processes. One of the Monitoring and Controlling processes is Validate Scope. The primary purpose of the Validate Scope process is to formally accept completed deliverables and obtain sign-off that the deliverables are satisfactory and meet stakeholders’ expectations. Validate Scope formalizes the acceptance of the project scope and is primarily concerned with the acceptance of work results.
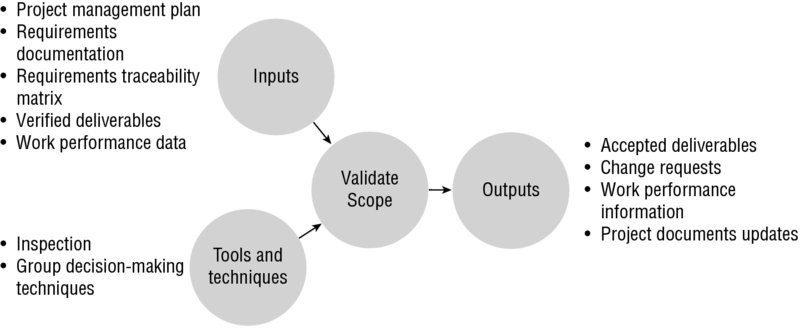
Figure 5.4 shows the inputs, tools and techniques, and outputs of the Validate Scope process.
Know the following inputs of the Validate Scope process:
Project management plan
Requirements documentation
Requirements traceability matrix
Verified deliverables
Work performance data
Project Management Plan The scope management plan and scope baseline are used from the project management plan. The scope baseline includes the project scope statement, work breakdown structure (WBS), and WBS dictionary, all of which will be used by this process.
Requirements Documentation To validate the scope of the project work, the project, product, and technical requirements (and any others) must be included as an input to this process.
Requirements Traceability Matrix The requirements traceability matrix tracks the requirements throughout the project life cycle.
Verified Deliverables Verified Deliverables include deliverables that have been verified through the Control Quality process. The quality team verifies that deliverables have been completed correctly.
Work Performance Data Work performance data reflects raw data relating to the deliverables, which is used to determine the degree of compliance against the requirements. This can include the number and severity of nonconformities and/or total validation cycles performed.
Tools and Techniques of Validate Scope
The Validate Scope process has two tools and techniques: inspection and group decision-making techniques.
Inspection According to the PMBOK® Guide, inspection is concerned with making sure the project work and deliverables meet the requirements and product acceptance criteria. This may include ensuring, examining, and validation activities.
Group Decision-Making Techniques Group decision-making techniques, such as unanimity, majority, plurality, and dictatorship, are used in this process by the project team to make a decision after performing validation activities.
Outputs of Validate Scope
The Validate Scope process results in four outputs:
Accepted Deliverables The accepted deliverables output signifies that the deliverables have been formally accepted and signed off by the customer or sponsor. This output, along with related documentation, is then fed into the Close Project or Phase process at the appropriate time.
Change Requests Change requests address deliverables that were rejected by the customer or sponsor and that therefore require defect repair.
Work Performance Information Work performance information includes performance-related information relating to deliverables, such as which deliverables have been completed or accepted.
Project Documents Updates Project documents updates typically include updates to the following items:
Documents that define the product
Documents that report completion status
Control Scope
The Control Scope process involves monitoring the status of both the project and the product scope, monitoring changes to the project and product scope, and monitoring work results to ensure that they match expected outcomes. Any modification to the agreed-upon WBS is considered a scope change. This means the addition or deletion of activities or modifications to the existing activities on the WBS constitutes a project scope change.
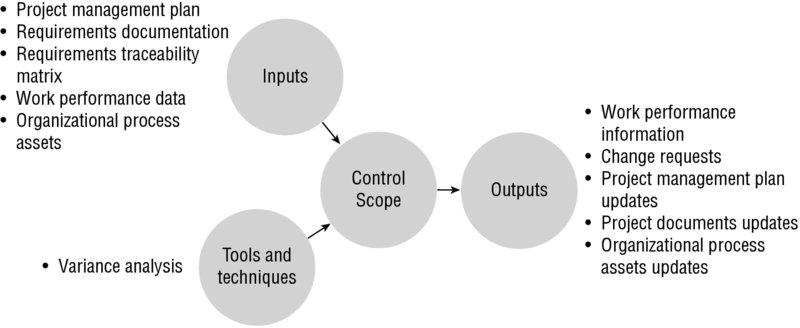
Figure 5.5 shows the inputs, tools and techniques, and outputs of the Control Scope process.
Know the following inputs of the Control Scope process:
Project management plan
Requirements documentation
Requirements traceability matrix
Work performance data
Organizational process assets
Project Management Plan The following components of the project management plan are used in controlling scope:
Scope management plan
Scope baseline
Change management plan
Configuration management plan
Requirements management plan
Requirements Documentation Information from the requirements documentation input used in this process includes the project, product, technical, and any other requirements.
Requirements Traceability Matrix The requirements traceability matrix is used to track the requirements throughout the project life cycle.
Work Performance Data Work performance data provides the status and progress of deliverables.
Organizational Process Assets Organizational process assets used in this process include any policies, procedures, guidelines, and reporting methods that relate to scope control.
Tools and Techniques of Control Scope
The Control Scope process has one tool and technique: variance analysis. Variance analysis includes reviewing project performance measurements to determine whether there are variances in project scope and whether any corrective action is needed as a result of existing variances.
Outputs of Control Scope
The Control Scope process results in the following outputs:
Work performance information
Change requests
Project management plan updates
Project documents updates
Organizational process assets updates
Work Performance Information Work performance information documents the results of comparing planned and actual scope performance. This information will be used when making scope-related decisions.
Change Requests When scope changes are requested, all areas of the project should be investigated to determine what the changes would impact. Change requests typically involve the scope baseline or other components of the project management plan. Refer to the Integrated Change Control Process to make sure change requests are processed for review accordingly.
Project Management Plan Updates Depending on the approved changes, updates to the project management plan may result in changes to the scope baseline or other project baselines.
Project Documents Updates Updates to project documents that occur as a result of this process typically include the requirements documentation and requirements traceability matrix.
Organizational Process Assets Updates The following updates are typically made to the organizational process assets:
Causes of variances
Corrective actions taken
Lessons learned
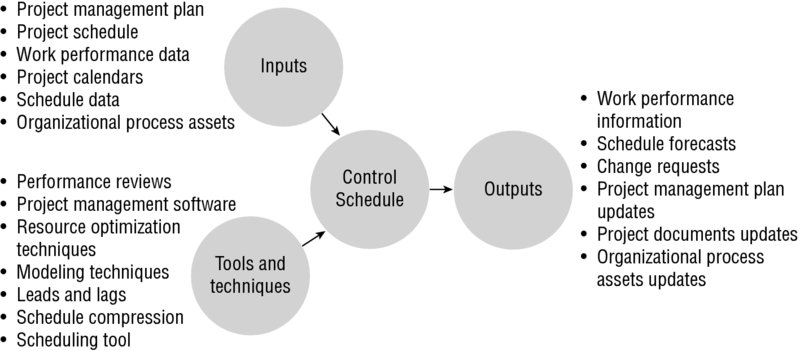
Control Schedule
The Control Schedule process involves determining the status of the project schedule, determining whether changes have occurred or should occur, and influencing and managing schedule changes.
Figure 5.6 shows the inputs, tools and techniques, and outputs of the Control Schedule process.
Know the following inputs of the Control Schedule process:
Project management plan
Project schedule
Work performance data
Project calendars
Schedule data
Organizational process assets
Project Management Plan The schedule management plan and the schedule baseline are used to carry out the Control Schedule process from within the project management plan.
Project Schedule To control the schedule, the project schedule itself must be included as an input into the process.
Work Performance Data Work performance data provides status information on the schedule activities. This can include raw data, such as which activities have started, are in progress, or have finished.
Project Calendars Project calendars are used to calculate schedule forecasts, which may be based off multiple project calendars used to account for different work periods.
Schedule Data Schedule data is reviewed through this process to monitor schedule progress.
Organizational Process Assets The following organizational process assets are used in this process:
Policies, procedures, guidelines, and reporting methods relating to schedule control
Schedule control tools
Tools and Techniques of Control Schedule
The Control Schedule process includes the following tools and techniques:
Performance reviews
Project management software
Resource optimization techniques
Modeling techniques
Leads and lags
Schedule compression
Scheduling tool
Performance Reviews Performance reviews in this process examine elements such as actual start and end dates for schedule activities and the remaining time to finish uncompleted activities. Schedule variance (SV) and schedule performance index (SPI) can be used to determine the impact of the schedule variations and whether corrective action is necessary.
In addition to EVM, performance reviews may also evaluate any trends identified, as well as use the critical path method and/or critical chain method to determine schedule adjustments needed.
Project Management Software Project management scheduling software can be used to track actual versus planned activity dates and the impact of any existing changes.
Resource Optimization Techniques Resource optimization techniques can leverage techniques such as resource leveling to better distribute the work among resources. It considers both resource availability and project time.
Modeling Techniques Modeling techniques use what-if scenarios to bring the actual schedule back in line with the planned schedule. To do this, scenarios are determined in concert with risk analysis.
Leads and Lags Leads and lags are adjusted during this process as a means of bringing the actual schedule back in line with the schedule baseline.
Schedule Compression Schedule compression techniques, such as fast-tracking and crashing, are used to bring the actual schedule back in line with the planned schedule.
Scheduling Tool Scheduling tools are used to perform schedule network analysis, which results in an updated project schedule.
Outputs of Control Schedule
The Control Schedule process includes the following outputs:
Work performance information
Schedule forecasts
Change requests
Project management plan updates
Project documents updates
Organizational process assets updates
Work Performance Information Work performance information typically includes the calculated SV and SPI values. According to the PMBOK® Guide, SV and SPI are calculated for work packages and control accounts.
Schedule Forecasts Schedule forecasts are derived using the various tools and techniques described. Forecasts reflect the anticipated future performance of the project.
Change Requests Change requests generated as a result of this process typically include modifications to the schedule baseline. Aside from baseline changes, changes may come in the form of corrective or preventive actions as a means of getting the project back on track with the plan.
Project Management Plan Updates Project management plan updates typically include updates to the schedule baseline, the cost baseline, and the schedule management plan.
Project Documents Updates The project document updates output may require updates to the schedule data or the project schedule.
Organizational Process Assets Updates Organizational process assets updates typically include the following items:
Causes of variances
Corrective actions
Lessons learned
Control Costs
The Control Costs process monitors the project budget, manages changes to the cost baseline, and records actual costs. It’s concerned with monitoring project costs to prevent unauthorized or incorrect costs from being included in the cost baseline. The activities are among those included in this process:
Monitoring changes to costs or the cost baseline and understanding variances from the baseline
Monitoring change requests that affect cost and resolving them in a timely manner
Informing stakeholders of approved changes and their costs
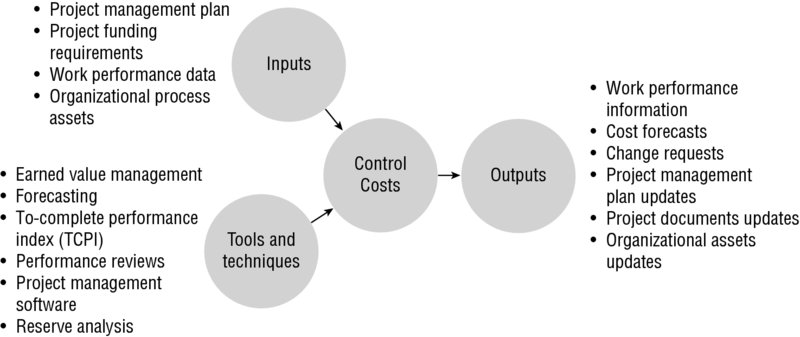
Figure 5.7 shows the inputs, tools and techniques, and outputs of the Control Costs process.
Know the following inputs of the Control Costs process:
Project management plan
Project funding requirements
Work performance data
Organizational process assets
Project Management Plan The project management plan includes the cost baseline and the cost management plan that will be used by this process. The cost baseline compares actual expenditures to date on the project to the baseline. The cost management plan details how costs should be monitored and controlled throughout the life of the project.
Project Funding Requirements Project funding requirements include the periodic and total project funding provided.
Work Performance Data The work performance data input provides information about the project’s progress, including authorized and incurred costs and project estimates.
Organizational Process Assets The following organizational process assets are used by this process:
Policies, procedures, guidelines, and reporting methods relating to cost
Cost control tools
Tools and Techniques of Control Costs
You should be familiar with the following tools and techniques of the Control Costs process:
Earned value management (EVM)
Forecasting
To-complete performance index (TCPI)
Performance reviews
Project management software
Reserve analysis
Earned Value Management Performance measurement analysis can be accomplished by using a technique called earned value management (EVM). EVM compares what you’ve received or produced to what you’ve spent and establishes the cause and impact of variances to determine necessary corrective action. It is the most often used performance measurement method.
EVM is performed on the work packages and the control accounts of the WBS. To perform the EVM calculations, the planned value (PV), earned value (EV), and actual cost (AC) are collected. They are defined in Table 5.1 along with other terms associated with the EVM technique.
The PV is the budgeted cost of work that has been authorized for a schedule activity or WBS component during a given time period or phase. These budgets are established during the Planning processes. All PVs add up to the budget at completion (BAC). PV is also known as budgeted cost of work scheduled (BCWS).
Earned value (EV)
EV is measured as budgeted dollars for the work performed. EV is typically expressed as a percentage of the work completed compared to the budget. It is also known as budgeted cost of work performed (BCWP).
Actual cost (AC)
AC is the cost of completing the work component in a given time period. AC measures the costs (direct, indirect, or other) that were used to calculate the planned value. It is also known as actual cost of work performed (ACWP).
Cost variance (CV)
CV determines whether costs are higher or lower than budgeted. A negative CV means the project is over budget; a positive CV means the project is under budget.
Cost performance index (CPI)
CPI measures the value of the work completed against actual cost. A CPI of 1 means the project is on budget; a CPI of >1 means the project is under budget; a CPI of <1 means the project is over budget.
Schedule variance (SV)
SV determines whether the work is ahead of or behind the planned schedule. A positive SV means the project is ahead of schedule; a negative SV means the project is behind schedule.
Schedule performance index (SPI)
SPI measures the schedule progress to date against the planned progress. An SPI of 1 means the project is on schedule, an SPI of >1 means the project is ahead of schedule, and an SPI of <1 means the project is behind schedule.
Estimate at completion (EAC)
EAC is the expected total cost of a work component, a schedule activity, or the project at its completion.
Estimate to complete (ETC)
ETC is the amount of effort remaining based on completed and expected activities.
Budget at completion (BAC)
BAC is the sum of all the budgets (or PVs) established.
Variance at completion (VAC)
VAC is the difference between the budget at completion and the estimate at completion.
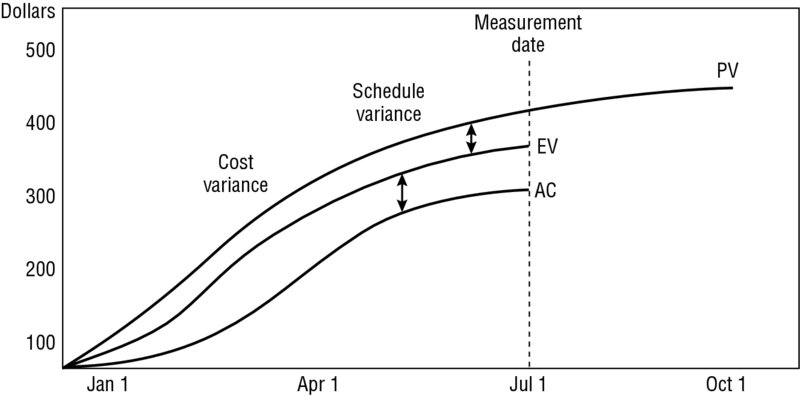
PV, AC, and EV measurements can be plotted graphically to show the variances between them. If there are no variances in the measurements, all lines on the graph remain the same, meaning that the project is progressing as planned. All of these measurements include a cost component. Costs are displayed in an S curve because spending is minimal in the beginning of the project, picks up steam toward the middle, and then tapers off at the end. This means your earned value measurements will also take on the S curve shape. Figure 5.8 shows an example that plots these three measurements.
Cost Variance Cost variance is one of the most popular variances that project managers use, and it tells you whether your costs are higher than budgeted (with a resulting negative number) or lower than budgeted (with a resulting positive number). It measures the actual performance to date or during the period against what’s been spent.
Use this formula:
Schedule Variance Schedule variance, another popular variance, tells you whether the schedule is ahead or behind what was planned for this period. This formula is most helpful when you’ve used the critical path methodology to build the project schedule.
Use this formula:
Together, the CV and SV are known as efficiency indicators for the project and can be used to compare performance of all the projects in a portfolio.
Cost and schedule performance indexes are primarily used to calculate performance efficiencies, and they’re often used to help predict future project performance.
Cost Performance Index The cost performance index (CPI) measures the value of the work completed against actual cost. It is the most critical of all the EVM measurements according to the PMBOK® Guide because it tells you the cost efficiency for the work completed to date or at the completion of the project. As mentioned previously, if CPI is greater than 1, your spending is less than anticipated. If CPI is less than 1, you are spending more than anticipated for the work completed.
Use this formula:
Schedule Performance Index The schedule performance index (SPI) measures the progress to date against the progress that was planned. This formula should be used in conjunction with an analysis of the critical path activities to determine if the project will finish ahead of or behind schedule. As mentioned previously, if SPI is greater than 1, you are ahead of schedule. If SPI is less than 1, you are behind schedule.
Use this formula:
Forecasting Forecasting uses the information gathered to date and estimates the future conditions or performance of the project based on what is known when the calculation is performed.
One of the forecasting formulas used is called estimate at completion (EAC). EAC estimates the expected total cost of a work component, a schedule activity, or the project at its completion. This is the probable final value for the work component (or project).
Use this formula:
The bottom-up estimate to complete (ETC) is the amount of effort remaining based on the activities completed to date and what is thought to occur in the future. Each estimate is summed to come up with a total ETC.
According to the PMBOK® Guide, there are four EAC forecasting formulas (see Table 5.2), which use budget at completion (BAC). BAC is the sum of all the budgets established for all the work in the work package, control account, schedule activity, or project. It’s the total planned value for the work component or project. In addition to the bottom-up ETC, there is one other formula for calculating ETC that you should be aware of for the exam. This is also listed in Table 5.2.
This is used if the initial plan is no longer valid.
EAC
EAC = AC + BAC – EV
This formula calculates EAC based on the actual costs to date and the assumption that ETC work will be completed at the budgeted rate, thereby accepting previous performance (whether good or bad).
EAC
EAC = BAC ÷ CPI
This forecast assumes that future performance will be just like the past performance for the project.
EAC
EAC = AC + ((BAC – EV) ÷ (CPI × SPI))
This formula assumes there is a negative cost performance to date and the project schedule dates must be met.
ETC
ETC = EAC - AC
Use this formula when the work is expected to continue according to the plan.
ETC
ETC = Reestimate
Use this formula for predicting future cost variances that will not be similar to the types of variances you’ve seen to date. It reestimates from the bottom up.
To-Complete Performance Index To-complete performance index (TCPI) is the projected performance level the remaining work of the project must achieve to meet the BAC or EAC. It’s calculated by dividing the work that’s remaining by the funds that are remaining.
The formula for TCPI when using the BAC is as follows:
When the BAC is no longer attainable, the project manager should calculate a new EAC, and this new estimate becomes the goal you’ll work toward once it’s approved by management. The formula for TCPI when EAC is your goal is as follows:
Performance Reviews Performance reviews compare cost performance over time and the estimates of funds needed to complete the remaining work. The following three analysis types are associated with performance reviews:
Variance analysis calculates the difference between the budget at completion and the estimate at completion. To calculate this, use the variance at completion (VAC) formula:
Variance analysis works closely with the performance reviews technique. Aside from calculating VAC, variance analysis also focuses on the cause that led to a deviation from the baselines. By determining the cause of existing or potential variance, the project management team can then formulate an effective response through a change request.
Trend analysis analyzes existing trends of project performance over time and whether performance is improving or declining.
Earned value performance includes a comparison of the baseline plans to actual performance.
Project Management Software Project management software is used to monitor PV, EV, and AC. Table 5.3 shows the formulas used to calculate values.
EAC using actual costs to date plus new budgeted rates based on expert feedback.
Estimate at completion (EAC)
EAC = AC + BAC – EV
EAC using actual costs to date and future performance will be based on budgeted rate.
Estimate at completion (EAC)
EAC = BAC ÷ CPI
EAC assuming future performance will behave like past performance.
Estimate at completion (EAC)
EAC = AC + [(BAC – EV) ÷ (CPI × SPI)]
EAC when cost performance is negative and schedule dates must be met.
Estimate to complete (ETC)
ETC = EAC - AC
When the work is expected to continue according to the plan.
Estimate to complete (ETC)
ETC = Reestimate
When future cost variances will not be similar to the variances experienced to date, and work must be reestimated from the bottom up.
To-complete performance index (TCPI)
TCPI = (BAC – EV) ÷ (BAC – AC)
This TCPI formula is used when employing BAC.
To-complete performance index (TCPI)
TCPI = (BAC – EV) ÷ (EAC – AC)
This TCPI formula is used when EAC is your goal.
Variance at completion (VAC)
VAC = BAC – EAC
Used to calculate the variance against the budget.
Reserve Analysis Reserve analysis is used to monitor and manage the amount of funds within the contingency and management reserves. Reserve analysis is covered further later in this chapter as part of controlling risks.
Outputs of Control Costs
The Control Costs process results in the following outputs:
Work performance information
Cost forecasts
Change requests
Project management plan updates
Project documents updates
Organizational process assets updates
Work Performance Information Work performance information includes the calculated CV, SV, CPI, SPI, TCPI, and VAC values.
Cost Forecasts Cost forecasts include the calculated EAC and ETC.
Change Requests Change requests that result from this process typically involve a change to the cost baseline.
Project Management Plan Updates Project management plan updates typically include updates to the cost baseline and cost management plan, which should reflect any approved changes.
Project Documents Updates Project documents updates typically include cost estimates and the basis of estimates.
Organizational Process Assets Updates Organizational process assets updates typically include the following items:
Causes of variances
Corrective actions taken
Lessons learned
Ensuring Adherence to Quality Standards
The Control Quality process is responsible for ensuring that project deliverables conform to the quality standards as laid out in the quality management plan. This inspection can be carried out by using several tools and techniques, such as control charts and testing, in order to satisfy customer requirements.
Control Quality
The Control Quality process identifies the causes of poor product quality or processes and makes recommendations to bring them up to the required levels. Quality control is practiced throughout the project to identify and remove the causes of unacceptable results.
According to the PMBOK® Guide, project management teams should have a working knowledge of statistical control processes in order to effectively analyze information as part of quality control activities. In particular, project management teams should understand the following:
Prevention versus inspection. Prevention entails preventing errors from occurring, whereas inspection refers to catching and resolving defects before the product is released to the customer.
Attribute sampling versus variable sampling. Attribute sampling refers to the measurements taken to determine whether they meet one of two options: conforming or nonconforming, or variable sampling rates measurements on a continuous scale to measure the degree of conformance.
Tolerances versus control limits. Tolerances refer to a range of acceptable results, whereas control limits identify boundaries of what is considered to be statistically stable within a process.
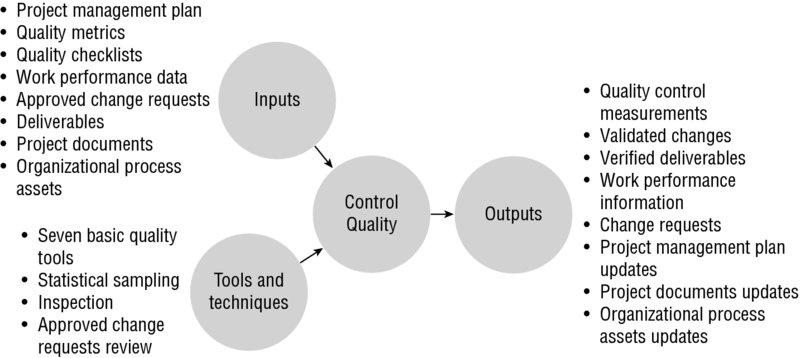
Figure 5.9 shows the inputs, tools and techniques, and outputs of the Control Quality process.
Know the following inputs of the Control Quality process:
Project management plan
Quality metrics
Quality checklists
Work performance data
Approved change requests
Deliverables
Project documents
Organizational process assets
Project Management Plan The project management plan contains the quality management plan, which is used to carry out the Control Quality process.
Quality Metrics Quality metrics provide the basis for measuring project or product quality attributes in this process.
Quality Checklists Quality checklists in this process are used to ensure that the set of required steps determined in the Plan Quality process are completed.
Work Performance Data Work performance data allow the project team to evaluate actual versus planned progress in the areas of technical performance, schedule performance, and cost performance.
Approved Change Requests Approved change requests are requested changes that were approved through the Perform Integrated Change Control process and submitted as an input for implementation.
Deliverables Part of achieving quality is ensuring that all deliverables are completed successfully. Deliverables will be verified as part of this process.
Project Documents According to the PMBOK® Guide, project documents typically used as part of this process include process documentation, quality audit reports, training plans, and agreements.
Organizational Process Assets The following organizational process assets are used by this process:
Standards, policies, and guidelines relating to quality standards
Procedures for reporting and communicating issues and defects
Tools and Techniques of Control Quality
Be familiar with the following tools and techniques of the Control Quality process and how they are used in this process:
Seven Basic Quality Tools
Statistical sampling
Inspection
Approved change requests review
Seven Basic Quality Tools Seven Basic Quality Tools used to control quality are similar to those described in Chapter 3 as part of the Plan Quality Management process, meaning that they have been incorporated into the quality management plan.
As a refresher, here is a brief explanation for each of the seven tools:
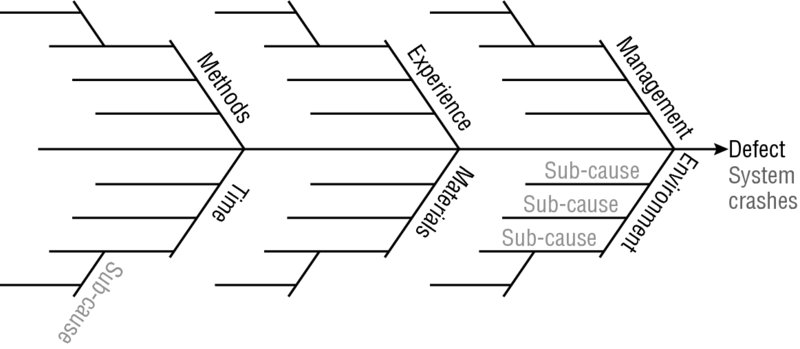
Cause-and-Effect Diagrams Cause-and-effect diagrams, also known as Ishikawa or fishbone diagrams, help identify root causes of issues. The idea is to determine the possible issues or effects of various factors. A cause and its potential sub-causes are plotted on the diagram, which resembles the skeleton of a fish. Figure 5.10 shows what the cause-and-effect diagram may look like.
Flowcharts Flowcharts are diagrams that show the logical steps that must be performed to accomplish an objective; they can also show how the individual elements of a system interrelate. Flowcharting helps identify where quality problems might occur on the project and how problems occur.
Checksheets Checksheets, also known as tally sheets, are used as data-gathering checklists, such as gathering data during inspections.
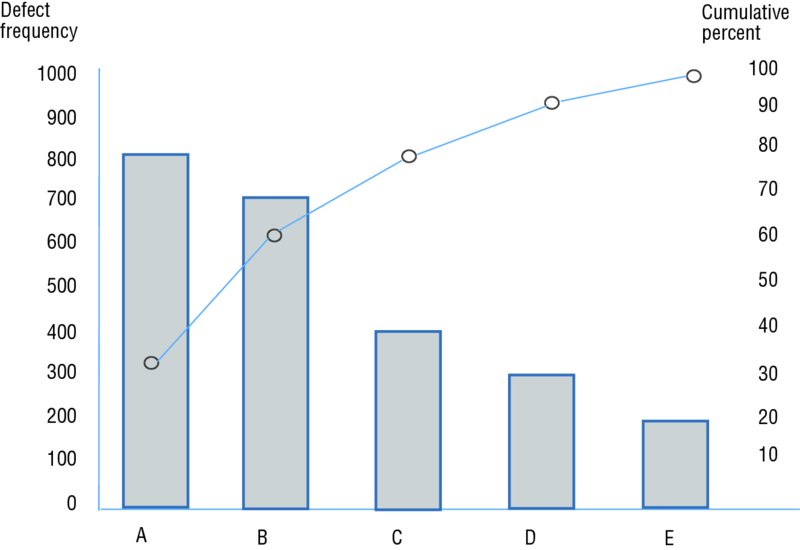
Pareto Diagrams Pareto diagrams are named after Vilfredo Pareto, who is credited for discovering the theory behind them, which is based on the 80/20 rule. The 80/20 rule as it applies to quality states that a small number of causes (20 percent) create the majority of the problems (80 percent). Pareto theorized that you get the most benefit by spending the majority of time fixing the most important problems.
The information shown in Table 5.4 is plotted on an example Pareto diagram shown in Figure 5.11.
The problems are rank-ordered according to their frequency and percentage of defects. The defect frequencies in this figure appear as black bars, and the cumulative percentages of defects are plotted as circles. The rank ordering of these problems demonstrate where corrective action should be taken first.
Histograms Histograms are bar charts that depict the distribution of variables over time. In the Control Quality process, the histogram usually depicts the attributes of the problem or situation.
Control Charts Control charts measure the results of processes over time and display the results in graph form. They provide a way of measuring variances to determine whether process variances are in or out of control.
A control chart is based on sample variance measurements. From the samples chosen and measured, the mean and standard deviation are determined. Quality is usually maintained—or said to be in control—in plus or minus three standard deviations, also referred to as the upper and lower control limits.
Out-of-control variances should be investigated to determine whether corrective action is needed.
For reference, know that standard deviation, or sigma, is equal to the following levels of quality:
±1 sigma is equal to 68.27 percent
±2 sigma is equal to 95.46 percent
±3 sigma is equal to 99.73 percent
±6 sigma is equal to 99.99 percent
If the process measurements fall in the control limits, then 99.73 percent (3 sigma) of the parts going through the process will fall in an acceptable range of the mean.
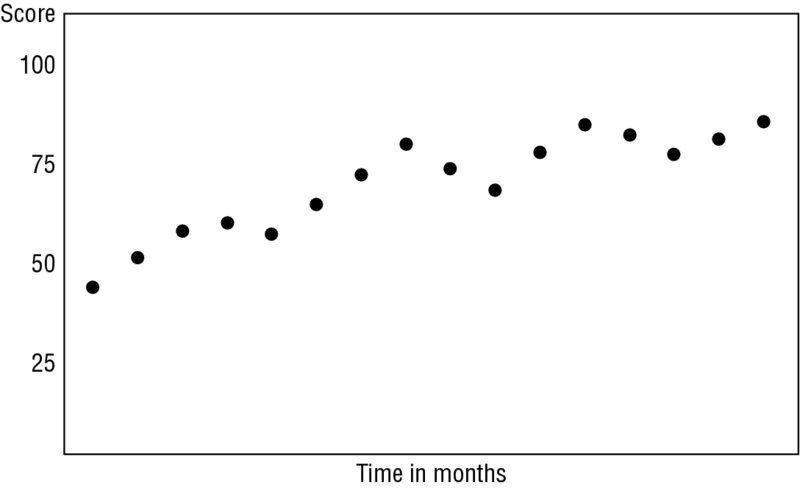
Scatter Diagrams Scatter diagrams use two variables, one called an independent variable, which is an input, and one called a dependent variable, which is an output. Scatter diagrams display the relationship between these two elements as points on a graph. This relationship is typically analyzed to prove or disprove cause-and-effect relationships.
Statistical Sampling Statistical sampling involves taking a sample number of parts from the whole population and examining them to determine whether they fall in acceptable variances. The quality management plan defines how to measure the results.
Inspection Inspection involves physically looking at, measuring, or testing results to determine whether they conform to the requirements or quality standards. Inspection will tell you where problems exist and gives you the opportunity to correct them, thus leading to quality improvements. Here’s some additional information to know about inspections:
Inspections might occur after the final product is produced or at intervals during the development of the product to examine individual components.
Inspections are also known as reviews and peer reviews.
Measurements that fall in a specified range are called tolerable results.
One inspection technique uses measurements called attributes. Attribute sampling is used to verify conformance and nonconformance to predefined specifications.
Approved Change Requests Review Change requests that have been approved and implemented are reviewed to ensure that they were implemented correctly.
Outputs of Control Quality
The Control Quality process results in the following outputs:
Quality control measurements
Validated changes
Verified deliverables
Work performance information
Change requests
Project management plan updates
Project documents updates
Organizational process assets updates
Quality Control Measurements Quality control measurements include the results of the quality control activities performed during this process.
Validated Changes Validated changes are the results of changes, defect repairs, or variances that have been inspected and corrected.
Verified Deliverables Verified deliverables are deliverables that have been taken through the tools and techniques of this process to determine if they are correct and accurate.
Work Performance Information Work performance information reflects the performance data that has been gathered and analyzed using the various tools and techniques described as part of this process.
Change Requests Change requests to the project management plan may result from carrying out this process and will be submitted to the Perform Integrated Change Control process.
Project Management Plan Updates Updates to the project management plan typically consist of changes to the quality management plan and the process improvement plan.
Project Documents Updates Project documents updates typically include updates to quality standards, audit reports, and process documentation.
Organizational Process Assets Updates Organizational process assets updates include the following items:
Completed checklists
Lessons-learned documentation
Updating the Risk Register
Identifying new risk, assessing old risks, and implementing the appropriate response strategies should occur as an integral part of monitoring and controlling activities. This is important to managing the impact of risks on the project and is carried out through the Control Risks process.
Control Risks
The Control Risks process should be carried out throughout the project life cycle. In addition to the activities just mentioned, this process is responsible for improving the risk management processes in a number of ways:
Evaluating risk response plans that are put into action as a result of risk events
Monitoring the project for risk triggers
Reexamining existing risks to determine if they have changed or should be closed out
Monitoring residual risks
Reassessing project assumptions and determining validity
Ensuring that policies and procedures are followed
Ensuring that risk response plans and contingency plans are put into action appropriately and are effective
Ensuring that contingency reserves (for schedule and cost) are updated according to the updated risk assessment
Evaluating the overall effectiveness of the risk processes
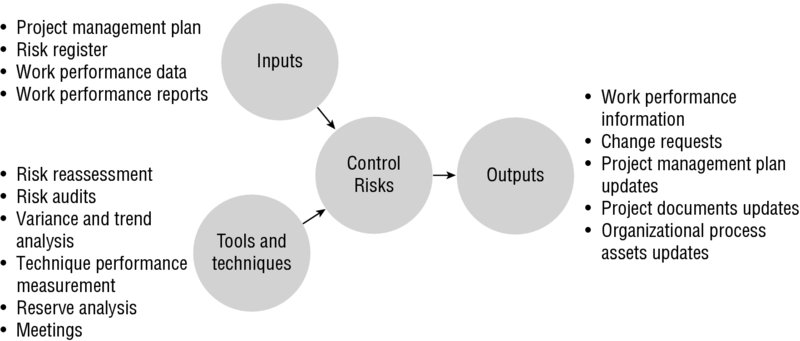
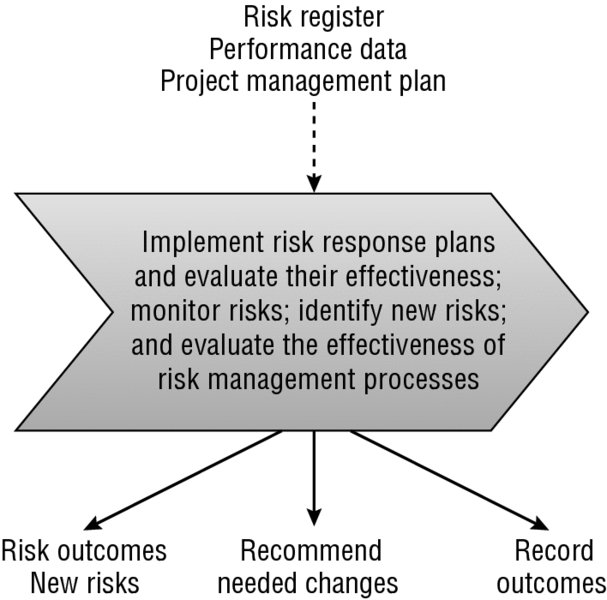
Figure 5.14 shows the inputs, tools and techniques, and outputs of the Control Risks process.
There are four inputs of the Control Risks process that you should know:
Project management plan
Risk register
Work performance data
Work performance reports
Project Management Plan The project management plan includes the risk management plan, which provides the necessary information for carrying out this process.
Risk Register The risk register contains all the documented information of the identified risks. It tracks and ranks individual risks, identifies the risk owner, describes risk triggers and residual risks, and lists the response plans and strategies you should implement in the event of an actual risk event. The risk register is fluid, meaning that additions, subtractions, and updates will be made throughout the project.
Work Performance Data Work performance data is used in monitoring previously identified risks. It also includes information that may assist in the identification of risk triggers, indicating that a risk event is about to occur.
Work Performance Reports Work performance reports are examined from the perspective of risk and include information such as status reports, performance measurements, and forecasts.
Tools and Techniques of Control Risks
Know the following tools and techniques of the Control Risks process:
Risk reassessment
Risk audits
Variance and trend analysis
Technical performance measurement
Reserve analysis
Meetings
Risk Reassessment Periodic, scheduled reviews of identified risks, risk responses, and risk priorities should occur during the project. The idea is to monitor risks and their status and determine whether their consequences still have the same impact on the project objectives as when they were originally planned.
Risk Audits Risk audits are specifically used to examine the implementation of response plans and their effectiveness at dealing with risks and their root causes. They are also used to determine the effectiveness of the risk management processes.
Variance and Trend Analysis Variance and trend analysis looks at the planned results in comparison with the actual results. Deviations found may indicate risk.
Technical Performance Measurement This tool and technique compares the technical accomplishments of project milestones completed during the Executing processes to the technical milestones defined in the Planning processes. Existing variations may indicate risk.
Reserve Analysis Reserve analysis compares the amount of contingency reserve remaining to the amount of risk remaining in the project. The idea is to determine whether the contingency reserve is sufficient.
Meetings Meetings, typically held in the form of status meetings, are used as a means of discussing risks with the project team.
Outputs of Control Risks
The Control Risks process produces the following five outputs:
Work performance information
Change requests
Project management plan updates
Project documents updates
Organizational process assets updates
Work Performance Information Work performance information reflects the risk-related information that has been gathered and analyzed as part of this process.
Change Requests Recommended corrective actions or preventive actions may result from contingency plans or workarounds that were implemented as part of the Control Risks process. Change requests are submitted to the Perform Integrated Change Control process.
Project Management Plan Updates The project management plan may include updates to the following documents, among others:
Schedule management plan
Cost management plan
Quality management plan
Procurement management plan
Human resource management plan
WBS within the scope baseline
Schedule baseline
Cost baseline
Project Documents Updates The result of carrying out this process typically includes updates to the risk register, assumptions log, and technical documentation.
As noted earlier, the risk register is typically updated as a result of carrying out this process, and typically results in the following:
Addition of newly identified risks
Updates to the probability and impact, priority, response plans, and ownership of previously identified risks
Outcome of the project’s risks and their risk responses
Organizational Process Assets Updates The following updates are typically made to the organizational process assets:
Risk management templates
Risk breakdown structure (RBS)
Lessons learned
Assessing Corrective Actions
As the need for corrective actions arise, the team may respond by submitting changes requests. All change requests are reviewed by the change control board through the Perform Integrated Change Control process. The issue log should be assessed regularly for needed corrective action so that unresolved issues receive the appropriate follow-up. Responses to open issues should be made by using the necessary tools and techniques so that impact on the schedule, cost, and resources is minimized.
Perform Integrated Change Control
The Perform Integrated Change Control process, part of the Project Integration Management Knowledge Area, manages the project’s change requests. This process approves or rejects changes and also manages changes to the deliverables. All change requests generated by other processes are submitted to the Perform Integrated Change Control process for review before implementation. Changes may involve corrective actions, preventive actions, and defect repair.
According to the PMBOK® Guide, the responsibilities of the Perform Integrated Change Control process are primarily as follows:
Influencing the factors that cause change control processes to be circumvented
Promptly reviewing and analyzing change requests as well as reviewing and analyzing corrective and preventive actions
Coordinating and managing changes across the project
Maintaining the integrity of the project baselines and incorporating approved changes into the project management plan and other project documents
Documenting requested changes and their impacts
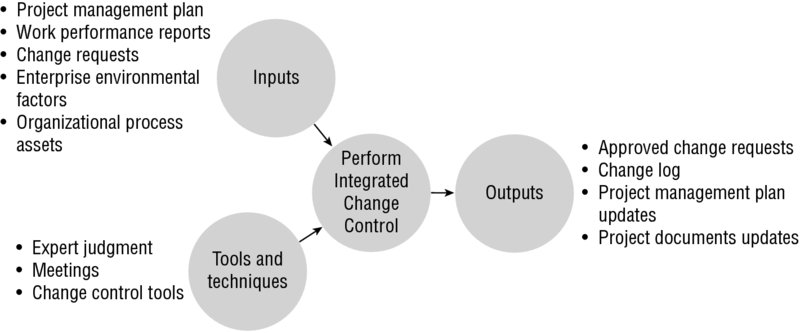
Figure 5.15 shows the inputs, tools and techniques, and outputs of the Perform Integrated Change Control process.
FIGURE 5.15 Perform Integrated Change Control process
Inputs of Perform Integrated Change Control
There are five inputs of the Perform Integrated Change Control process:
Project management plan
Work performance reports
Change requests
Enterprise environmental factors
Organizational process assets
Project Management Plan The project management plan includes several documents that will be used in this process, such as the approved schedule, budget, and scope. These documents will be used when reviewing submitted changes.
Work Performance Reports Work performance reports include performance results, such as status of deliverables, schedule progress, and reports containing earned value management.
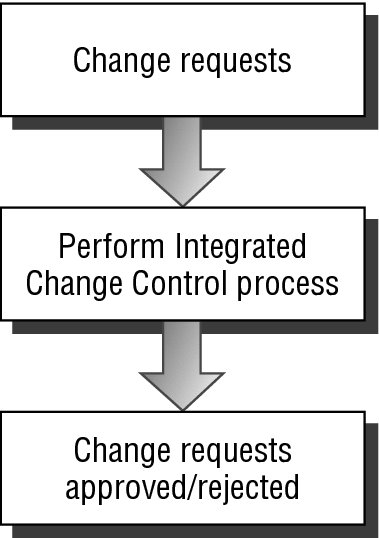
Change Requests Change requests include requests that have been submitted for review and approval, such as corrective action, preventive action, and defect repairs. All change requests must be submitted in writing. Figure 5.16 reiterates that all change requests are submitted as inputs into the Perform Integrated Change Control process.
Enterprise Environmental Factors Enterprise environmental factors used to carry out this process include the PMIS, which includes the configuration management system and scheduling software.
Organizational Process Assets The following organizational process assets are used by this process:
Change control and authorization procedures
Process measurement database
Configuration management knowledge base
Project files
Tools and Techniques of Perform Integrated Change Control
The Perform Integrated Change Control process has three tools and techniques that you will need to be familiar with:
Expert Judgment The following sources of expert judgment may be used in this project:
The project management team
Key stakeholders
Subject matter experts
Consultants
Industry or professional groups
The project management office, if applicable
Meetings Change control meetings are meetings in which the change control board reviews and makes decisions on submitted change requests. Roles and responsibilities for a change control board, when they are needed on the project, are clearly defined and agreed upon by appropriate stakeholders. The change control board is established to review all change requests and is given the authority to approve or deny them. This authority is defined by the organization. The decisions should be documented and reviewed by stakeholders.
Change Control Tools Change control tools come in the form of manual or automated systems that are used to help facilitate the change management process.
You will also need to know about configuration management systems and change control systems, which are not listed as tools and techniques of the process but directly influence how the process is carried out.
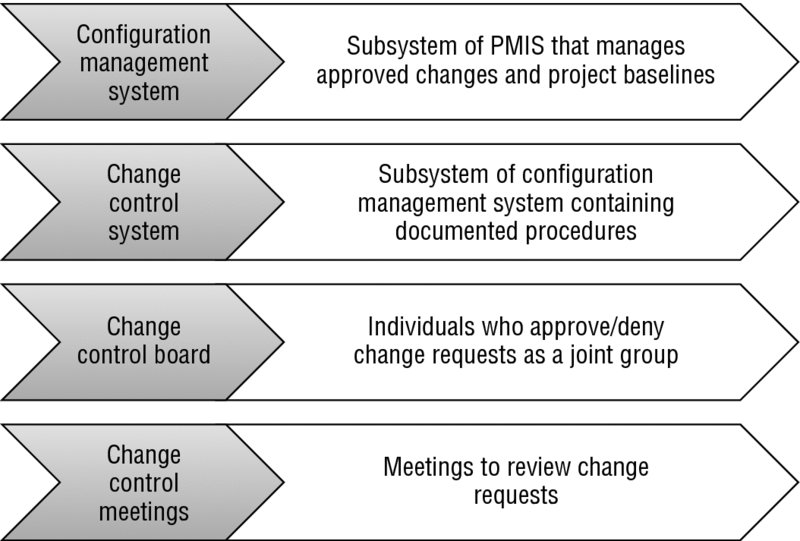
Configuration Management System Configuration management is generally a subsystem of the PMIS. It involves managing approved changes and project baselines. According to the PMBOK® Guide, the following activities are associated with configuration change management in this process:
Configuration Identification Configuration identification describes the characteristics of the product, service, or result of the project. This description is the basis used to verify when changes are made and how they’re managed.
Configuration Status Accounting This includes the approved configuration identification, the status of proposed changes, and the status of changes currently being implemented.
Configuration Verification and Auditing Verification and audits are performed to determine whether the configuration item is accurate and correct and to make certain the performance requirements have been met.
Change Control System Change control systems are documented procedures that describe how the deliverables of the project and associated project documentation are controlled, changed, and approved. Here are some things to note about change control systems:
Often describe how to submit change requests and how to manage change requests
Are usually subsystems of the configuration management system
Track the status of change requests
Ensure that changes that are not approved are tracked and filed in the change control log for future reference
Define procedures that detail how emergency changes are approved
In addition, you should know about implementing these two types of systems. The PMBOK® Guide gives these three objectives for implementing and using configuration management systems and change control processes:
Establish a method to consistently identify changes, request changes to project baselines, and analyze and determine the value and effectiveness of the changes.
Continuously authenticate and improve project performance by evaluating the impact of each change.
Communicate all change requests, whether approved, rejected, or delayed, to all the stakeholders.
Figure 5.17 provides a brief overview of the configuration management and change control systems.
Know the four outputs of the Perform Integrated Change Control process:
Approved Change Requests This output reflects the list of submitted changes that have been approved by the change control board.
Change Log A change log is first created out of this process and then updated regularly throughout the project’s life cycle. Change logs typically include a log of all changes requested, along with updates and decisions made on those changes.
Project Management Plan Updates Project management plan updates are made to reflect changes that have been approved or rejected after going through the Perform Integrated Change Control process. This may include changes to the following documents:
Baselines
Subsidiary management plans
Project Documents Updates Project documents updated may include updates to any documents impacted by approved or rejected changes as well as the change request log, which will reflect the status update of the change requests.
Communicating Project Status
Communicating project status occurs throughout activities related to the Executing and Monitoring and Controlling processes, as seen throughout this chapter, as well as in Chapter 4, “Executing the Project,” of this book. While project reports help to align the project with the business needs, it is through the Control Communications process that the project manager ensures that communication requirements of stakeholders are met.
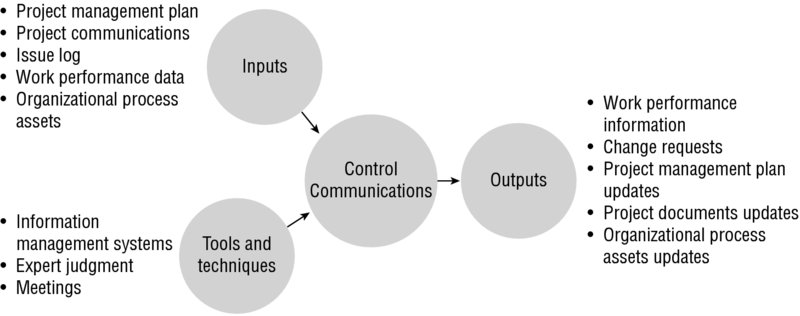
Control Communications
The Control Communications process is responsible for monitoring and controlling communications throughout the duration of the project. It is through this process that the project manager ensures that the communication requirements of stakeholders are met, along with their needs and expectations.
Figure 5.18 shows the inputs, tools and techniques, and outputs of the Control Communications process.
The Control Communications process includes the following inputs:
Project management plan
Project communications
Issue log
Work performance data
Organizational process assets
Project Management Plan The project management plan contains the project management baseline data used to monitor and compare results. Deviations from this data are reported to management.
Project Communications Project communications are produced as the project work is executed. Through this process, communications are monitored; the project manager may take action as needed based on this communication including releasing information to stakeholders.
Issue Log As the work proceeds forward, the project manager monitors issues documented within the issue log, to ensure that resolution is reached.
Work Performance Data Work performance data is collected throughout the Monitoring and Controlling processes. Information such as status of deliverables, schedule, and costs is used in the Control Communications process.
Organizational Process Assets The following organizational process assets are used in the Control Communications process:
The organization’s policies and procedures for project communications
Report templates
Requirements relating to communication and/or security
Tools and Techniques of Control Communications
You should know the following three tools and techniques of the Control Communications process:
Information management systems
Expert judgment
Meetings
Information Management Systems The information management system can be used by the project manager to capture, store, and disseminate information to project stakeholders. These systems may be complex or could be as simple as a spreadhsheet.
Expert Judgment Expert judgment is key to assessing project communication and information to understand its impact and then make decisions accordingly.
Meetings Meetings are typically used in the Control Communications process to facilitate discussion among project team members and other relevant subject matter experts. Examples of discussions that occur as part of this process include the analysis and decision making of issue resolution and dissemination of information.
Outputs of Control Communications
The Control Communications process results in five outputs:
Work performance information
Change requests
Project management plan updates
Project documents updates
Organizational process assets updates
Work Performance Information Work performance information consists of information that has been analyzed or summarized as a result of carrying out this process. As this information is captured and documented, it can then be distributed to the appropriate stakeholders.
Change Requests The following changes may be requested as a result of carrying out this process:
Recommended corrective actions to bring performance in alignment with the project management plan
Preventive actions to reduce probable future negative performance
New or revised estimates
Project Management Plan Updates Updates to the project management plan typically include the communications management plan and potentially the human resource management and/or stakeholder management plans.
Project Documents Updates Project documents typically updated as a result of carrying out this process include work performance reports, the issue log, and forecasts.
Organizational Process Assets Updates The organizational process assets may include updates to the following items:
Lessons-learned documentation
Report formats
Causes of issues
Corrective actions taken
Controlling Stakeholder Engagement
As the project moves forward, the project manager will need to continuously and carefully monitor the level of stakeholder engagement to ensure that expectations are well gauged and met. Stakeholders who are passive and not actively engaged may negative impact the project at a later point, such as introducing new requirements that could have been addressed earlier in the project life cycle. The project manager may need to adjust the strategy for managing stakeholder expectations and engagement levels as the project progresses.
Control Stakeholder Engagement
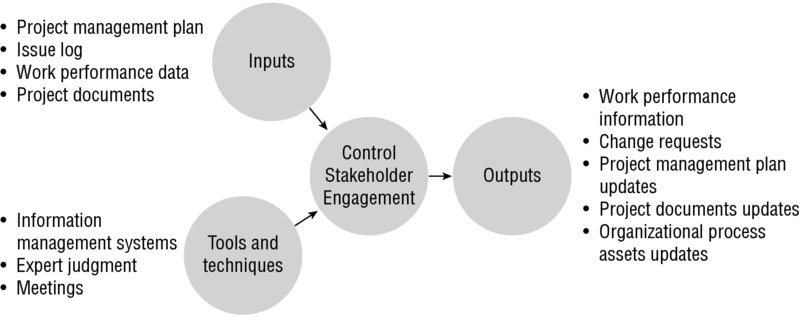
The Control Stakeholder Engagement process belongs to the Project Stakeholder Management Knowledge Area, and is responsible for monitoring stakeholder relationships and adjusting the stakeholder management plan as a result of their engagement. As a result of this process, stakeholder engagement becomes more efficient and effective.
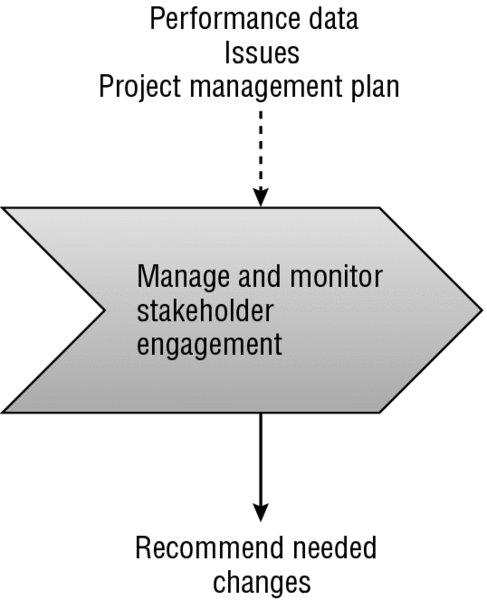
Figure 5.19 shows the inputs, tools and techniques, and outputs of the Control Stakeholder Engagement process.
FIGURE 5.19 Control Stakeholder Engagement process
Inputs of Control Stakeholder Engagement
There are four inputs of the Control Stakeholder Engagement process:
Project management plan
Issue log
Work performance data
Project documents
Project Management Plan The project management plan contains the stakeholder management plan, which guides the project manager in carrying out the process.
Issue Log The issue log documents all issues identified, as well as updates and progress on their resolution. Issues may need to be updated as this process is performed.
Work Performance Data Work performance data includes measurements captured throughout the Monitoring and Controlling processes. Examples of data that may be used as part of this process include what work has been completed, change requests submitted, and technical performance measurements.
Project Documents Documents typically referred to as part of the Control Stakeholder Engagement process include the schedule, stakeholder register, issue and change logs, and project communications.
Tools and Techniques of Control Stakeholder Engagement
The Control Stakeholder Engagement process has three tools and techniques that you will need to be familiar with:
Information Management Systems Information management systems can be used to capture, store, and disseminate information to stakeholders as needed. Using these systems, the project manager can actively monitor the level of stakeholder engagement as part of this process.
Expert Judgment As the project progresses forward, changes to the list of stakeholders may occur. Expert judgment may be needed to reassess stakeholders. Expertise sought may include individuals such as senior management, other project managers, or those with specialized knowledge in specific areas.
Meetings Meetings are often used to bring experts together to analyze information obtained when carrying out a process and making decisions based on this information.
Outputs of Control Stakeholder Engagement
Know the five outputs of the Control Stakeholder Engagement process:
Work Performance Information As with other processes that fall in the Monitoring and Controlling process group, performance data that has been captured and analyzed is documented as an output. This information is critical in making decisions at the project level.
Change Requests As the process is carried out, corrective actions or preventive actions may be needed. These are submitted in the form of change requests, which are then funneled into the change control process.
Project Management Plan Updates Various subsidiary plans, such as the stakeholder management plan and change management plan, may need to be updated as a result of carrying out this process.
Project Documents Updates Project documents typically updated as a result of controlling stakeholder engagement include the stakeholder register and the issue log.
Organizational Process Assets Updates According to the PMBOK® Guide, the following updates are typically made to the organizational process assets:
Stakeholder notifications and feedback
Project reports and presentations
Project records
Lessons learned documentation
Bringing the Processes Together
In this chapter, you learned all about the processes that fall in the Monitoring and Controlling process group. If anything is amiss, the processes in this group work together to bring the project back in line with the project management plan.
In addition to correcting any differences between the actual work and the project management plan, the Monitoring and Controlling process group is responsible for preventive actions. During these processes, changes are verified and managed, and the status of identified risks is monitored in order to manage hurdles as soon as they arise. This process group is the project’s gatekeeper.
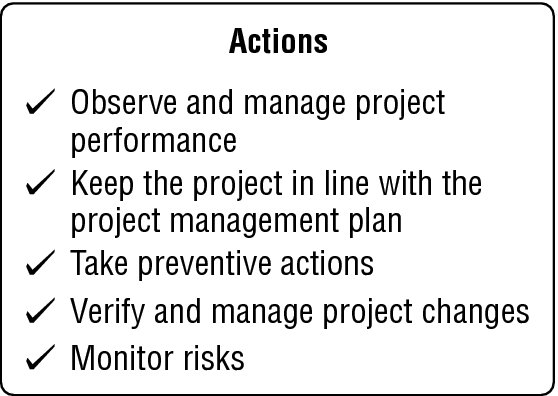
Figure 5.20 summarizes the objectives in the Monitoring and Controlling process group.
FIGURE 5.20 Process group objectives: Monitoring and Controlling
In total, the Monitoring and Controlling process group contains 11 processes, covering nearly all of the Knowledge Areas:
Project Integration Management
Project Scope Management
Project Time Management
Project Cost Management
Project Quality Management
Project Communications Management
Project Risk Management
Project Procurement Management
Project Stakeholder Management
We will review the process interactions that occur in each Knowledge Area during the Monitoring and Controlling process group. This will help you understand how the processes work together.
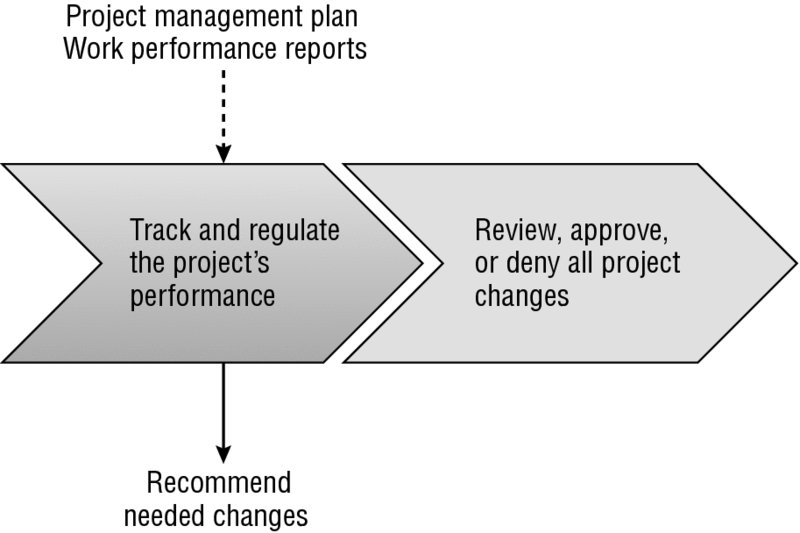
Project Integration Management Knowledge Area Review
Two key processes in the Monitoring and Controlling process group belong to the Project Integration Management Knowledge Area. Figure 5.21 shows how the project work is tracked and regulated as part of this Knowledge Area and how all project changes are approved or rejected. Changes are reviewed by the integrated change control system, which determines whether the changes are necessary and in the best interest of the project.
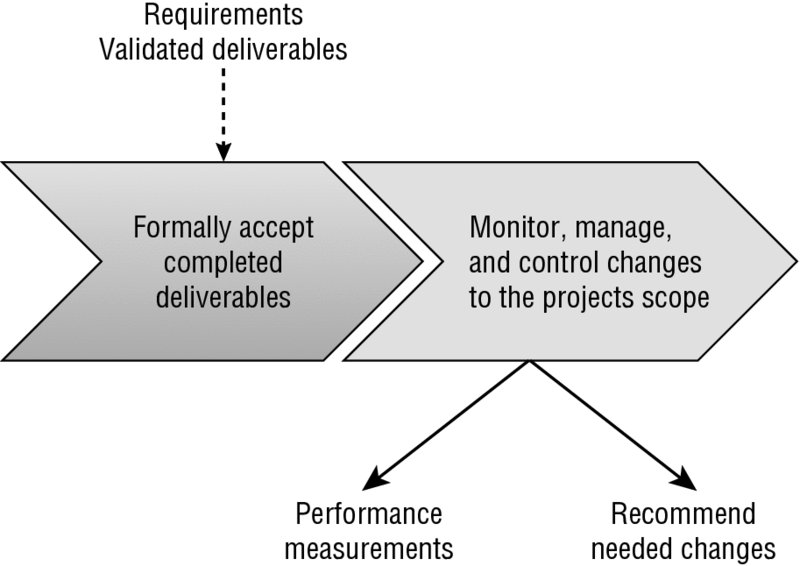
As you may recall, scope documents are necessary to keep the project focused by providing it with boundaries and defining exactly what it set out to accomplish (no more, no less). The two processes in the Project Scope Management Knowledge Area fall in the Monitoring and Controlling process group and ensure that the project is in line with the defined requirements.
Figure 5.22 shows how verified deliverables are formally accepted during this phase and how the project and product scope are monitored and managed. Changes made to the project scope are carefully watched. If something does not align with the project’s defined requirements, then recommended changes are made. Performance measurements are also recorded and are used in project quality processes and project communications.
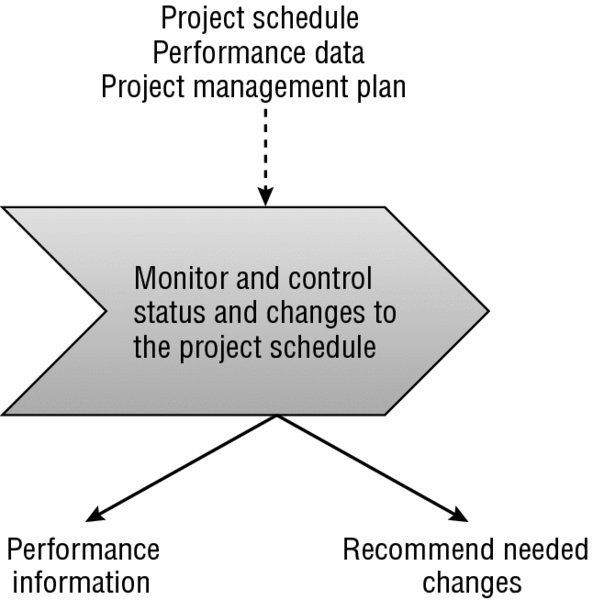
Only one process from the Project Time Management Knowledge Area occurs in the Monitoring and Controlling process group. This process is responsible for monitoring and controlling changes to the project schedule. Here, we are also concerned with monitoring the status of the project so that progress updates can be made. Performance measurements emerge from this step. The performance measurements will be important to monitoring and controlling quality and communications.
As Figure 5.23 shows, changes are recommended based on the progress and status of the project schedule.
During the monitoring and controlling of project costs, we use the budget developed during the execution of the project work. Figure 5.24 shows the single cost-related process in the Monitoring and Controlling process group.
As you may recall during our review of this process earlier in this chapter, the following items are generated out of this process:
Budget forecasts
Performance measurements, which will be used for monitoring and controlling quality and communications (similar to the performance data of the project schedule)
Recommended changes to bring the budget back in line with the project management plan as needed
Generating the budget forecasts and performance measurements involves the use of earned value management (EVM), which itself includes several formulas. Although we won’t go through the formulas and calculations here, you’ll need to remember the calculations and various performance measurements in EVM:
Planned value (PV)
Earned value (EV)
Actual cost (AC)
Schedule variance (SV)
Cost variance (CV)
Schedule performance index (SPI)
Cost performance index (CPI)
Estimate at completion (EAC)
Estimate to complete (ETC)
To-complete performance index (TCPI)
Project Quality Management Knowledge Area Review
Monitoring and controlling quality involves monitoring and recording the results of quality activities that have been executed in addition to assessing performance. Figure 5.25 shows how several items carry out this purpose.
The results of the single quality-related process in the Monitoring and Controlling process group include the following items:
Quality measurements, which are submitted back into the Perform Quality Assurance process (which is part of the Executing process group)
Verified deliverables and changes, to make sure the results of the project work are correct
Recommended changes, which are made for changes or deliverables that have been rejected from a quality standpoint
To generate these results, you may recall that several tools and techniques were used. You should be familiar with the Seven Basic Quality Tools for the exam. Also note that those conducting quality control activities should have a working knowledge of sampling and probability. At the least, project teams should be familiar with the following:
Prevention
Attribute sampling
Tolerances and control limits
Project Communications Management Knowledge Area Review
Monitoring and controlling project communications relies on performance information and budget forecasts; these are collected and distributed as performance reports. The recipients of these reports are outlined in the communications management plan. Figure 5.26 displays the results of the communications process in the Monitoring and Controlling process group.
Measurements of the project’s progress and forecasts
Any recommended changes made to bring the project back in line with the project management plan, implement preventive actions, or accommodate changes that were made to the product or project as a result of managing stakeholder expectations
Project Risk Management Knowledge Area Review
The Project Risk Management Knowledge Area has only one process that falls in the Monitoring and Controlling process group. As you may recall, this single process accomplishes a lot of things. Within this risk-related process, we will carry out the following actions:
Implement the risk response plans, which were developed in the Planning process group
Evaluate the effectiveness of the plans
Monitor the identified risks
Identify new risks
Evaluate the effectiveness of the risk management processes
As shown in Figure 5.27, carrying through these actions results in the following:
Actual outcomes of the identified risks
Newly identified risks
The documenting and recording of the risk outcomes for use by future projects
The documenting and recording of the risk audits that were conducted to evaluate the effectiveness of the risk response plans and the risk management processes
Any recommended changes to bring the project back in line with the project management plan as well as corrective actions and preventive actions (typically includes the implementation of contingency plans and workaround plans)
Project Procurement Management Knowledge Area Review
During monitoring and controlling of the project, vendor relationships and performance are managed and monitored. Figure 5.28 shows what occurs in the single procurement-related process that falls in the Monitoring and Controlling process group.
The following information is used throughout this process:
Procurement information, such as the procurement contracts and any documents relating to the procurements being administered
Vendor performance information, including internal performance reports and reports generated by the vendors
Approved changes, which typically involve changes to the contract terms and conditions
The project management plan, which contains the procurement management plan
As a result of the Control Procurements process, recommended changes are made to bring vendor performance and progress back in line with the project management plan.
Project Stakeholder Management Knowledge Area Review
As part of managing stakeholder expectations, the project manager must actively monitor the engagement of stakeholders throughout the project’s life cycle. This occurs through the single Monitoring and Controlling process that falls within the Project Stakeholder Management Knowledge Area. Figure 5.29 shows how this process interacts with other processes within the Monitoring and Controlling process group.
FIGURE 5.29 Process interaction: stakeholder management
Keep in mind that the Monitoring and Controlling process group’s purpose is given away by its title. The processes in this process group are concerned with making sure the project (performance and status) is moving along as planned. In the event that this is not the case, corrective actions are issued and proactive measures are taken through preventive actions.
Review Questions
The Monitor and Control Project Work process results in all of the following except
Change requests
Preventive actions
Defect repairs
Deliverables
A project manager of a technical training company is working on a project that will automate the company’s course registration process. Due to the expertise involved, the company hired an external vendor to create the backend development of the registration system. While monitoring the project work, the project manager discovered that the vendor was two weeks behind schedule and about to miss an important milestone. What tool and technique did the project manager use to make this determination?
Agreements
Work performance data
Performance reporting
Work performance information
All of the following processes integrate with the Control Procurements process except
Close Procurements
Direct and Manage Project Work
Control Quality
Perform Integrated Change Control
Which of the following best describes the contract change control system?
Meetings where the change control board reviews and makes decisions on change requests submitted
A subsystem of the PMIS that manages approved changes and project baselines
A system that describes the processes needed to make contract changes
A system that describes how the deliverables of the project and associated project documentation are controlled, changed, and approved
While conducting earned value management, the project manager of a software development company receives a request from a stakeholder for the most current cost estimate report. Specifically, the stakeholder needs to know the value of the work completed against actual cost. Which formula will the project manager use to calculate this information?
EV ÷ AC
EV – AC
EV – PV
EV ÷ PV
During a project status meeting, the project manager provided the room of stakeholders with results of a recent quality audit. After the group discussed the results, it was determined that a minor adjustment needed to be made to bring the variance levels under control. The project sponsor, also a meeting participant, agreed and gave her approval to implement the changes immediately. What should the project manager do next?
Inform the quality management team and implement the changes that day.
Obtain the customer’s approval for the change, even though the project sponsor has approved it.
Document the change request and submit it for review by the change control board.
Bypass the change control process because the change has already received approval by a high authority.
After the implementation of yet another risk response plan, the project manager became concerned about whether the budget was sufficient enough to cover the remaining identified risks. Which of the following tools and techniques can the project manager use to evaluate the status of the budget in terms of risk?
Risk reassessment
Risk audits
Budget analysis
Reserve analysis
If budget at completion (BAC) is 1,500 and estimate at completion (EAC) is 1,350, what is the current variance at completion (VAC)?
150
75
0.90
1.11
A project manager is in the process of determining the existing variance between the schedule baseline and actual schedule. To determine the variance, the project manager used schedule variance (SV) and schedule performance index (SPI). The project manager is currently in what process?
Control Costs
Control Schedule
Control Quality
Control Communications
What level of accuracy does 3 sigma represent?
68.27 percent
95.46 percent
99.73 percent
99.99 percent
Assuming that the work will proceed as planned, what is the estimate to complete (ETC) if the estimate at completion (EAC) is $250,000 and actual cost (AC) is $50,000?
$300,000
Reestimate
$250,000
$200,000
What does the to-complete performance index (TCPI) value tell you?
The measurement of progress to date against the progress planned
The projected performance level the remaining work of the project must achieve to meet the BAC or EAC
The expected total cost of a work component, a schedule activity, or the project at its completion
The amount of effort remaining based on the activities completed to date and what is thought to occur in the future
Which process is responsible for ensuring that communication requirements of stakeholders are met?
Manage Stakeholder Engagement
Manage Communications
Control Stakeholder Engagement
Control Communications
Polly is a project manager tasked with leading a project that will establish business continuity management practices for a major retail coffee chain. The disaster recovery procedures deliverable has just been verified. What process is Polly likely to take the deliverable through next?
Control Scope
Validate Scope
Close Project or Phase
Monitor and Control Project Work
Polly is a project manager tasked with leading a project that will establish business continuity management practices for a major retain coffee chain. She has been asked by the project sponsor to provide an update of the expected total cost of the project work. Currently, the project is expected to continue to experience steady performance. What value will Polly report at the next meeting if the BAC = $500,000, EV = $300,000, and AC = $350,000?
Insufficient information provided
–$50,000
$550,000
$583,431
If earned value (EV) is 20,000 and planned value (PV) is 35,000, what can you determine about the project?
Ahead of schedule
Under budget
Behind schedule
Over budget
Beans by the Dozen is a company that ships precooked beans to restaurants in the Western United States. Recently, the company has decided to expand their operation to the Northern regions of the country. Ben, the project manager, has just implemented three changes approved by the change control board. What is Ben likely to do next in regard to these changes?
Approve the changes
Validate the changes
Update schedule and under budget the change log
Communicate an update to stakeholders
Based on the following information, what can you determine about the project? Earned value (EV) = 160,000, actual cost (AC) = 110,000, planned value = 175,000
The project is behind.
The project is ahead of schedule and under budget.
The project is behind schedule and over budget.
The project is ahead of schedule and under budget.
All of the following are outputs of the Control Stakeholder Engagement process except
Project documents updates
Change requests
Work performance data
Work performance information
Beans by the Dozen is a company that ships precooked beans to restaurants in the Western United States. Recently, the company has decided to expand their operation to the Northern regions of the country. The project is currently behind schedule, and the project manager has just been asked to work his magic to get the project back on track. If earned value (EV) is $60,000, actual cost (AC) is $85,000, and planned value (PV) is $75,000, what options are available to the project manager?

 Monitoring and Controlling is the fourth of the five project management process groups and accounts for 25 percent of the questions on the PMP® exam. The processes in the Monitoring and Controlling process group concentrate on monitoring and measuring project performance to identify variances from the project management plan and get them back on track. Regularly monitoring project performance provides insight into the current state of the project and allows you to correct areas that are falling off track before they impact your project significantly. The Monitoring and Controlling process group is concerned not only with monitoring the project work but also with the project as a whole. In multiphase projects, this process group coordinates the project phases.