Chapter 14
Planning the Project, Stages and Work Packages
In This Chapter
Understanding why you need to plan
Fitting in with organisational formats and requirements
Achieving huge planning power with the product-based approach
Fitting activity planning in with the products
Planning resources
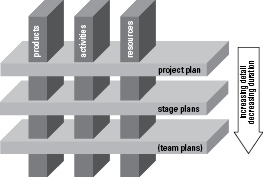
Looking at levels of plan – project, stage, and team (Work Package)
Knowing who does the planning and who checks it
Welcome to planning – probably the most exciting chapter in the book! This chapter covers an amazingly powerful approach to planning in projects, but one that the PRINCE2 community widely misunderstands and completely undervalues. Many people leave out this approach because they can’t really see what product planning is all about. And many PRINCE2 trainers don’t really understand product planning either.
Without planning you have no effective control, and many projects go wrong right at the start because people try to cut back on planning or leave it out altogether in order to save time. But unless you know where you’re supposed to be in the project, you aren’t able to detect whether you’re off track. But the plans are also important to help you find problems and find them early, so that you can solve problems on the plan, not in the project.
Part of a resistance to planning is experience of over-planning in projects where managers have seen piles of documents and diagrams that are never referred to again once they have been approved. But the answer to the problem of over-planning – or under-planning for that matter – is not to go to the opposite extreme. The answer is the correct level of planning, in line with the control needs of the project.
![]() Some people think that they can speed things up by leaving out planning. This doesn’t work. However, the popular ‘never mind all this planning – get on with the real work’ approach forms the core of another project method in widespread use – JFDI or ‘just flipping DO IT’. Sadly, the failure to plan and so avoid the obvious problems has led to many JFDI project disasters.
Some people think that they can speed things up by leaving out planning. This doesn’t work. However, the popular ‘never mind all this planning – get on with the real work’ approach forms the core of another project method in widespread use – JFDI or ‘just flipping DO IT’. Sadly, the failure to plan and so avoid the obvious problems has led to many JFDI project disasters.
Thinking about the Planning
The answer to the problem of under-planning or over-planning is some careful thinking to getting the level of detail right. Over-planning hurts the project: The plan takes longer than necessary to draw up during Initiation, and then that plan has to be maintained right through the project, wasting further time. Under-planning in its turn means that important things go unnoticed and obvious conflicts, such as double-booking project staff, don’t get seen with the result that problems hit the project later on when it’s much harder to deal with them.
So your evaluation of what degree of planning and control you need in any particular project is an important one. But you base that decision on the nature of the project and the environment you run it in, so you can’t look up any easy calculations in a book. Instead, the decision is a matter of judgement and the Project Manager and Project Board must work it out between them.
For example, if you run a project that’s pretty similar to six previous ones that all ran successfully, then your planning may be relatively light because you know exactly what you’re dealing with. If you work with very experienced staff, you may need to give them less detailed information on building project deliverables than if they’re very inexperienced. Again, a project that is time-critical needs much more careful planning than one where the timing isn’t so vital. The list goes on and you can add your own factors for your own project environment.
Considering organisational requirements
Before doing the planning, you need to check whether there are any organisational constraints on how you do the planning and how you present the plans. If you’re a consultant this is especially important, because you need to make sure that you work in line with your client’s corporate standards.
Thinking about money
You also need to think about types of budget when drawing up plans. A PRINCE2 Project Manager has three areas of budget to control. The first pot of money is for the planned work and is always available to the Project Manager. But the other two (the change and risk budgets) are conditional and can only be used under specific circumstances.
Budgeting for project, stage, and team plans
After the project is planned out you can cost it and have an idea of the total budget. For the more detailed Stage Plans, a stage budget can be calculated and approved for that stage, and you do the same at the Team Plan level for a Work Package. It can be cyclical though. If the project plan shows the project to be too expensive, then the plans more easily allow adjustments to things such as scope and resource to get the cost down to what is affordable.
Budgeting for change
But what about finance for elements that aren’t planned for? Allocating a change budget avoids the Project Manager running back to the board for every change in a stage, no matter how small. The change budget allows the Project Manager to carry out changes up to a certain level without having to refer back to the board each time. This can be made more refined still if you decide to make use of an intermediate level of authority between the Project Manager and the Project Board; a Change Authority. You can find more information on change control in Chapter 16 that covers the Change theme.
Change budgets are conditional. If nobody wants any changes, the Project Manager doesn’t have authority to use that money. The Project Manager can’t use the budget to make up for any overspending on planned work.
Budgeting for risk
The overall risk budget is normally calculated when the Project Board agrees the risk control actions, but the general operation of the risk budget is decided early on in Initiation when the Risk Management Strategy is prepared. For example, if a risk-related spend is above a certain threshold, the board members may decide that they want to be consulted before the money is committed, even if the Project Manager has identified and costed the risk as part of the risk analysis and planning.
Like the change budget, the risk budget is conditional. If a risk doesn’t happen, then the Project Manager has no access to the part of the risk budget set against that risk. She can’t use those funds for any other purpose, such as to offset over-runs on planned work or to pay for a change. In case you think that over-running on planned work is a risk and so is a neat way of tapping into the risk money, think again! Over-running is an impact, not a risk and Chapter 15 has more detail on this point if you need convincing.
Planning with Products
Now to the actual planning itself. Although PRINCE2 does expect the use of planning techniques that you’re probably familiar with – such as the Gantt chart with its horizontal bars representing the tasks or activities of the project, and possibly activity networks – the method doesn’t expect you to start there. Instead PRINCE2 expects that you’ll be using some techniques up front that require a totally different approach when thinking about the project; techniques associated with ‘product-based’ or ‘product-led’ planning.
![]() Products and outcomes. Project deliverables in PRINCE2 are known as products. But although the deliverables are usually physical products, occasionally a deliverable may be a soft product or ‘outcome’. This may be something like a changed customer perception of the company. You can’t hold or kick a changed perception.
Products and outcomes. Project deliverables in PRINCE2 are known as products. But although the deliverables are usually physical products, occasionally a deliverable may be a soft product or ‘outcome’. This may be something like a changed customer perception of the company. You can’t hold or kick a changed perception.
Looking at the planning problem
The traditional approach to planning that starts off with the familiar Gantt chart has a problem, which the following example illustrates. To draw a Gantt chart, you start off by listing the activities or tasks down the left side of the Gantt. Here’s a task you can put on the list for one of your projects: ‘Build the wall’.
First of all, do you agree that ‘Build the wall’ is an activity or a task? You do? Good, because it is. That’s step one. Step two is to draw a bar onto the Gantt chart to show how long this activity should take. So how long does it take to build a brick wall?
You may immediately start thinking of questions: ‘How long is it? Is it one or two bricks deep? How high is the wall, because we may need scaffolding?’ However step two isn’t to start an argument but rather to draw a bar on a Gantt chart; so please answer my question on how long it takes to build the wall.
Focusing first on what you must produce
If those sorts of questions did cross your mind, then great, because you already think in the ‘product-led’ way. First you define ‘wall’. When you are as clear as you can be about what you’re building, then you can much more easily come up with the activities you need to do to build that deliverable and more accurately predict how long the work will take. In other words, the focus first of all is on what you produce – the products – and not the activities that build the products.
![]() Products. Like a number of other approaches that use this ‘deliverables’ focus, the PRINCE2 name for ‘deliverables’ is products – what the project produces.
Products. Like a number of other approaches that use this ‘deliverables’ focus, the PRINCE2 name for ‘deliverables’ is products – what the project produces.
If you’re heavily into activity planning, you may argue that you already think about what you’re going to produce in order to come up with meaningful activities and timescales. If so, great. You’re already convinced of the value of the product-led approach and will feel at ease that it’s expected in PRINCE2. But you may find that this approach has considerably more power than you think, and not least for progress control.
So, thinking ‘product’ before ‘activity’ is actually rather logical. How can you come up with meaningful activities and sensible estimates to build a wall unless you know what ‘wall’ actually is in this case? In fact, many projects go wrong right at the beginning because people do indeed list activities and estimate durations (as instructed by books and computer scheduling software) before knowing what the project requires. In turn, that is often because project planners push for this information to get the plan done.
![]() Product-based planning. With this approach you identify and plan the deliverables or products first, then turn your attention to the activities you need to build those products. This is different to the more traditional activity-driven approach, which starts with identifying activities and drawing up activity networks and Gantt charts. You need activity planning and that’s a vital element, but the approach ‘front ends’ that work with powerful product planning, hence it is a product-led or product-based approach to planning.
Product-based planning. With this approach you identify and plan the deliverables or products first, then turn your attention to the activities you need to build those products. This is different to the more traditional activity-driven approach, which starts with identifying activities and drawing up activity networks and Gantt charts. You need activity planning and that’s a vital element, but the approach ‘front ends’ that work with powerful product planning, hence it is a product-led or product-based approach to planning.
![]() Thinking ‘product’ is not particularly natural, whereas thinking ‘activity’ is. When you understand products, the approach is pretty easy. Some people understand the concept immediately, whereas others struggle for a bit, and then get it. And often it’s the people with the most planning experience that find the idea tricky at first. Don’t worry; so did I, and then it clicked.
Thinking ‘product’ is not particularly natural, whereas thinking ‘activity’ is. When you understand products, the approach is pretty easy. Some people understand the concept immediately, whereas others struggle for a bit, and then get it. And often it’s the people with the most planning experience that find the idea tricky at first. Don’t worry; so did I, and then it clicked.
Identifying products in the project
The first step in product-based planning is to think what the products are. You can simply make a list (although see ‘Giving the product list some structure’, later in this chapter, for a technique that can help). In a Project Plan, you look for between 15 and 30 products to cover the whole of the project at a fairly consistent level of detail.
So what exactly is a product?
Put simply, a product is something that one of the project teams builds or produces. As an example, imagine that I carry out a review of a business area and look at what work it does. The business process is outdated and in need of overhaul and simplification – for example, many of the forms the business uses have sections that just aren’t relevant and people leave them blank. The review is to identify the problems and make improvements, and then launch a revised procedure with new form designs as needed.
So, what are the products? Remember that products are something that the team builds, so they’re things you can hold in your hand or, if they’re too big for that, things that you can kick. In this example the products are small:
Existing desk instructions (staff instructions on current procedures)
Diagram of the present procedures
New procedure definition
New form designs
New form supplies
New desk instructions
New business procedure – the new procedure up and running
Identifying ‘external products’
When I look at the list, I now realise that the supplies of the new forms don’t come from within the project but rather from a local print shop, which is, quite obviously, not one of my project teams. I supply the shop with the designs and it prints the forms and glues them to a card back to make pads. The shop’s work is not part of my project: The printer’s staff activities to do the work aren’t on my Gantt chart, and the shop doesn’t send me progress reports or time sheets. The forms are important to launch the new business procedure, but they come from outside the project boundary.
I also realise with a sudden flash of insight that the product ‘existing desk instructions’ must already exist. So although this is an important document in the project, the project team doesn’t have to create it. The ‘existing desk instructions’ product is therefore external as well – it comes over the project boundary from outside.
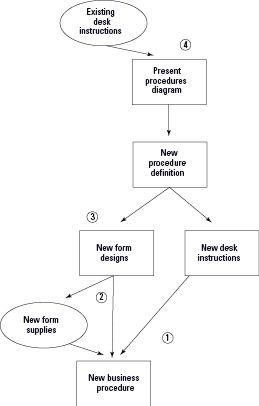
Using the Product Flow Diagram
The next step in product planning is to identify the sequence in which those products will be created, using a Product Flow Diagram (see Figure 14-1). The symbols in the diagram are simple: a rectangle for an ‘internal’ or team product, an ellipse for an ‘external’ product, and an arrow to show the dependencies or sequence. This diagram is really powerful and well worth the effort of drawing it.
Figure 14-1: First-cut Product Flow Diagram.
Performing the ‘bottom-up’ checks
The next step in product planning is to do the bottom-up checks. As the name suggests, you start at the bottom of the diagram and work back up to the top. This is a vital step but interestingly successive editions of the PRINCE2 manual have never mentioned it. You check the following:
Are you sure that each dependency arrow leading to the product being examined is correct? Are you sure that you can’t develop the lower product without having each of the higher products in place? If you find you don’t actually need one or more of the higher products, then remove the dependency lines to them.
For the product being examined, do you need any other product to be produced other than the ones with arrows leading to it? In other words, is anything missing? You may find a missing product or two, and you may find that a related product is on the diagram somewhere but without an arrow to the one you’re examining at the moment.
Going back to Figure 14-1, the bottom-up checks reveal four issues, which are at the numbered points on that diagram.
Starting at the bottom, the dependencies to the new forms and the new desk instructions seem fine, but when I ask whether I need anything else, I realise that I must have trained staff. The new business procedure isn’t ready to go unless the staff are clear on how to use it. In turn, I realise that I need a training outline to explain the changes and show staff the new forms. I don’t need the full supply of new forms, though. The designs are enough and I can print a few copies of those designs as part of the training outline and hand them round. So, I add in two missing products: training outline and trained staff.
Looking at the left side of the diagram at the bottom, I find a couple of issues. First, I decide that the dependency arrow is redundant between ‘New form designs’ and ‘New business procedure’. ‘New form supplies’ serves that dependency. But when I look at ‘New form supplies’, I realise that the shop needs an order from the team to specify the quantities and billing details. So, I identify another missing product – a small one perhaps, but important. Continuing with the bottom-up check, I identify two other missing products. One is the existing form designs on which to base the new ones, and at the top of the diagram I decide that there are bound to be some interview notes and these will record details of the problems and requirements which will be needed to come up with a workable new procedure.
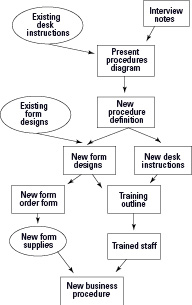
A revised diagram (Figure 14-2) shows the newly found products and adjusted dependencies. By the way, don’t worry if the diagram gets a bit messy and you need to re-draw it a few times. This is quite common, especially when you don’t know the project very well and lots of new information comes to light. Whiteboards are great for diagrams like this.
![]() If you don’t have an electronic whiteboard, take a digital photograph of your diagram at every version. Writing ‘Please don’t rub this off’ at the bottom of the whiteboard isn’t enough. That’s what the cleaners come to last, just after they’ve destroyed your work, starting at the top of the board. Years ago I was doing consultancy work with a major bank who had hired a hotel conference room for a couple of days . . . no, sorry, the memory is still too painful! But ever since I’ve always carried a camera with me.
If you don’t have an electronic whiteboard, take a digital photograph of your diagram at every version. Writing ‘Please don’t rub this off’ at the bottom of the whiteboard isn’t enough. That’s what the cleaners come to last, just after they’ve destroyed your work, starting at the top of the board. Years ago I was doing consultancy work with a major bank who had hired a hotel conference room for a couple of days . . . no, sorry, the memory is still too painful! But ever since I’ve always carried a camera with me.
Figure 14-2: Revised Product Flow Diagram.
![]() Specialist Products and Management Products. The method refers to two categories of product: specialist and management. The specialist products are basically the ones that the teams build (although a few specialist products may be external and come into the project from outside). The management products are the things being used for project management, including products such as the Risk Register, the Business Case, and the Project Initiation Document. You use the management products to manage the production of the specialist products. In the diagrams, you normally model the specialist products only.
Specialist Products and Management Products. The method refers to two categories of product: specialist and management. The specialist products are basically the ones that the teams build (although a few specialist products may be external and come into the project from outside). The management products are the things being used for project management, including products such as the Risk Register, the Business Case, and the Project Initiation Document. You use the management products to manage the production of the specialist products. In the diagrams, you normally model the specialist products only.
Products for quality and for progress milestones
Using a product-based approach to planning also opens the door to very specific quality control and also superb progress monitoring. Chapters 13 and 17 respectively give more detail.
Writing Product Descriptions
I worked for the UK government for some years, but I’m nearly better now; I just get the occasional nightmare. One thing that has stuck with me is a loathing of forms. However, I really like the Product Definition or, as PRINCE2 calls it, the Product Description. Every product on the Product Flow Diagram has one and the description really spells out what that product is.
![]() Some people think that writing Product Descriptions is just doing some form filling. This is both wrong and rather dangerous. Coming up with the Product Descriptions is primarily a thinking exercise that helps you understand the product and you put the results of that thinking on the form. If you resort to form filling, you focus on the paperwork, not on understanding the products.
Some people think that writing Product Descriptions is just doing some form filling. This is both wrong and rather dangerous. Coming up with the Product Descriptions is primarily a thinking exercise that helps you understand the product and you put the results of that thinking on the form. If you resort to form filling, you focus on the paperwork, not on understanding the products.
![]() I ran a planning workshop for nine people on an important industrial project. One Product Description form took the ten of us four hours to complete: that’s 40 staff hours to fill in one form. Did the group think that this technique was bureaucratic and wasteful by the end of that four hours? No, they were delighted. The product was absolutely critical in this high-risk, year-long project and nobody properly understood the product when we started. After four hours, which we mostly spent discussing and thinking, everyone understood the product and all were agreed on the description. For such an important product on a business-critical project, everyone thought the time was very well spent. In the same workshop, two people went off to produce a Product Description for a different product and came back ten minutes later with it finished. That product was much more straightforward.
I ran a planning workshop for nine people on an important industrial project. One Product Description form took the ten of us four hours to complete: that’s 40 staff hours to fill in one form. Did the group think that this technique was bureaucratic and wasteful by the end of that four hours? No, they were delighted. The product was absolutely critical in this high-risk, year-long project and nobody properly understood the product when we started. After four hours, which we mostly spent discussing and thinking, everyone understood the product and all were agreed on the description. For such an important product on a business-critical project, everyone thought the time was very well spent. In the same workshop, two people went off to produce a Product Description for a different product and came back ten minutes later with it finished. That product was much more straightforward.
The Product Description poses some really useful questions that help pin down exactly what the product is.
Identifier
Usually numeric, this can cross reference to symbols on the product diagrams.
Title
Easy enough, but the title needs a bit of thought. Remember three things about product titles:
Make sure that you pick a nice short title that you can use easily on the diagrams. Whatever you do, don’t resort to using numbers on product diagrams, which then means that you can’t read the diagrams without looking up a list all the time.
Make the title descriptive, so you can easily understand what the product is.
Use the language of the business area. If you change all the business area terminology to different terminology, the business staff can’t understand the diagrams and so can’t spot any mistakes.
Purpose
The purpose is simply asking why you want to build this product in this project. Often, that question is a no-brainer to the point that you wonder why the heading exists. But just sometimes you stop and realise that although you may normally do something on this project you don’t actually need to this time. If you don’t know why you need a product, find out or don’t build it.
Composition
Composition is the first of the more awkward headings. A better name would be ‘description’, because that’s what the composition mostly is. In this section you describe the product, but that may well include sub-products that comprise this one.
![]() Don’t confuse the Product Description with a specification, which is a separate document in its own right. Where you do have a more detailed specification, that becomes the product, and you then write a Product Description that explains exactly what the specification covers and how it will be presented.
Don’t confuse the Product Description with a specification, which is a separate document in its own right. Where you do have a more detailed specification, that becomes the product, and you then write a Product Description that explains exactly what the specification covers and how it will be presented.
Derivation
Derivation is a rather strange heading, but an easier way to think of it is as ‘dependencies’. What must be in place before you can build this product? Normally, you need to build other products immediately before this one (the products that the arrows come from on the Product Flow Diagram). However, it may just be that the product is ‘external’ and comes from a source outside the project, and if so you note it here.
![]() Don’t worry if the ‘internals’ and ‘externals’ aren’t quite clear for the products at first. You may intend to have a team build something (internal product), but then decide for speed to buy it in from outside the project (external product). So you simply change the symbol on the diagram and note the detail on the Product Description.
Don’t worry if the ‘internals’ and ‘externals’ aren’t quite clear for the products at first. You may intend to have a team build something (internal product), but then decide for speed to buy it in from outside the project (external product). So you simply change the symbol on the diagram and note the detail on the Product Description.
You may think that this section is rather unnecessary, but surprisingly it often catches any products you miss from the Product Flow bottom-up checks (see the earlier section ‘Performing the ‘bottom-up’ checks’). The dependency may also be on something other than a product, such as a confirmation from the finance director that the funds are in place so that you can proceed with the work of building this product.
Format and presentation
Many products don’t have requirements for format and presentation, so don’t hesitate to leave the section blank if need be. But reports, for example, may need to comply with a house style. Equally, in projects involving computer systems, data often has a required format, sometimes a very strict one.
Development skills required
This section is obviously useful for resource planning. In the early part of product planning though, and particularly before the product is clear, you may not be quite sure of skills yet, so you can leave the section blank until you know the detail.
Quality criteria
Set down what quality criteria the product must satisfy for it to be complete and then approved. You need to be able to measure quality criteria or you can’t determine whether the product meets them. Having said that, defining quality isn’t always so easy – Chapter 13 offers more detail.
Quality tolerance
Quality tolerance is a rather strange area added for the first time in the last edition of the PRINCE2 manual. A tolerance, by definition, has a plus and minus boundary to the stated measure. Many project products just aren’t like that, but one example is the speed of a new machine for the production line that’s being procured in the project. Producing a unit with the machine mustn’t take more than three seconds, but shouldn’t be faster than two seconds because this is unnecessarily expensive as well as disruptive to the rest of the production line. Most products in business projects don’t have a tolerance, so again just leave this section blank if it’s not relevant to the product.
Quality method
The quality method section specifies how you measure whether the product meets its criteria. How you do this depends on the nature of the product. Sometimes, you can measure with a ruler – the report must be on A4 paper, for example. Other times, the measure is a judgement – the managers agree that they can understand the report.
Quality skills required
You need to think carefully about skills for the quality checks. Introducing the word ‘skills’ into the heading is actually a bit dangerous though, because you may want to choose someone precisely because of her lack of skill. For example, if you have an instruction manual for a new computer system, the last person you want to check that manual is a team member who helped write the system and who already knows exactly how it works. Instead, you need someone who’s never seen the system before – you sit her down in front of a screen and keyboard with the manual and you say, ‘Please enter a new customer record.’ But for some technical products you may indeed want a highly skilled and professionally qualified person to conduct the tests.
Quality responsibilities
This refers to who is to produce, check and approve the product. The second two of these three can be the same person.
Defining the project
Now that you’ve looked at the product description as it applies to all products, or deliverables, in the project, it’s necessary to go back a bit to a product description that you do first of all, and which is slightly different. This is the product description for the final deliverable of the whole project; the Project Product Description.
The Project Product Description is produced during Start Up but can be amended during Initiation when the PID is written and things are being thought through in greater depth. You’ll see from the headings that some of the normal Product Description headings are omitted because they’re just not relevant when thinking about the project as a whole. Other headings have been adjusted slightly because this is the ‘whole project’ product. So, acceptance criteria are the criteria that the whole project must satisfy in order to be accepted.
Giving the product list some structure
For the Product Flow Diagram earlier in Figure 14-1, I started with a simple list of products. But my thoughts were a bit random in making the list. If you know the project area well, then you can use another diagram that allows you to think systematically through all the areas of the project to determine what products are in those areas or under those categories.
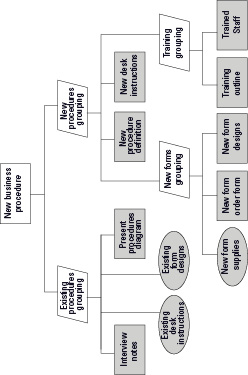
The Product Breakdown Structure or PBS is a simple hierarchy diagram with categories and sub-categories of products, and the products themselves are at the bottom level. This bottom level forms the list of products, from which you can then go on to develop a Product Flow Diagram.
Returning to the new business procedure project, used as an example earlier in the chapter, the PBS may look something like Figure 14-3.
On this diagram you can see the product list at the lowest level. The products are shaded to make them easy to see. The higher-level boxes are the category boxes that give the structure some . . . well, structure. To show that these are just categories or ‘groupings’, you have an option to make them a different shape. The very top box on the PBS represents the whole project and is the same box as the final box on the Product Flow Diagram. This is the Project Product, subject to the Project Product Description mentioned earlier in the chapter. When the final product on the Product Flow Diagram is complete, that’s the whole project done.
Structuring the structure
No rules exist for determining the categories in the structure of a PBS. You use the categories and structure that help you to think the project through systematically. Another project planner may break the project down differently and that’s fine, but you both come up with the same bottom line, albeit in a different order.
![]() If we both build a house, you may have main categories of brickwork, woodwork, and electrics. I may have grouped my products by anticipated resources: the things I plan to build personally, the things that supplier A will do for me, and the things that supplier B will do for me. We both end up with light switches on the bottom line somewhere. I have them under a sub-category of ‘fittings’ under the resources block, which covers the work I intend to do myself. You have them under a sub-category of ‘lighting products’ under the ‘electrics’ main block. But we both have light fittings on our diagrams and in both cases we take that product forward to the Product Flow Diagram.
If we both build a house, you may have main categories of brickwork, woodwork, and electrics. I may have grouped my products by anticipated resources: the things I plan to build personally, the things that supplier A will do for me, and the things that supplier B will do for me. We both end up with light switches on the bottom line somewhere. I have them under a sub-category of ‘fittings’ under the resources block, which covers the work I intend to do myself. You have them under a sub-category of ‘lighting products’ under the ‘electrics’ main block. But we both have light fittings on our diagrams and in both cases we take that product forward to the Product Flow Diagram.
![]() In very large projects, you can have PBS blocks to reflect the groups of products making up the different contracts to be let.
In very large projects, you can have PBS blocks to reflect the groups of products making up the different contracts to be let.
Figure 14-3: The Product Breakdown Structure.
In terms of the depth of the structure, you want this to be fairly evenly balanced; in other words, going to about the same level of detail throughout. You want 15 to 30 products across the plan and about the same level of detail of product. On the house project, for example, having ‘roof’ as a bottom-level product in one part of the diagram and ‘top screw of left side of bottom hinge on kitchen door’ in another would make for a bad PBS.
Planning when you don’t know the project area
If you don’t know the project area well, the PBS diagram often can’t help you because you don’t know what that structure is in order to be able to think systematically through it. A feature of the PBS is that it works from the top down. If you don’t know what the top level is, then you have a problem. In that case, simply leave out the PBS and go straight to Product Flow. But if you do have some knowledge of the area, the PBS can be a real help, both in making sure that you think the product right through and in speeding you up – sometimes quite dramatically.
![]() In one project I was giving consultancy help to a client for Start Up and Project Initiation. I didn’t understand this new business project as I was new to the project, and neither did the client, which was partly why I was asked to provide consultancy. A PBS wasn’t going to help because nobody knew what the top-level categories of this project were. Nor was the scope clear. I suggested using a Product Flow Diagram first and, unusually, we did this in Start Up rather than Initiation. Because the Product Flow Diagram is a network diagram, we could start anywhere. I was working alongside the Project Manager and together we drew the bits we knew about and went and talked to a lot of people, and over three or four days the whole Product Flow came together, which also neatly defined the scope for the Project Brief. We never did draw a PBS for that project.
In one project I was giving consultancy help to a client for Start Up and Project Initiation. I didn’t understand this new business project as I was new to the project, and neither did the client, which was partly why I was asked to provide consultancy. A PBS wasn’t going to help because nobody knew what the top-level categories of this project were. Nor was the scope clear. I suggested using a Product Flow Diagram first and, unusually, we did this in Start Up rather than Initiation. Because the Product Flow Diagram is a network diagram, we could start anywhere. I was working alongside the Project Manager and together we drew the bits we knew about and went and talked to a lot of people, and over three or four days the whole Product Flow came together, which also neatly defined the scope for the Project Brief. We never did draw a PBS for that project.
Getting to the Product Flow Diagram from the PBS
Moving on to a Product Flow Diagram is very easy if you keep in mind that the bottom level, or ‘leaves of the upside-down tree’, form the list of products. You use exactly the same boxes on the Product Flow Diagram, only this time you put them in the sequence in which you plan to produce them, and the final product on the flow is the same as the top box on the PBS.
Making one exception to the rule – integration products
Just occasionally you may have a product that’s made up of other products. For example, for the product ‘engine’, the lower-level products may include ‘radiator’, ‘big end’, ‘butterfly spring’, and ‘battery’. You can see immediately that ‘engine’ is not a category. If you take the big end, the butterfly spring, and the other bits and pile them up on the floor, you don’t have an engine. An engine is a product in its own right, not a category or grouping, so here you have an option of modelling a higher-level rectangle on the PBS, and the lower-level rectangles underneath it are the components that go to make up the engine. A product that is made up of other products like this is known as an Integration Product. In this case, you take the higher-level Integration Product box forward to the Product Flow Diagram as well, and so break the ‘bottom level only’ rule. In other words, all rectangles and ellipses form the list of products and you take all of them forward to the Product Flow Diagram.
Moving On to Activity Planning
Activity planning is quick to explain, but takes some time to do. You look at each product and decide what activities you need to build it. Here, you consult different people such as suppliers, team specialists, and Team Managers. But it is much easier for them in PRINCE2 because you have the Product Descriptions that say both what the product is, and how it will be tested.
You can easily be too simplistic about activity planning and say that if you identify the products, you already have the activities – so for the product ‘machine’, the activity is simply ‘build the machine’. In turn, that leads people to draw the wrong conclusion that product planning is basically the same as activity planning. But it is often more complicated than one activity for each product anyway. Even if the machine is a very simple one, you may still have two activities of ‘build it’ and ‘test it’, each using very different resources.
For the specialist products you can write the activities against each box on the Product Flow Diagram, or you can just list them down the left side of a Gantt chart. Although the computerised scheduling or ‘project management’ software doesn’t usually cover product planning, it allows you to specify milestones as headings and then group tasks under them as follows:
New form designs
Identify usable content from old forms
Design new forms
Check new design with business users
New forms order form
Establish quantities with business area
Complete and send the order form
![]() You have two things to remember here. First, don’t forget the management products such as Stage Plans. The diagrams show the specialist products so you can work systematically through those, but allow for the management products too. Second, don’t forget that external products may have a time duration. If you send a ‘windows specification’ (internal product) to a window manufacturer who then sends you the ‘windows’ (external product) for your team to produce the ‘installed windows’ (internal product), don’t imagine that the manufacturer can produce the windows in zero time.
You have two things to remember here. First, don’t forget the management products such as Stage Plans. The diagrams show the specialist products so you can work systematically through those, but allow for the management products too. Second, don’t forget that external products may have a time duration. If you send a ‘windows specification’ (internal product) to a window manufacturer who then sends you the ‘windows’ (external product) for your team to produce the ‘installed windows’ (internal product), don’t imagine that the manufacturer can produce the windows in zero time.
Estimating – the Easy Bit
Yes, the heading is meant to be a joke. Estimating is one of the hardest bits of project planning but PRINCE2 only mentions it in passing by listing a few techniques. Project techniques toolbox publications, such as the Inspirandum Project Techniques Toolbox, explain some techniques. But don’t go looking for magic formulas that give you perfect estimates every time because you’re doomed to disappointment; they don’t exist and estimating is a tricky business.
Estimating can be sub-divided into two basic approaches: top-down estimating, which you do across the whole project, and the more detailed bottom-up approach, when you have the detailed activities in stage planning and can estimate them and add them together to get a total.
Some techniques rely on you knowing how long things have taken before; what’s normal in your organisation. If your project staff have lots of support work to do alongside their project work, don’t expect them to be as productive as staff who can concentrate just on project work. This variation in the working environment is one reason why you can’t have an easy estimating formula.
![]() Imagine that I ask you to paint a wall for me, and I tell you the size of the wall and that I’ve already prepared it for painting. What’s the most valuable bit of information you need to answer the question of how long the painting takes you? That information is how long it took you last time you painted a wall. Now, perhaps this wall is only half the size of the one you did before, but you can take that into account when calculating the time you need.
Imagine that I ask you to paint a wall for me, and I tell you the size of the wall and that I’ve already prepared it for painting. What’s the most valuable bit of information you need to answer the question of how long the painting takes you? That information is how long it took you last time you painted a wall. Now, perhaps this wall is only half the size of the one you did before, but you can take that into account when calculating the time you need.
Most organisations are really bad at storing historic information. If it exists at all, the information is in the depths of old Project Plans where finding it is really difficult, even if you can remember which projects involved this sort of work anyway.
![]() The construction industry is much more mature than most when it comes to estimating costs. In the UK, The Architects’ and Builders’ Price Book holds statistics on how much the various bits of building work cost, and Spon publishes this every year. So, for each element of building you can just look up the detail and find out materials costs and labour costs for the stated unit, such as per square metre. This is how builders can give you a reply so quickly when you ask for an estimate for a job on your home. They just look up the different elements, multiply them by the number of units, and then tell you the total. Even that doesn’t help with getting accurate time estimates though, as most people who’ve had building work done in the UK can tell you . . . between heart-wrenching sobs and with their head in their hands.
The construction industry is much more mature than most when it comes to estimating costs. In the UK, The Architects’ and Builders’ Price Book holds statistics on how much the various bits of building work cost, and Spon publishes this every year. So, for each element of building you can just look up the detail and find out materials costs and labour costs for the stated unit, such as per square metre. This is how builders can give you a reply so quickly when you ask for an estimate for a job on your home. They just look up the different elements, multiply them by the number of units, and then tell you the total. Even that doesn’t help with getting accurate time estimates though, as most people who’ve had building work done in the UK can tell you . . . between heart-wrenching sobs and with their head in their hands.
Scheduling and Resourcing
The work of scheduling and resourcing is very integrated with estimating and you move backwards and forwards between these jobs.
You estimate the amount of time you need to do an activity, but then the estimate depends on what resources are available. And making a decision isn’t as simple as dividing the work hours by the number of people either. If you have a 500-hour job and one person available, how long does the job take? Perhaps 500 working hours. If you have a 500-hour job and five staff, how long does it take? Well, certainly not 100 hours. It may be considerably more because of arguments about it (with five people you can probably reckon on at least six opinions) and the fact that Joe makes the tea while Mary produces the team news sheet. What if you have two people? Again, the work may not take 250 hours because they work so well together that synergy sets in, so they may do the job in just 200 hours. Then, what about the level of experience? In most cases, trainees work more slowly than very experienced staff and make more mistakes, which adds time while the errors are corrected. So, estimating, resourcing, and scheduling are very much bound together.
You can use different techniques for scheduling, but most project planners use activity networks and Gantt charts. Actually, most people just use Gantt charts because they don’t really understand activity networks. But you can use a timeline if you prefer.
Activity networking and precedence networks
This book focuses on PRINCE2 and can’t go into the detail of precedence networks and Gantt charts, but do consult Project Management For Dummies by Stanley E. Portney (Wiley) for more information. Having said that, this section covers the basic concepts to help you draw up a simple network and Gantt chart if you’re not already familiar with the techniques.
Activities have dependencies, just like products. You can’t test the new machine until you build it. Although Gantt charts are really great (see the next section ‘Activities with Gantt charts’), they don’t show dependencies very well. Most computer tools display arrows on the Gantt chart to try to show dependencies, but the arrows just make the chart really confusing. The first thing I do when loading a new version of any scheduling software is to find the option where you turn the arrows off. A different diagram is much more powerful and suited to the job – the activity network. There are two basic sorts of activity network but the most used one is the precedence network. The precedence network is much more straightforward than the alternative and all the popular software tools use it.
The good news is that constructing a precedence network is dead easy, contrary to the common perception. Figure 14-4 shows some activities from the example of the new business procedure project set down in the precedence network. The diagram simply shows in what order you can do the activities. You can see that you can do some activities at the same time, and the dependencies show that as well.
The precedence network can show timings and this is where the power of the technique starts to emerge. Products don’t have a time as such, but rather the activities to build that product take time. In putting the times onto the network, you can work out the total time the project requires. Figure 14-4 shows only part of the project, but it illustrates how the technique works.
You can see that the pathway through the bottom of the diagram is longer than the pathway across the top; six days and one day respectively. You don’t have to be too much of a mathematician to calculate that the part of the project covered by the diagram takes 17 days in total, leaving a bit of spare time across the top path; in fact, five days of spare time.
Figure 14-4: The precedence network for part of the project.
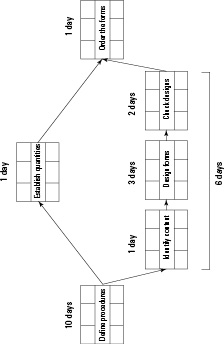
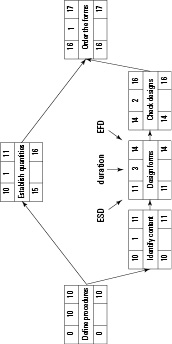
In the top set of boxes, you can put the estimated duration in the middle, then the earliest start data (ESD) in the left box, and the earliest finish date (EFD) in the right one. This example uses day numbers (day 1, day 2 and so on) but if you use computer software it works with calendar dates. The earliest finish date is simply the earliest start date for the activity, plus the duration.
You can now see those figures entered on the top line of each box (Figure 14-5). The earliest start of an activity is the same as the earliest finish of the previous one because it follows it immediately. Where two lines feed in, as in the box on the extreme right, you use the highest figure as the ESD, which in this case is 16 from ‘Check designs’.
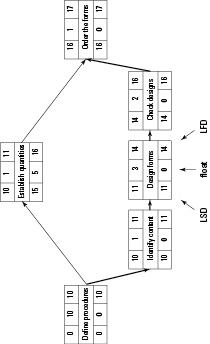
Now, using the bottom set of figures, the return journey from right to left, you can calculate the amount of free time, or float, on each activity. The first step is to copy down the ESD from the top right box to the bottom right box on the very last activity. In this case, that figure is 17. That figure becomes the latest finish date (LFD) by which you must complete the activity. Now, to fill in the bottom left box, you need to determine the very latest time that activity can start without going beyond the LFD. In this activity example, the latest finish is the end of day 17 and the activity is one day long. Therefore, if you start it any later than day 16 then the activity is going to be late finishing. You calculate LFD minus duration to give the latest start date (LSD).
You copy back the LSD of the activity you’ve just calculated to become the LFD of all preceding activities directly connected by an arrow. In Figure 14-5, you see that there are two activities that come directly before the final activity ‘Order the forms’ and both of these carry 16 as their LFDs. Where an activity has more than one line feeding back into it, as into the first activity on the example, you take the lowest of the LSDs feeding in. In this case that’s 10.
Figure 14-5: Latest timings on the precedence network.
You calculate the amount of float on each activity by comparing the end pair of figures in each activity box, the EFD (top right), and the LFD (bottom right). You put the amount of float in the bottom middle box.
Now you can show the longest path by following the line of zero floats (see Figure 14-6). This longest path determines the length of the project and is known as the critical path. If any activity along this line gets delayed, it lengthens the longest path and the project end date slips. When you look at the top line of the diagram, you can now see that the float for ‘Establish quantities’ shows five days: The lower path is five days longer than the top one and so the lower path determines the length of the project.
Figure 14-6: Zero float and the critical path.
Activities with Gantt charts
The Gantt chart is probably more familiar territory (Figure 14-7). After you get the precedence network together, constructing a Gantt chart is very easy. If you draw the Gantt chart by hand (unlikely), the bar for each activity is fixed from just three of the figures from the same activity on the precedence network – top left, top right, bottom right; or, to use the professional expression, earliest start date (ESD), earliest finish date (EFD), and latest finish date (LFD). Remember, if you work with day or week numbers rather than calendar dates, the figures refer to ‘end of day’ or ‘end of week’. Figure 14-7 shows part of the Gantt chart built from the Precedence Network data.
Figure 14-7: The Gantt chart for part of the project.
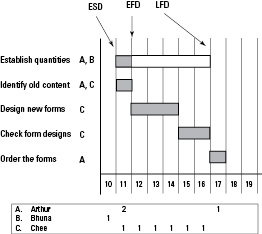
Activities and resource levelling
The last bit of activity planning checks for resource conflict. The Gantt chart in Figure 14-7 shows a resource conflict, because Arthur is scheduled to work full-time on two activities at once. The grid along the bottom showing the resources shows this. You need to resolve the problem and ‘smooth’ or ‘level’ the resources to get the required resources down below the level of available resources. Smoothing or levelling involves three basic steps:
1. If an activity is not on the Critical Path, delay its start until a time when the person is available. You can slide activities along within the person’s free time or float.
2. If you still have a problem, see if you can get more resources, if that helps. The Project Board may be able to give you more people with the same skill set. This lifts the level of available resources and so may resolve the problem.
3. If you do steps 1 and 2 but you still have a problem, then the project end date moves. In the example in Figure 14-7, Arthur has to do one activity and then the other one a week later, which takes the duration out to 18 days for this part of the project.
![]() Resource levelling can be hard work, and all the more so where you need to level resources between projects as well as within your own. But don’t give up. A plan with resource conflicts just doesn’t work and you hit the problems in the project only, rather than in the planning.
Resource levelling can be hard work, and all the more so where you need to level resources between projects as well as within your own. But don’t give up. A plan with resource conflicts just doesn’t work and you hit the problems in the project only, rather than in the planning.
Checking Risk
You should be checking for new project risk – risks that come from within the project itself rather than from the outside – right through the planning work. However, if while checking project risk you notice an external or business risk, you deal with that as well.
Project risk may include things like multiple points in the project where you need advice on legal matters, and that advice may take time to arrive and so delay the project. After the resource planning you may notice that nearly all the project staff are available for part of their working week only, because they’re working on other projects at the same time. That situation is likely to slow the staff down because they have to stop and start all the time. Plus, if one of the other projects comes under pressure and has a higher organisational priority, staff’s time on your project may get cut even further.
As with all risk analysis, you record risks that’ll be formally managed in the Risk Register, and you build actions into the plan. You’re very likely to update the plan then, and any contingency time you require alters the timing of the project activities and perhaps the overall timescale of the project.
For much more on risk analysis and management, including the use of the Risk Register in PRINCE2, please see Chapter 15.
Explaining the Plan
The last thing to do with the plan, at whichever level of detail you’re working, is add textual explanation and also any other elements you require that the products and the activities don’t cover. The most important of these other elements is a finance plan.
Adding explanations for those who read the plan
Sometimes the Project Plan can look a bit strange unless you know why it’s been set up like that. The text of the plan explains anything unusual. In the case of the Project Plan, a number of people are likely to need to look at it, but notably this includes Project Board members, who must sign off the plan and need to understand why it’s been set up the way it has.
Risk contingency (time): A fallback action allowing for delay where this is likely.
Waiting for an external supply: You ordered something and the gap allows time for a supplier who’s completely outside the project to build the item.
Waiting for staff to come from another project: You know that the designers aren’t available until week 32.
You may need to comment on other things as well though, such as your level of confidence in the estimates that underpin the activity plans. If experienced people helped with the estimating of a fairly standard project, then you may be, say, 90 per cent confident that the estimates are correct and that the project will run closely to the plan. However, if this is a novel project and nobody has much relevant experience, you may be only 20 per cent confident that the estimates are correct. This second case gives early warning to the board and any others that the project may fluctuate significantly either side of the estimates.
Financial planning
Strangely, PRINCE2 says virtually nothing about financial planning within the project. As financial planning is an important part of project planning and control (the territory of PRINCE2), this remains a big gap in the method.
You need to draw up a budget for the project and then monitor project spending and compare it with that budget. As with all planning in PRINCE2, your financial planning goes into more detail at stage and team levels. You can have a high-level project budget, and then a more detailed stage budget, and beyond that team budgets for each unit of work. You do most monitoring at stage budget level, but you must also maintain the project budget. For example, information may come to light in stage 4 that affects the level of spending in stage 6 and consequently the costs of the whole project.
Most people use a spreadsheet for the budget. This allows you to show the costed elements of the plan, the actual costs you have so far, and the variance between planned and actual costs incurred. A spreadsheet also allows ‘what if’ projections on costs.
![]() If early-stage activities are more expensive than you expected, part of the project control is to investigate why. If you now think that you underestimated the project across the board, you can do a ‘what if’ projection on the spreadsheet to increase costs of all activities and so help evaluate the impact on the whole project.
If early-stage activities are more expensive than you expected, part of the project control is to investigate why. If you now think that you underestimated the project across the board, you can do a ‘what if’ projection on the spreadsheet to increase costs of all activities and so help evaluate the impact on the whole project.
Planning at Three Levels
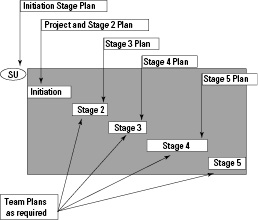
The approach to planning covered in this chapter applies to all the levels of planning in the project. You plan at three levels, and use the same techniques for all three, as shown in Figure 14-8.
Figure 14-8: Planning techniques at the three levels of planning.
The Project Plan
You develop the Project Plan in the Initation Stage and it forms part of the Project Initiation Document or PID (for more on Initiation and the PID, please see Chapter 5). The Project Plan covers the period from the end of the Initiation Stage to the planned end of the project, and shows all the delivery stages of the project. You maintain the Project Plan throughout the project and update it at least at every stage end. In reality, updating is usually continuous, at least for activities, because in computer scheduling tools the Project Plan and then successive Stage Plans are all within a single file.
The Project Manager is responsible for producing the Project Plan, but she discusses it carefully with other people – including Project Board members, team specialists, and key suppliers – to get it accurate.
The Project Plan also involves Project Assurance, the audit function of the project to check that it’s correct. For example, Project Assurance can check whether you mistakenly planned any activities over public holiday periods, and whether the total amount of user resources stays within the limits set down by the Senior User(s) on the Project Board.
The Stage Plan
A Stage Plan covers just one management stage and you draw it up just before that management stage begins. After Project Initiation, you keep the Project Plan up to date from the latest information in the Stage Plans.
The Project Manager is responsible for Stage Plans, but takes advice from others, particularly from Team Managers.
Team Plans
Team Plans are optional. In smaller projects especially, the Stage Plans often incorporate sufficient detail to control the team work assignments, or Work Packages, as PRINCE2 calls them. Where the Stage Plan doesn’t have sufficient detail (notably where a Work Package is particularly complex), the Team Manager may decide that she needs a more detailed plan to control that work and so develops a Team Plan for that Work Package.
![]() Where a project is particularly supplier intensive, the Project Manager may ask the Team Managers to produce a Team Plan for each of the Work Packages they’re involved with, and then work with the Team Managers to create a Stage Plan from the Team Plans, as shown in Figure 14-9.
Where a project is particularly supplier intensive, the Project Manager may ask the Team Managers to produce a Team Plan for each of the Work Packages they’re involved with, and then work with the Team Managers to create a Stage Plan from the Team Plans, as shown in Figure 14-9.
Figure 14-9: Planning points in a PRINCE2 project.