
Chapter 15
Managing Project Risk
In This Chapter
Defining risk
Deciding how to handle risk in the project
Identifying individual risks
Assessing the risks and thinking about how to handle them
Planning and implementing your risk actions
Using the Risk Register and Daily Log
Many projects neglect risk management, and that’s a common cause of project failure. This is a sad state of affairs, because risk management isn’t difficult to do, it’s often not that time-consuming, and it’s actually rather interesting.
At its very simplest, risk management is just asking ‘What can go wrong with this project?’ and then doing some simple management stuff to prevent that happening or at least to control it. Some argue that risk management is all negative and unnecessary. They say you’re just looking for trouble and wasting time looking at things that mostly never happen. In fact, as you’ll probably agree immediately as a wise user of PRINCE2, risk management is very positive. You do it to protect the project and to prevent or control things that otherwise may cause problems to the point of complete project failure. Actually PRINCE2 also covers ‘good’ risk and the work to try and increase the chances of something advantageous happening in the project.
In this chapter is good news and bad news. One bit of good news to mention at the outset is that overall PRINCE2 is quite good with its risk management. The method has limits in what it covers though, and you may well want to go further if you’re involved in a high-risk project. But more good news is that it’s easy to add in additional risk techniques and controls. The bad news is that the 2009 edition of PRINCE2 has made the area of risk management more complicated – so really you should have learned PRINCE2 earlier and bought the previous edition of this book! This complexity is because the method has abandoned some of its project-oriented roots in favour of alignment with another UK government approach that covers all organisational risk, not just project risk. But in this chapter I give you useful information including, in a couple of places, harking back to the ‘good old days’.
Starting with the Basics: What Is Risk?
A dictionary definition of risk is ‘the adverse consequences of future events’. In other words, risk is future trouble. That’s what risk management in projects is mostly about: seeing what trouble may come and taking action now to control it and in some cases even prevent it. However, although that trouble-focused view used to be the PRINCE2 definition, the method now defines risk as ‘an uncertain event or set of events that, should it occur, will have an effect on the achievement of objectives’. This reflects the UK government’s risk-management method M_o_R® (Management of Risk). Although this definition is a bit of a mouthful, it reflects the point that a risk can be a positive thing – the risk of something good happening as well as the risk of something bad happening.
![]() An example that the chief examiner of the M_o_R® method has used to explain this is the stock market. If you buy shares you take a risk, but the shares may go up in value as well as down. The risk is positive as well as negative. That’s a neat example.
An example that the chief examiner of the M_o_R® method has used to explain this is the stock market. If you buy shares you take a risk, but the shares may go up in value as well as down. The risk is positive as well as negative. That’s a neat example.
You still need to remember the dictionary definition, though, because although a particular risk may indeed have a positive outcome, the emphasis in projects is still primarily on what can go wrong and how you can contain that.
Risk management has been around for a long time and a lot of modern thinking on risk is based on an explosive time for the development of risk management in the early 1600s – no, that’s not a typo. Like many other risk approaches, PRINCE2 uses two elements of risk measurement suggested in a paper produced in a monastery outside Paris back at that time: impact and probability. Don’t you feel good knowing that you work with something that’s so bang up to date? If you want to know a bit more about the development of risk thinking, a fascinating and very readable book is Against the Gods: The Remarkable Story of Risk by Peter L. Bernstein and published by John Wiley.
Deciding your strategy for handling risk
Before getting in too deep with the handling of individual risks, you need to think through your overall approach, or strategy, for handling risk in the project. That strategy is going to vary from project to project, so your approach on a small, low-impact, low-risk project is going to be rather different from that on a huge, high-risk and business-critical project.
To record your risk approach on this particular project, PRINCE2 includes the Risk Management Strategy which you develop in the Initiation or planning stage of the project and which then gets put into the Project Initiation Document. As with quite a few of the PRINCE2 management products, it can look a bit daunting at first sight, but as always, adjust it to keep it as simple as possible in line with the control needs of your project.
Understanding the sections of the strategy
Introduction
The purpose, objectives, scope and responsibilities for risk management in the project. Apart from responsibilities, the areas here are often fairly self-evident and you may find you need to put little in this part. But the section will be more important if your project is part of a programme of projects because you’ll almost certainly need to spell out the scope clearly to show what project risk management covers and what will be addressed by risk management activity at the higher, programme management, level. The same applies if you work in a place where a formal risk management approach has been adopted across the whole organisation.
![]() Don’t ever struggle to ‘pad out’ a section of the Risk Management Strategy, or any other PRINCE2 management product for that matter, to make it look a respectable size. If there’s little to say, then say little.
Don’t ever struggle to ‘pad out’ a section of the Risk Management Strategy, or any other PRINCE2 management product for that matter, to make it look a respectable size. If there’s little to say, then say little.
Risk management procedure
Any procedures you use for managing risk in the project are recorded in this section, such as how people should report new risks. The areas to cover relate to the risk management procedure diagram that comes later in this chapter. Where the project is using existing organisational standards you can just reference them; you needn’t write out or copy in information that’s recorded in other places, provided that those places are readily accessible.
Tools and techniques
There may be particular techniques that you intend to use in the different parts of risk management, such as the Ishikawa diagram – explained later in this chapter – to help identify risks. But tools may include computerised risk management tools or risk analysis questionnaires.
Records
This sets down how risks will be recorded. You normally use the Risk Register for risks to be formally managed, and the Daily Log for those to be informally managed. The manual also suggests that you define the Risk Register in this section, showing what headings are to be included. Personally I think this is a bit over-the-top in most cases as it’s rather clear from the Risk Register itself what headings are included! In a very formal and high-risk environment, there may be some discussion on this and the strategy may need to be agreed before the Risk Register is set up, and in that case it may be fair enough to spell out the contents in this Records section. But you can get the wrong idea that PRINCE2 is huge if you just read the manual as you’re likely to draw the natural but incorrect conclusion that this detail is the norm.
Reporting
The Communication Management Strategy overlaps a bit here. For more on the Comms Strategy, have a look at Chapter 5. Arguably it’s better to have all the reporting set down in one place, that is, the Comms Strategy rather than split the reports across the different strategies. However risk reporting does need to be specified somewhere. You need to think through and get agreement on risk reporting requirements.
![]() Part of your risk reporting might be the regular circulation of the p-i grid (probability–impact) described later in this chapter. The grid can be really helpful because it provides a visual representation of where risks are, and it can also be used to show changes since the last reporting point. You can read how you do this later in the chapter.
Part of your risk reporting might be the regular circulation of the p-i grid (probability–impact) described later in this chapter. The grid can be really helpful because it provides a visual representation of where risks are, and it can also be used to show changes since the last reporting point. You can read how you do this later in the chapter.
Timing of risk management activities
This is a sensible section, but the manual is rather limited in its explanation of the heading. It talks about risk management activity at an End Stage Assessment (the Project Board’s review of the project at the end of each management stage). Now while the board must check over the risk position at an ESA, the members are hardly likely to be getting up to that much risk management activity in just one part of a 40-minute meeting! What is much more significant on timing is how often risk will be reviewed during stages. For example, in a higher-risk project, it may be that the Project Manager should go through a formal review of all risk every two weeks and do that together with the risk specialist who’s been appointed to the project. This sort of work is included in the activity ‘Review the Stage Status’ in the process ‘Controlling a Stage’ which is covered in Chapter 7.
Roles and responsibilities
This refers to who is to do the various bits of risk management. The previous comment on timing gives an example. Risk will be regularly reviewed by the Project Manager and the appointed risk management specialist on this high-risk project.
![]() You can get a dangerous side-effect when you state who’s responsible for a particular risk – the same danger exists in organisational risk management. The problem is that when you set down who’s responsible, everyone else thinks that they’re not responsible. You can put a ‘catch all’ in the roles section to say everyone has a responsibility to report risk, but you almost certainly need to vocalise this in any project staff briefing as well.
You can get a dangerous side-effect when you state who’s responsible for a particular risk – the same danger exists in organisational risk management. The problem is that when you set down who’s responsible, everyone else thinks that they’re not responsible. You can put a ‘catch all’ in the roles section to say everyone has a responsibility to report risk, but you almost certainly need to vocalise this in any project staff briefing as well.
![]() Following on from the last Tip, if some junior team member does report a risk, be careful how you react. If the warning is silly, but actually the team member did it in good faith – for example, he didn’t realise it had already been discussed and discounted – nevertheless thank him for being vigilant. If you jump on someone for being stupid, what will he do when he spots a new and major risk in a few weeks’ time that nobody else has seen? Report it perhaps? No way – he’ll put his head down and keep quiet. And probably not to get his own back either but rather to be quite sure he doesn’t get shown up again.
Following on from the last Tip, if some junior team member does report a risk, be careful how you react. If the warning is silly, but actually the team member did it in good faith – for example, he didn’t realise it had already been discussed and discounted – nevertheless thank him for being vigilant. If you jump on someone for being stupid, what will he do when he spots a new and major risk in a few weeks’ time that nobody else has seen? Report it perhaps? No way – he’ll put his head down and keep quiet. And probably not to get his own back either but rather to be quite sure he doesn’t get shown up again.
Scales
Have a look at the section on the p-i grid later in this chapter for more on this. But for now, just take on board that different projects have different scales for things like impact. A £10,000-risk impact is usually going to be very much less significant on a project with a £2 million budget than one with an £11,000 budget.
Proximity
Proximity is how soon a risk can happen. You can read more about this in the ‘assessing’ section later in the chapter.
Risk categories
Categories can be useful to indicate who should have responsibility for different risks and who else may need to be informed of them. Have a look at the suggested set later in this chapter.
Risk response categories
The nine suggested PRINCE2 response categories again are listed in a panel later in this chapter, but the good news is that you’ll find an alternative and shorter set provided too. Under this heading in the strategy, you put down what categories you’re going to use in the project. As always, be careful to take note of any organisational standards.
Early warning indicators
I’d like to be able to offer you a clear explanation here, but I can’t. There is a rather enigmatic explanation in the PRINCE2 manual that talks about tracking to determine if pre-defined levels have been reached. The problem is rooted in the fact that early warning indicators are normally related to individual specific risks, not to all risk. Therefore it makes more sense to put most of the information on early warning indicators against particular risks in the Risk Register rather than in the strategy. There are instances where you may want to have a project-wide indicator and one is to spot the cumulative build-up of risk in the project. For example, if all 100 risks were rated ‘low’ probability but they all moved up to ‘medium’ probability then looking at just one of those risks may not set off alarm bells. But the fact that all 100 have been upgraded raises a concern because the cumulative risk of the project has increased significantly.
Risk tolerance
A tolerance is a statement of authority limits, plus and minus. It fits particularly well with probability and impact and the p-i grid covered later in the chapter. If a particular threat becomes more dangerous and enters the high score zone on the grid, the fact must be reported immediately. Or, on the minus side, if it’s found to be less dangerous and drops out of that zone, the fact must also be reported immediately. But some types of risk may need to be reported straight away if they start to materialise and there’s no flexibility at all. You set down these factors in this Risk Tolerance section.
Risk budget
Decisions need to be made on whether to have a separate budget, and if so how it’s to be handled. The next section of this chapter examines the options.
Managing the Risk Budget
You can adopt one of two basic stances on the risk budget:
1. Don’t have one. Just roll any risk-related budget into the project and stage budgets.
2. Have a risk budget where risk-related funds are kept separate from the main budget for the planned work.
Where the Project Manager is very experienced and has a lot of delegated authority for the project, it may be appropriate to just let him manage the risk with its associated costs, just as he manages the rest of the work. Indeed, a Project Board may want this to be the case and not be involved with the detail of authorising specific risk amounts. They just authorise a total and the Project Manager gets on with bringing the project in within this total.
Usually though, separate risk budgeting is advantageous so everyone can see what money is set aside for risk and the amounts against specific risks can be pre-authorised by the Project Board. If the risk happens, the Project Manager already has the authority to spend the funds to deal with it and the board knows what it has signed up to.
![]() If another project is delayed it creates the risk that staff won’t be released in time for our project. A fallback is that if this happens, we hire in some additional staff, and this response is costed and approved. If, later in the project, it’s found that the other project is indeed delayed and staff won’t be released, then the risk has been realised and the Project Manager can hire in some extra help using the risk funds. There’s no need to go back to the Project Board because the board has already agreed this action and has already approved the funds.
If another project is delayed it creates the risk that staff won’t be released in time for our project. A fallback is that if this happens, we hire in some additional staff, and this response is costed and approved. If, later in the project, it’s found that the other project is indeed delayed and staff won’t be released, then the risk has been realised and the Project Manager can hire in some extra help using the risk funds. There’s no need to go back to the Project Board because the board has already agreed this action and has already approved the funds.
Just in passing, and because I can’t resist it, critics of PRINCE2 say the method is procedure-bound and causes delay to projects with documentation and over-management. But you can see from this example of the risk budget how the Project Manager can react extremely quickly to a risk happening. He doesn’t then need to involve the Project Board with some risk-spending-approval procedure, and that’s simply because the actions were set down in the Risk Register together with any financial provision, and approved in one go.
Using a Risk Cycle
Enough of the high-level planning then, and on to specific risks. The PRINCE2 method now has a ‘procedure’ for risk management and has abandoned the use of a risk cycle to think through the handling of each particular risk. I think that’s a step backwards because the risk cycle in the previous edition was a particularly good one because it’s simple – so simple in fact that after you get used to it, you can keep the cycle in your head. As promised at the beginning of the chapter, this book is including a couple of older things that you may find helpful on projects, so we have kept in that cycle; just ignore this section for the moment if you’re about to take the PRINCE2 exams.
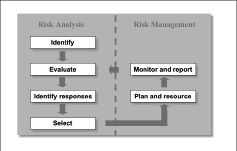
In line with many other approaches, the cycle divides neatly into two halves – risk analysis and risk management (see Figure 15-1). The point of this is that after analysing the risk you may well decide that no management is necessary, so you don’t move to the second half of the cycle. That point is lost in the new procedure, which covers the handling of all risk in one go, and the procedure also loses the advantage that the cycle shows identification of a particular risk as out of the main loop because you only do this once.
Figure 15-1: The 2005 edition PRINCE2 risk cycle.
Managing Risk with the Risk Procedure
PRINCE2 now models risk management with a procedure. The risk procedure seen in Figure 15-2 has four elements and because these go round in a circle they don’t function as a cycle but rather they handle all risk in the project en bloc.
Figure 15-2: The Risk Procedure.
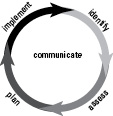
The next five major sections in this chapter are to look at each of the five parts of the risk procedure – the four arrows and the ‘communicate’ function in the middle – so the model gives you a roadmap for most of the rest of the chapter.
Although the PRINCE2 manual doesn’t provide too much in the way of techniques you can find lots to help with risk management and especially with risk identification and assessment. For details look around the Internet for publications that are ‘project techniques toolboxes’. You’ll find several including one from Inspirandum that’s designed to fit particularly well with PRINCE2 and another from John Wiley. Having said that, as this chapter continues in its ‘helpful mode’, and follows the model round, you’ll find a few useful techniques that you can apply easily.
Identifying Risk
First, you identify what the risks are. Lots of techniques can help with this and most are simple, such as using a risk checklist.
Risk categories and the Risk Checklist
You can find lists of risk categories in different risk publications, on the Internet and in risk software tools. There is one example in the next panel which is based on – yes, the previous edition of PRINCE2! Some use a simpler list such as the PESTLE acronym – political, economic, sociological, technological, legal, and environmental. Categories are useful because they help you break the risks up a bit so you can think them through in a more structured way, and also because it may help determine who should be responsible for managing them or even providing funds for management.
You can use risk categories (with common risks listed under each of them) as a Risk Checklist, which is the first of the risk techniques.
Commercial Risk Checklists can be very helpful, but a tailored list of headings and risks that are more precisely relevant to your own organisation is more valuable still. At the beginning of each project, after doing other risk identification activity, you can use your Risk Checklist as a safety net to see whether you missed anything. Risk specialists suggest that you don’t use the checklist first, as you’re likely to miss new risks.
![]() If you have a Project Office that provides administrative support (have a look at Chapter 12 for more on the Project Office), then that’s a good place to keep an organisational Risk Checklist. But other project staff mustn’t disown the checklist. If they see a new risk that may affect other projects, staff must ask the Project Office to add it to the list so that all projects consider it during planning. Equally, if someone finds that a particular risk just can’t happen in the organisation any more, then he needs to ask the Project Office to remove that risk from the list. That way, the Risk Checklist is always up to date, relevant, and extremely useful, and only a small overhead is required to maintain it.
If you have a Project Office that provides administrative support (have a look at Chapter 12 for more on the Project Office), then that’s a good place to keep an organisational Risk Checklist. But other project staff mustn’t disown the checklist. If they see a new risk that may affect other projects, staff must ask the Project Office to add it to the list so that all projects consider it during planning. Equally, if someone finds that a particular risk just can’t happen in the organisation any more, then he needs to ask the Project Office to remove that risk from the list. That way, the Risk Checklist is always up to date, relevant, and extremely useful, and only a small overhead is required to maintain it.
Identifying causes, events and effects
For each risk it’s helpful to break it into three parts. Different approaches use different names for this but PRINCE2 uses:
Cause
Event (the risk itself)
Effect
Although you can simply list these for each risk, another option is to use a diagram. Inspirandum’s ‘Project Techniques Toolbox’ suggests a notation with a triangle for a cause or trigger, a rectangle for the risk event and a circle for the effect, as shown in Figure 15-3. Diagrams like this can be particularly helpful because you can readily see the interaction between the different elements. For example, a particular cause may trigger more than one risk. You can also show chain reactions in risks where the effect of one risk is actually a cause of another, and the effect of that sets off yet another risk. It gets really interesting when you start to consider not only the effect of each risk if it happens on its own, but also combined effects if more than one risk happens at the same time. If you’re working in a project with any significant amount of risk you need to move towards this sort of detail in your risk analysis.
Figure 15-3: The Risk Anatomy Diagram.
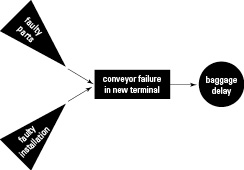
![]() Opportunities and threats. Picking up on the point that risk can be good or bad, PRINCE2 makes a further distinction on risk causes. The risk of something good happening is triggered by an ‘opportunity’ while the risk of something bad happening is a ‘threat’.
Opportunities and threats. Picking up on the point that risk can be good or bad, PRINCE2 makes a further distinction on risk causes. The risk of something good happening is triggered by an ‘opportunity’ while the risk of something bad happening is a ‘threat’.
Differentiating between risks and impacts
People often confuse risks and impacts. In someone’s Risk Register you may see:
Risk 3 – The project will overspend.
Risk 4 – The project will be late.
These are not risks but impacts. The risks are what may cause the project to go over budget and what may cause it to be late.
Understanding this opens the way to using a very helpful risk analysis technique, which is worth mentioning in passing because it can be so helpful in a systematic review of risk, and because it fits so well with using risk categories. It’s the Ishikawa or fishbone diagram (see Figure 15-4), which is sometimes known as a ‘cause and effect diagram’. The impact is the effect and you can systematically look at the causes, the risks that may give that impact.
You can use the chosen risk categories, as set down in the project’s Risk Management Strategy, as the primary fish bones and enter the individual risks as the secondary bones. This is simply a hierarchical diagram, but it’s really helpful because it takes you systematically through every area of risk and so gives structure to this part of your risk analysis. The technique makes you think about every area and so helps find risks that you may not otherwise realise are there.
Figure 15-4: An Ishikawa fishbone diagram.
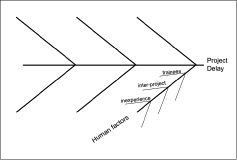
Figure 15-4 shows a partly completed fishbone diagram for the impact of delay in a project. It considers the human factors:
Trainees: The project must use a lot of trainees who are slower and are likely to make mistakes.
Inter-project: Some of the teams come from other projects, so if those projects get delayed then those teams may arrive late.
Inexperience: Team members have very limited experience in this technical area, and the budget doesn’t allow for getting help from outside.
You can use two other techniques for identifying risk instead of, or as well as, Risk Checklists and Ishikawa diagrams and just two are:
Interviewing: Talk to the Executive and other board members, team specialists, Team Managers, external suppliers, and Project Managers who’ve managed similar projects.
Examine the Product Flow Diagram: For each product box, ask whether anything may go wrong with its development. See which external products may affect the project badly if they’re delayed or if the supply doesn’t materialise. If you think a particular risk may always affect the project badly, don’t forget – for some of the externals at least – that you may have alternative sources of supply. Turn to Chapter 14 for more on this planning technique.
![]() You may like to run a risk workshop. You can get key people from the project together and spend some time listing on a flipchart what the risks are and how you can deal with them. This is quite good fun as well as being fast and highly effective. It also has the powerful advantage that key players on the project are already well aware of risk because they went to the workshop and joined in the discussion. Often, the memory of the workshop is more powerful than just reading about risks in the Risk Register later on. You can use quite a few of the risk techniques, such as the Ishikawa Diagram, very successfully in a workshop setting.
You may like to run a risk workshop. You can get key people from the project together and spend some time listing on a flipchart what the risks are and how you can deal with them. This is quite good fun as well as being fast and highly effective. It also has the powerful advantage that key players on the project are already well aware of risk because they went to the workshop and joined in the discussion. Often, the memory of the workshop is more powerful than just reading about risks in the Risk Register later on. You can use quite a few of the risk techniques, such as the Ishikawa Diagram, very successfully in a workshop setting.
Assessing risk
The next step in the risk procedure is to put some measures on the risks you’ve now identified. The two common measures are impact and probability – back to the monastery outside Paris mentioned at the beginning of the chapter – but you also need to consider proximity, which is how soon the risk may happen.
Calculating impact on a scale of one to . . .
Impact can be tricky and you need to define your scale carefully. You may do this just for a particular project, or you may have a standard scale in your organisation. Either way, it’s set down in the Risk Management Strategy. What PRINCE2 can’t offer is a standard scale that all organisations can use. If you work for a multinational organisation with an annual turnover of £23 billion (like one of my clients) then, on a scale of 1 to 5, what’s the impact of a loss of £1 million, assuming you’re not insured for it? If you work in a company with just two people and an annual turnover of £250,000, what’s the scale of impact of a loss of £1 million?
Most people involved with the management of projects are obsessed with time and cost. One impact you can easily overlook is reputation damage. Sometimes the knock-on effect of this is huge, and just one element going wrong somewhere can kill even a large multinational. Carefully think through impacts and don’t just stick with those that relate to time and cost.
Strangely, reputation damage works the other way round to financial impact in terms of large and small organisations. If a multinational company or government department has a major project problem, it’s picked up in the press and featured in newspapers with international circulation. If a small company has a major project problem, the press are rarely interested and it can go unreported and therefore not have any significant impact on reputation. So, if you work for a large organisation or one with a high public profile, watch out.
![]() Where a project goes into an unknown area and you don’t know whether doing something is even theoretically possible, you can think about including a ‘proof of concept’ product early on in the project to prove it is possible. You can even make this a ‘bottleneck’ product in the Product Flow Diagram – consult Chapter 14 on planning for more on this powerful technique.
Where a project goes into an unknown area and you don’t know whether doing something is even theoretically possible, you can think about including a ‘proof of concept’ product early on in the project to prove it is possible. You can even make this a ‘bottleneck’ product in the Product Flow Diagram – consult Chapter 14 on planning for more on this powerful technique.
Assessing probability
Impact can be a tough thing to work out, but it’s easy compared to probability. Probability has been described as ‘the Achilles’ heel of risk management’. The difficulty in working out probability revolves around a lack of information.
You can sometimes calculate probability on the basis of previous cases that are relevant to the current project. Examples of this occur in medicine, in insurance, and in oil exploration at sea.
![]() In the North Sea, the weather can get very bad, which stops companies carrying out survey work. When a survey is needed on part of the sea bed around an oil field, a ship with a mini-submarine goes out to do it using a variety of techniques including sophisticated ultrasound. But bad weather may mean that the ship can’t launch the mini-submarine and the crew has to wait on station until the weather calms before carrying out the survey. This waiting can sometimes last as long as two weeks. To help plan, companies draw on historic weather stats. The North Sea has been divided up into a grid and weather statistics are kept for every cell in that grid, so a company can determine the probability of bad weather in that part of the North Sea in any given week of the year. This helps quantify the risk of adverse weather causing delay.
In the North Sea, the weather can get very bad, which stops companies carrying out survey work. When a survey is needed on part of the sea bed around an oil field, a ship with a mini-submarine goes out to do it using a variety of techniques including sophisticated ultrasound. But bad weather may mean that the ship can’t launch the mini-submarine and the crew has to wait on station until the weather calms before carrying out the survey. This waiting can sometimes last as long as two weeks. To help plan, companies draw on historic weather stats. The North Sea has been divided up into a grid and weather statistics are kept for every cell in that grid, so a company can determine the probability of bad weather in that part of the North Sea in any given week of the year. This helps quantify the risk of adverse weather causing delay.
In many cases though, there’s no algorithm you can use for working out the probability and precious little in the way of repeated earlier experience. So the probability rating is based on your best guess – sorry, estimate.
Determining proximity
Proximity is simply how soon the risk can happen. In the strategy you set down what categories you have for specifying it. That can be helpful to see what risks can happen at any time, in a current stage, in the project and beyond the project (the categories suggested in the PRINCE2 manual) but you need to be aware of two other dimensions in the risk proximity:
Fixed: Fixed proximity is always a set time away. This includes the ‘now’ proximity. An example is a staff member going off sick: He may walk up to the Project Manager in five minutes’ time and say that he feels really ill and needs to go home. But fixed proximity can also be a set time into the future. Today, the proximity of the risk is four weeks. But in two weeks’ time the proximity is still four weeks. That may sound odd until you consider a simple example – a team member resigning and leaving the organisation. If the period of notice in his contract is four weeks, then if he resigns today he actually leaves the team in four weeks’ time. But if he resigns in two weeks’ time, he still works his period of notice and leaves four weeks after that.
Date-specific: Some proximities are fixed to calendar dates. If you face a risk that the project isn’t able to recruit enough bricklayers in October when you’re due to start the brickwork, then the proximity gets shorter and shorter as you get nearer to October.
Using a probability-impact (p-i) grid
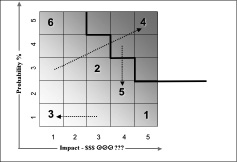
For the two measures of impact and probability you can use measures of very high, high, medium, low, and very low, or a numeric scale of 1–5 or 1–10. You can then plot the risks on a grid as shown in Figure 15-5. This technique is very useful because you see the big picture of where risks are. For example, have you got a lot of low-impact but high-probability risks?
The diagram is called a p-i grid here because that’s what most people call it. In the PRINCE2 manual, though, it is known as a Summary Risk Profile, with the p-i grid then being the same matrix, but with values set for each cell to give each one a severity factor, after deciding an exact scale up each axis.
Figure 15-5: The Probability-impact (p-i) grid.
![]() Some people like to use a simpler grid with just three measures on each axis of high, medium, and low, but risk experts recommend never using a scale of less than five, otherwise you just don’t think hard enough. But equally in most projects you’re best not going above ten – or you may find yourself in deep mental anguish when you try to decide whether a risk is a level 647 or a level 648 on your 1–1,000 probability scale.
Some people like to use a simpler grid with just three measures on each axis of high, medium, and low, but risk experts recommend never using a scale of less than five, otherwise you just don’t think hard enough. But equally in most projects you’re best not going above ten – or you may find yourself in deep mental anguish when you try to decide whether a risk is a level 647 or a level 648 on your 1–1,000 probability scale.
Where you decide to use numbers for risk and probability measures, you can then multiply them together to give an overall assessment of severity. One that has low probability and low impact, like Risk 3 in Figure 15-5, has a severity of 1 (1x1). One with very high probability and very high impact is more worrying, like Risk 4, which has a severity factor of 25. Although the higher the number, the greater your concern and the more attention you need to give to the risk in risk management, you also need to be careful about some of the lower numbers. Don’t play number games here because they don’t work. Risk 6 on the profile has very low impact, but its probability is so high that you need to do as much work on Plan B as you do on Plan A.
The profile is also great for showing movement since the last reporting point. The dotted arrow lines show which risks have moved since the last report. In addition, the profile shows risk tolerance. The top right of the profile is the high-severity area. The Project Board may define a zone at the top right like that shown on Figure 15-5 but it doesn’t have to be exactly that shape. The board want to be told immediately if any risk goes into or comes out of that zone. You must report that to them the same day and not wait for the next regular progress or Highlight Report. In the case of Figure 15-5, new information shows that Risk 5 now has a much lower probability than you previously thought. You must tell the board straight away that this highly dangerous risk is now much less likely. This helps board members sleep better at night instead of waking up with a nightmare about a risk that’s now only rather mild.
![]() One of the drawbacks of the grid is that it can get rather busy. Imagine a project with 100 risks or more. In that situation, a solution is to split the risks up and have several grids, each specialising in particular risk categories.
One of the drawbacks of the grid is that it can get rather busy. Imagine a project with 100 risks or more. In that situation, a solution is to split the risks up and have several grids, each specialising in particular risk categories.
Making the ‘before or after’ decision
Looking at the 2009 edition of the PRINCE2 manual, it’s good to recognise quite a few bits of advice built into the last edition of PRINCE2 For Dummies! Perhaps we should charge a fee! With the assessment of impact and probability you need to think about the measures before you take risk control actions and after. There are advantages in ultimately recording both and the PRINCE2 Risk Register now covers that point too (more on the Risk Register towards the end of the chapter). But at first you may circulate a copy of the p-i grid showing the ‘before’ or inherent values. Then, when action has been decided, you can change this to show the position ‘after’ risk management actions are taken into account, the residual risk. For ongoing reference during the project you need to show the new, ‘after’, assessment of impact and probability after the effect of risk management actions, otherwise your assessment doesn’t reflect the present state of the risk that you’re managing.
Even when you arrive at the ‘after’ position it’s still helpful to record the ‘before’ ratings in the Risk Register as well. Otherwise managers looking at the probability and impact measures may think a risk is insignificant being ‘very low – very low’ and not worth managing. But the true picture may be that without those management actions the risk will revert to its ‘before’ measures of ‘very high – very high’.
If you don’t have many risks, you can get really clever, assessing both before and after, and linking the two points on the p-i grid. If you see that in a future edition of the PRINCE2 manual please remember, you saw it here first.
Planning how to deal with a risk
Consider all the possible actions that you can take to control a particular risk. You have to think broadly here: Don’t limit your response to throwing money at the problem. Sometimes you can come up with an imaginative solution that requires brain power rather than money.
![]() Do remember the word ‘suitable’ when you consider risk actions. Although silly ideas have their place because they can sometimes trigger sensible ones, you don’t want the risk analysis sessions, particularly those involving any young and junior team members, to descend into farce. All this analysis costs the project money in terms of staff time, so although identifying risks and then actions can be fun, don’t allow it to waste time. The world being hit by a giant toxic meteor shouldn’t usually be in the Risk Register of a project to enhance the payroll system.
Do remember the word ‘suitable’ when you consider risk actions. Although silly ideas have their place because they can sometimes trigger sensible ones, you don’t want the risk analysis sessions, particularly those involving any young and junior team members, to descend into farce. All this analysis costs the project money in terms of staff time, so although identifying risks and then actions can be fun, don’t allow it to waste time. The world being hit by a giant toxic meteor shouldn’t usually be in the Risk Register of a project to enhance the payroll system.
Categorising the responses
Different risk approaches use different categories for the types of response. PRINCE2 has got a bit enthusiastic about this which, unfortunately, reinforces an impression that it’s complicated. It uses ten response types; six for downside risk – threats – and four for the upside risk – opportunites – as again it prioritises alignment with the UK government risk method. The ‘share’ response appears in both sets though.
![]() If you’re looking for a simpler set of risk responses, you may like to consider the American PMI (Project Management Institute) ones. For downside risk it uses avoid, transfer and mitigate, and for upside risk it uses exploit, share and enhance.
If you’re looking for a simpler set of risk responses, you may like to consider the American PMI (Project Management Institute) ones. For downside risk it uses avoid, transfer and mitigate, and for upside risk it uses exploit, share and enhance.
You can use risk management actions in combination. With home insurance, for example, two actions are in force. If you have an insurance policy it probably says that you must close the door and lock it when you go out. This prevents someone just walking in. But your locks are only prevention to a certain level and you’re not required to recruit your own personal round-the-clock security force. Just lock the door, and after that the insurance company accepts the transfer of the risk, albeit for a generous fee (have you seen the smart headquarters buildings of all the insurance companies?).
![]() Just in case you’re studying this book at a time when you have a PRINCE2 exam coming up and need to memorise this stuff, drowning is a downside risk so to keep safe your response needs to be AS RAFT (an acronym that spells out the threat responses). If the risk is a good one then to take advantage you need to be as wise as a SEER. Check out the nearby sidebar ‘Responses for opportunities – the upside risks’ for more on this acronym.
Just in case you’re studying this book at a time when you have a PRINCE2 exam coming up and need to memorise this stuff, drowning is a downside risk so to keep safe your response needs to be AS RAFT (an acronym that spells out the threat responses). If the risk is a good one then to take advantage you need to be as wise as a SEER. Check out the nearby sidebar ‘Responses for opportunities – the upside risks’ for more on this acronym.
Deciding which of the possible actions to take and which not to is a human judgement. Given that many of the actions require money, or staff time that represents money, this decision belongs to the board and especially the Executive, who owns the Business Case and is responsible for value for money.
Selecting the responses to act on
The PRINCE2 manual suggests that you base the decision on a balance between the cost of taking that particular action and the probability and impact (severity) of the risk. That’s absolutely right, but it leaves out the time factor. Occasionally, the time impact on the project rather than the cost is significant in a potential action. For example, if a project proves more complicated than I thought, I may find that I don’t have enough skilled staff available. This situation is highly likely and the resulting impact is also very high. I can identify an action of training up more specialists, but that action may not be as suitable as hiring in skilled staff. This isn’t for cost reasons – training may actually be cheaper – but because of the time needed to carry out sufficient training. Arguably, more dimensions exist, but you get the picture.
Implementing the Risk Responses
Risk management isn’t always necessary, though it usually is. If you simply ‘accept’ a risk then by definition no management action takes place. But you still need monitoring in some cases, because if circumstances change, acceptance may no longer be a sensible response.
You need to build the risk actions into the Project Plans and also Stage Plans as appropriate, to show the necessary activities and resources. Clearly, this may have implications for the overall cost of the project and the time you require to do it, but the Project Board are well aware of those implications because they’re involved in deciding the risk actions. You also need to be clear on who is in control of a risk and who is to take action if it occurs.
![]() Risk owner and risk actionee. The person who’s best placed to monitor the risk and control any action is the ‘risk owner’. The person who takes any action is the ‘risk actionee’. It’s possible that for a particular risk, the person who owns it may also be the actionee.
Risk owner and risk actionee. The person who’s best placed to monitor the risk and control any action is the ‘risk owner’. The person who takes any action is the ‘risk actionee’. It’s possible that for a particular risk, the person who owns it may also be the actionee.
![]() As with the rest of project management, it’s important that if risk actions are at all dangerous, you appoint someone other than you to be the actionee. Because of your advanced skills, you need to survive to run another project.
As with the rest of project management, it’s important that if risk actions are at all dangerous, you appoint someone other than you to be the actionee. Because of your advanced skills, you need to survive to run another project.
Actually taking the planned action
Implementing is the final section of the external part of the risk procedure model and may sound a bit obvious. But two important points emerge about this. The first is that you must make sure that the risk actions are indeed taken. Projects have come to grief because although risks were spotted and countermeasures planned, they were never actually carried out.
The second important point exposes another downside of the PRINCE2 risk procedure; it doesn’t mention monitoring. But risk factors change. For this reason you must have monitoring in place and you must not neglect this when thinking about implementation. Risk factors can change in two areas: the project and the business environment outside the project. That outside area splits into two as well; outside the project but still in the organisation, or in the wider world beyond the organisation. All these factors can change the status of the risk and so necessitate a re-evaluation of the risk and the measures being taken to control it. If you use the risk cycle illustrated earlier in this chapter you’ll get the idea as the monitoring brings the risk cycle back round into the analysis half, returning it to evaluation.
Communicating Information About Risk
The final part of the risk procedure in PRINCE2 is the bit in the middle of the procedure model, ‘communicate’. This is going on all the time. In communication you need to keep others up to date with the risk position in the project as well as to get input into the risk management process. For these communications you may find the information you stored in the Communications Management Strategy helpful – see Chapter 5 – and in particular the two final sections where you listed stakeholders and others who need to be informed.
Communicating risk information needs to be carried out in the most appropriate way; ‘appropriate’ communication is what the Communication Management Strategy is all about. In some cases, risk information can be included in the standard reports used for reporting progress and for reporting project status at set points, notably at the end of project stages.
![]() Be careful that risk reporting doesn’t have to go through too many layers. For the Inspirandum project risk workshop, we’ve come up with the expression ‘one-bounce risk reporting’. In other words, someone at the coal face shouldn’t have to go through more than one other person before reaching whoever is responsible for the risk, otherwise it’s likely that the message gets diluted as it goes up the chain. We use the example of ‘A major crisis’ becomes ‘A serious concern’ becomes ‘Something of a problem’ becomes ‘A bit of a snag’ becomes ‘Are you free for lunch? I know a nice little place . . .’.
Be careful that risk reporting doesn’t have to go through too many layers. For the Inspirandum project risk workshop, we’ve come up with the expression ‘one-bounce risk reporting’. In other words, someone at the coal face shouldn’t have to go through more than one other person before reaching whoever is responsible for the risk, otherwise it’s likely that the message gets diluted as it goes up the chain. We use the example of ‘A major crisis’ becomes ‘A serious concern’ becomes ‘Something of a problem’ becomes ‘A bit of a snag’ becomes ‘Are you free for lunch? I know a nice little place . . .’.
Registering a Risk . . . or Not
You must regularly review the Risk Register and keep things like status up to date. At a minimum, you do this at each stage end, where the PRINCE2 process builds in this action. But you may need to review the risk assessment during the stages as well, particularly if your project is high risk. Equally, you also need to check the risk impact of any problems or other issues. Chapter 6 looks at stage boundaries and Chapter 7 covers running the stages.
In PRINCE2, you document all risks by making a record for each one in the Risk Register. You open this in Start Up with entries for just the main risks and a bit of detail on each one. In the Initiation Stage (the first project stage that covers the full planning of the project) you fill in the Risk Register with all the risks you identify, giving full details for each one. Flip to Chapter 4 for more on Start Up and have a look at Chapter 5 for more on Initiation.
Making a Risk Register entry
You complete a Risk Register entry for every risk that’s been identified and where the risk is to be formally managed. In Start Up the information may be quite sketchy, and at that time is noted in the Daily Log, but is filled out when you do the risk analysis during the Initiation Stage. After that you keep the register up to date throughout the project, changing the information on the risk as necessary (such as a change of status requiring you to modify the control actions).
Safely Leaving Out Risk Management
Some people ask whether you can ever safely leave out risk management, such as in small projects. No, you can’t. Although a project being very large may be a risk factor in its own right, other than that, risk isn’t related to project size. A very large project may be quite low risk whereas a very small one could carry very high risk.
![]() A London finance house ran a very small project that took two staff just 6 weeks to complete – 12 staff weeks of work. However, the project carried enormous commercial risk. If it went wrong, it would have a potentially unrecoverable impact on the reputation of that finance house, including all its share-dealing services, which were worth billions. It was a tiny project but with huge risk, so significant risk management action was fully justified.
A London finance house ran a very small project that took two staff just 6 weeks to complete – 12 staff weeks of work. However, the project carried enormous commercial risk. If it went wrong, it would have a potentially unrecoverable impact on the reputation of that finance house, including all its share-dealing services, which were worth billions. It was a tiny project but with huge risk, so significant risk management action was fully justified.
Someone has said that the right question isn’t, ‘Should we do risk management?’ but, ‘How much risk management should we do?’
Interestingly, small projects are higher risk in some respects than larger ones. If you have a project team of 100 and one person goes off sick, what’s the impact? Just 1 per cent, although that person may feel he’s much more important than that. But if you have a project with just two staff and one goes off sick? That’s 50 per cent of staff resource.
In a low-risk project you may not do very much risk management, and adjusting the degree to which you use PRINCE2 activities allows for this. But don’t ignore the method where it calls for risk-management work. Instead, always look for risks and so protect the project from the obvious things that may cause trouble later.