The Wireshark main window appears when Wireshark starts capturing a packet, or when a .pcap file is open for offline viewing. It looks similar to the following screenshot:

The Wireshark UI interface consists of different panes and provides various options to the user for customizing it. In this chapter, we will cover these panes in detail:
|
Item |
What is it? |
|---|---|
|
The red box |
This shows that Wireshark is running and capturing a packet |
|
1 |
This is the Filter toolbar, used for filtering packets based on the applied filter |
|
2 |
This is the Packet List pane, which displays all captured packets |
|
3 |
This is the Packet Details pane, which shows the selected packet in a verbose form |
|
4 |
This is the Packet Byte pane, which shows the selected packet in a hex dump format |
First, just observe pane 2 in the screen; the displayed packets appear with different colors. This is one of Wireshark's best features; it colors packets according to the set filter and helps you visualize the packet you are looking for.
To manage (view, edit, or create) a coloring rule, go to View | Coloring Rules. Wireshark will display the Coloring Rules dialog box, as shown in the screenshot:

Users can create a new rule by clicking on the New button, choosing the filter name and filter string, and then applying a foreground and background color to it, to customize the packet with a specific color.
The Wireshark display filter displays packets with its available coloring options. Wireshark display filters are used to change the view of a capture file by providing the full dissection of all packets, which helps analyzing a network tracefile efficiently. For example, if a user is interested in only HTTP packets, the user can set the display filter to http, as shown in the next screenshot.
The steps to apply display filters are as follows:
- Open the
http_01.pcapfile. - Type the
httpprotocol in the filter area and click on Apply.
Once the filter is applied, the Packet List pane will display only HTTP protocol-related packets:

Wireshark display filter can be applied or prepared from the column displayed in the Packet List pane by selecting the column, then right-clicking and going to Apply as Filter | Selected (as shown in the following screenshot) to create the filter from the source IP address 122.167.102.21:

Wireshark provides the flexibility to apply filters from the Details pane; the steps remain the same.
Wireshark also provides the option to clear the filter. To do this click on Clear (available in the Filter toolbar) to display the entire captured packet.
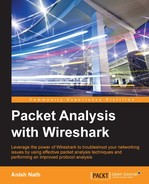
Capturing and displaying packets properly will help you with packet captures. For example, to track a packet exchanged between two hosts: HOSTA (10.0.0.221) and HOSTB (122.167.99.148), open the SampleCapture01.pcap file and apply the filter ip.src == 10.0.0.221 as shown:

Let's see what the highlighted sections depict:
|
Item |
Description |
|---|---|
|
1 |
Apply filter |
|
2 |
The Packet List pane displays the traffic from source to destination. The source shows the constant IP address |
Now modify the filter (ip.src == 10.0.0.221) && (ip.dst == 122.167.99.148) to (ip.src == 10.0.0.221) or (ip.dst == 122.167.99.148). This will give the result shown in the following screenshot:

The highlighted sections in the preceding screenshot are explained as follows:
|
Item |
Description |
|---|---|
|
1 |
Applied filter |
|
2 |
The source IP address ( |
|
3 |
The destination IP address ( |
Again the Packet List pane is not displaying the conversation between the two hosts.
Now modify the filter ip.addr == 122.167.99.148. The ip.addr field will match the IP header for both the source and destination address and display the conversation between the hosts. Remember to choose the destination IP address as shown:
Let's see what the highlighted sections depict:
|
Item |
Description |
|---|---|
|
1 |
Applied filter |
|
2 |
The source IP is not constant; it shows the conversation between the two hosts |
|
3 |
The destination IP is not constant; it shows the conversation between the two hosts |
The same conversation is captured by choosing the destination MAC address using the display filter eth.addr == 06:73:7a:4c:2f:85.
Some common filter examples are as follows:
|
Filter/capture name |
Filter value |
|---|---|
|
Packet on a given port |
|
|
Packet on the source port |
|
|
SYN packet on port |
|
|
The HTTP protocol |
|
|
Based on the HTTP |
|
|
Using |
|
|
Checking the |
|
|
No |
|
|
The MAC address filter |
|
|
Filter out TCP ACK |
|
|
Check only RST and ACK packets |
|
|
Filter all SNMP |
|
|
HTTP or DNS or SSL |
|
There is no need to memorize the filter; there is an easy way to apply it. The display filter Autocomplete feature lists all dissectors after the first period "." that have been added to the display filter, as shown in the following screenshot:

Note
It's worth checking the following links for a complete display filter reference:
- Check out the TCP display filter reference: https://www.wireshark.org/docs/dfref/t/tcp.html
- Check out this alternative protocol display filter reference: https://www.wireshark.org/docs/dfref/
The Packet List pane displays packets from the .pcap (or accepted Wireshark extensions) file or from live capture, as shown:

Let's discuss the fields shown:
To change the time-stamped information of the packet go to View | Time Display Format to view the available presentation formats, as shown:

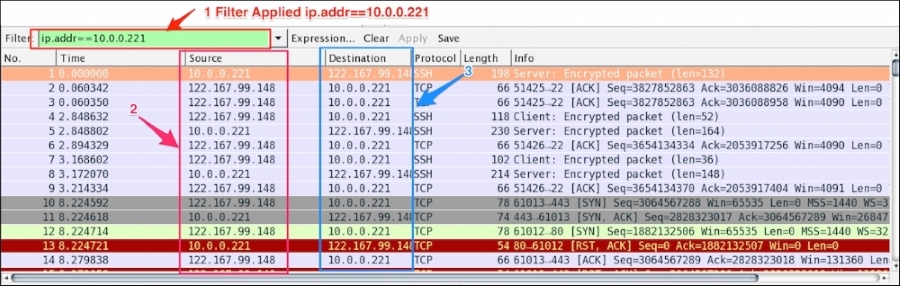
The Wireshark Set Time Reference feature gives you the ability to view the time reference from the selected packet. Open the capture file http.pcap and set the time reference from packet 38. To do this, select packet 38, right-click, and select Set Time Reference (toggle), as shown in the following screenshot:
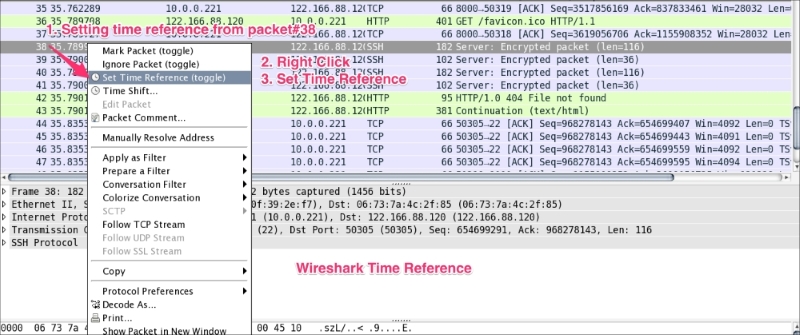
After *REF* is set, it becomes the starting point for all subsequent packet time calculations, as shown in the following screenshot:

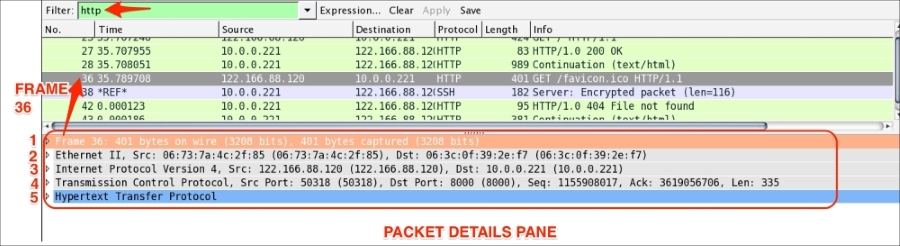
The Packet Details pane will show the currently selected packet in a more detailed form. In the following screenshot, an HTTP packet is selected and its details are shown in the information labeled with numbers 1 to 5. Let's see what these are:
The frame protocol is only used by Wireshark. All the TCP/IP protocols sits on top of this. The frame shows at what time the packet was captured, as shown in the following screenshot:

Ethernet is the link layer protocol in the TCP/IP stack. It sends network packets from the sending host to one (Unicast) or more (Multicast/Broadcast) receiving hosts, as shown:
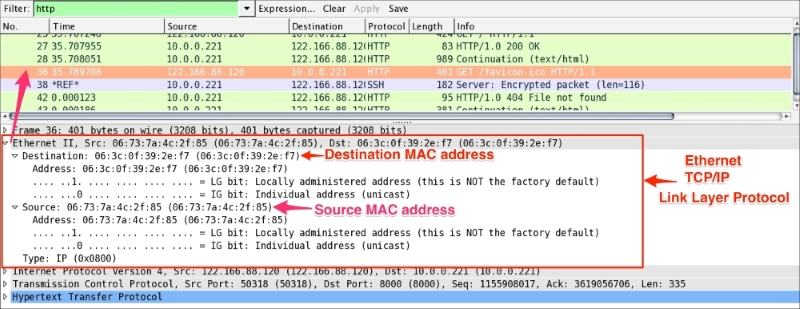
Useful filters in Ethernet are:
eth.dst == 06:3c:0f:39:2e:f7: This shows packets sent to this MAC address onlyeth.dst==ff:ff:ff:ff:ff:ff: This shows broadcast traffic only
The packet structure of Ethernet frames is described in the following table:
|
Preamble |
Destination MAC address |
Source MAC address |
Type/length |
User-data |
Frame check sequence (FCS) |
|---|---|---|---|---|---|
|
8 |
6 |
6 |
2 0800 for IPv4 86DD for IPv6 0806 for ARP |
46-1500 |
4 |
The preamble (8 bytes) and FCS (4 bytes) are not part of the frame and Wireshark will not capture this field.
So the total Ethernet header is 14 bytes—6 bytes for the destination address, 6 bytes for the source address, and 2 bytes for the EtherType.
The Internet Protocol information relates to how the IP packet is delivered and whether it has used IPv4 or IPv6 to deliver the datagram packets.

The preceding screenshots show that an IPv4 protocol is used to deliver the datagram packet. Useful display filters in the IP protocol are:
ip.src == 122.166.88.120/24shows traffic from the subnetip.addr==122.166.88.120shows traffic to or from the given host- Host
122.166.88.120captures/filters traffic from the host
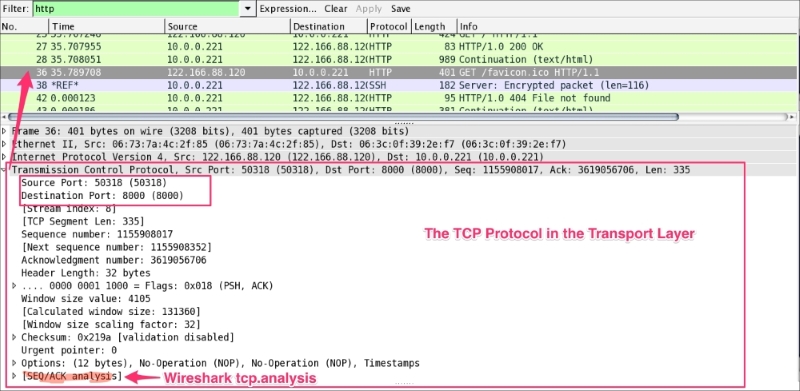
The TCP protocol packet contains all TCP-related protocol data. If the communication is over UDP, the TCP will be replaced by the UDP, as shown in the following screenshot. The SEQ/ACK analysis will be done by Wireshark based on the sequence number and expert info will be provided:
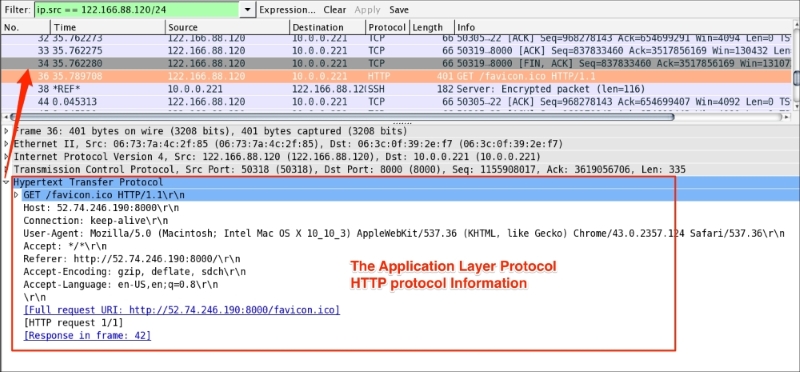
The <<APPLICATION-LAYER>> protocol is shown if the packet contains any application protocols. As shown in the following screenshot, the selected packet 36 has HTTP protocol data. Wireshark has the ability to decode the protocol based on the standard port and present this information in the Packet Details pane in a readable (RFC-defined) format.
In the coming chapters we will discuss the application-related protocol in greater detail.