14
How to Compile and Assimilate a Bonus Performance Plan
“In business, words are words; explanations are explanations, promises are promises, but only performance is reality.”
—Harold S. Geneen
Compiling and assimilating the performance bonus plan are the last pieces in the performance management puzzle. Once you reach this stage, you are well on your way to achieving superior performance. By this time, the firm has developed its compelling vision, set its strategy and goals, and is ready to match rewards with performance.
In this chapter, we share with you our approach for developing an owner or employee performance bonus plan that builds on the performance management concepts we presented in part 2, “What You Need to Reward,” of the book.1 We also provide examples of written win-win agreements we have discussed in earlier chapters, so you can see how everything ties together.
The Right Performance Bonus Plan
In his book, The E-Myth Revisited: Why Most Small Businesses Don’t Work and What to Do about It, Michael Gerber emphasized that most entrepreneurs can’t, nor should they, do everything themselves. Building a sustainable business or accounting practice requires a team effort. Firms that grow and prosper embrace this concept. Owners in CPA firms often find it difficult, however, to embrace this idea because much of their security rests with their book and their personal relationships with their clients. It is the wise group of owners who treat clients like firm assets rather than individual assets.
The right performance bonus plan encourages and rewards people for achieving firm, team, and individual goals. We believe the performance bonus plans we propose encourage team members to achieve both independent and interdependent goals. As we’ve explained in previous chapters, a poorly designed plan or poorly selected performance measures may motivate inappropriate or nonproductive behaviors.
Effective performance bonus plans have specific elements of compensation at risk that may vary from person to person so participants can focus on what they do best—as long as it serves the team. Team members should see a cause-and-effect relationship between what they do, what it means to the firm, and how they get rewarded. If people cannot see these linkages, the performance bonus payment may be meaningless to them.
We have found that firms are moving toward, and experimenting with, different at-risk performance bonus plans to attract and retain who they consider the right people. Some firms have become employee stock ownership plans (ESOPs)2 so that everyone in the firm is an owner and shares in the firm’s long-term growth. Some firms, even though they are not ESOPs, have set up profit-sharing arrangements. Other firms are funding retirement plans for owners or other bonus arrangements that range from simple to complex.
Many entrepreneurial businesses have bonus arrangements or results-oriented plans that are based on both business results and, unfortunately, owner prerogative. The amount and timing of payments depend on a subjective evaluation of the owner and his or her accomplishments related to business results. Although these bonus plans have the advantage of simplicity and flexibility, they often lack precision and predictability. Rather than motivating appropriate behavior, they may encourage team members to sugarcoat results. This practice may also result in individuals who are perceived by their peers as the “favored children” rather than measurable contributors.
We encourage you to keep the following common issues with bonus compensation plans in mind as you develop your own bonus compensation plan:
Plans are not well-understood.
Plans are not aligned with business strategy.
Payment is infrequent, resulting in a disconnect between performance and reward.
Goals are not set or are unrealistic.
Results are not measured and communicated.
Appraisals are not done.
Management override, instead of business results, determines the amount of bonus payments.
Sample Performance Bonus Document
Most CPA firms don’t have a written performance bonus document that outlines their plan and eligibility like you would find available in publicly held companies. For instance, when you look at a Securities and Exchange Commission Form 10-K of a major public company, you normally find a description of the company’s compensation performance plan. We hold that accounting firms should also create a plan document to ensure total clarity. You can have one document for the owners and one for nonowners. For nonowners, you can share the plans with them during recruitment and on-boarding. The firm’s compensation committee, managing partner, or executive committee can be responsible for updating this document. Exhibit 14-1, included at the end of the chapter, serves as an example of what the plan could contain.
Owner Performance Bonus Plans
Once you have the performance bonus plan document prepared, you can then move to the next step: creating performance categories, or “buckets.” Regardless of firm size, we have found that performance “buckets” generally fall within one or more of the following categories:
Economic or financial
Business development
Marketing
Client service
Value enhancement
Systems improvement
Growth and learning and talent development
We don’t believe any single owner or employee should have goals in each of the preceding “buckets.” To do so would dilute focus, thus setting up the individual for failure. Ideally, we like to see individuals focus on no more than three “buckets” with varying weights.
For example, the owner who heads the audit department may focus more on the financial results of the department, but a strong business developer would focus more on business development than systems improvement. The focus or emphasis could also change from year to year depending on the needs of the firm or the interest or skill set of the individual. For example, one year, the audit head may need to focus more on improving internal systems to improve the financial results of the department, whereas the next year, she may have to focus on working more closely with the tax department to bring in new business. Perhaps the best way to see how all the elements of a performance bonus plan work is to use the following case studies.
Case Study—Compensation System in a Midsized Firm
This case study and the one that follows illustrate the concepts we have discussed throughout the book. When we work with a client, we take into consideration his or her current compensation and the changes he or she wants to make. Thus, the starting point for each client is different.
Several years ago, a midsized firm with five owners asked us for assistance in developing a pay-for-performance bonus plan for the owners. It wanted to develop a new plan that could be implemented over a period of several years. After gaining an understanding of needs and what owners were willing to embrace, we proposed the following plan.
We suggested the firm start with the previous year’s total owner compensation and agreed upon a percentage of that amount as total base compensation for the five owners for the current year. We called their base salaries level 1 compensation. The owners felt comfortable taking 77 percent of the previous year’s total compensation as their level 1 draws (salaries). Each owner reduced his or her draws by 23 percent. They estimated the current year’s net income and decided to allocate the difference between the actual net income and level 1 draws to a performance bonus pool. This performance bonus pool was level 2 compensation.
When firms take this approach, we usually recommend they allocate approximately 75 percent to base salaries and 25 percent to the performance pool (level 2 compensation). For some firms, this can be achieved during the first 3 years of the new system. The goal is to continue to lower the base salary and increase bonus opportunities over time. Because most owners will not receive 100 percent of their bonus potential, a third level of pay was developed to reward owners who have an extraordinary year (level 3 discretionary pool). The owners wanted some recognition for service time as an owner, so we allocated 1 percent per year of service up to a maximum of 10 percent (10 years) of the individual bonus pool. For example, if each partner had the potential of $80,000 in the individual bonus pool, a first-year partner would be awarded $800, and an owner with 10 years would get the entire $8,000.
Let’s assume that in the previous year, total owner compensation was $1.2 million. For the current year, the firm decides to distribute to the owners 78 percent ($934,000) that is allocated based on the previous year’s draws. This leaves $566,000 for the performance pool, or a potential bonus of $113,200 for each of 5 owners. Each owner has an individual winwin agreement with the firm. Exhibit 14-2, included at the end of the chapter, shows how owner 1 performed.
The owner in the example received $84,900 of the potential bonus of $113,200. Each owner in this system must reach a minimum level of performance in each area to receive the bonus amount for that area. If they don’t reach the minimum level, no bonus is awarded. The difference between the potential bonus amount ($113,200) and the amount the owner actually received ($84,900) is returned to the performance pool for distribution at level 3 (extraordinary performance). A firm can distribute the discretionary pool in many different ways. The important thing is that the owners agree at the beginning, rather than the end, of the year about how they will divide the discretionary pool. For example, some firms decide to divide the discretionary pool equally among the owners. Others decide to allocate it to the owners who had a good year or a series of good years. Still others decide to allocate the discretionary bonus based on capital accounts
In this example, owner 1 did not have a stellar year. On average, owners generally achieve approximately 85 percent of the total goal potential, but owner 1 earned only 75 percent. Although owner 1 did achieve the billable hour goal, he failed to achieve the realization target. Although the partners wanted an all-or-nothing bonus for each criteria, which exhibit 14-2 shows, we believe a sliding scale that rewards an owner or employee once he or she achieves a minimum level of performance is a more motivating way to reward people.
The key here is that each owner had different tangible (objective) and intangible (subjective) goals to achieve.
Case Study—Large Firm
You will recall that, in chapter 4, “Link People Performance to Strategy,” we presented the case of Hunt & Associates, a fictional CPA firm that is one of the largest independent firms in its major metropolitan area—a very competitive environment. The owners of Hunt & Associates realize they need a refined a strategy to remain independent and competitive.
To do so, owners and key management team members held a two-day retreat and agreed on objectives previously listed in chapter 4. Based on those objectives, what might their bonus compensation plan look like for different levels in the firm? Subsequently, we provide you with compensation examples for the managing owner, executive committee members, line owners, and managers.
Let’s assume the following about Hunt & Associates:
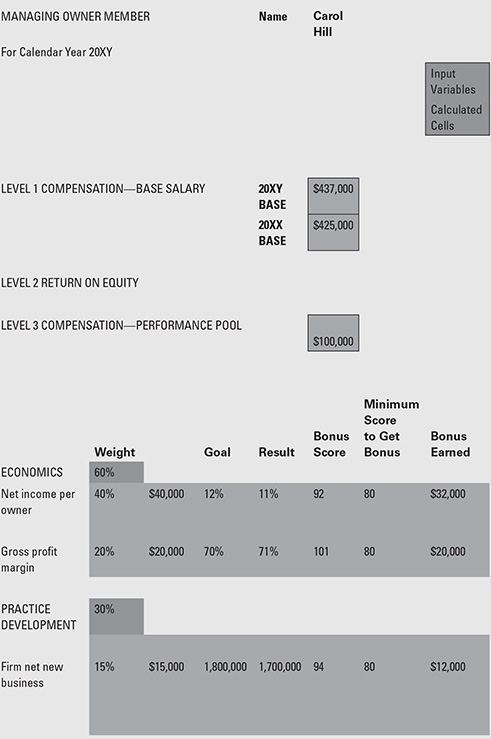
The firm’s revenue is $18 million, and it has preowner net income of $5.8 million.
There are 14 equity owners and zero nonequity owners. Owners have decided that for the first year of the performance bonus plan, $1.4 million of preowner net income will be set aside for the performance bonus. Each owner has the potential for a $100,000 bonus.
To qualify for all or part of the bonus, an individual must achieve at least 80 percent in each goal category. Performance under the 80 percent level will not warrant a bonus. Once an individual reaches the 80 percent to 84.9 percent level, he or she qualifies for 40 percent of the bonus. To reach 100 percent of the bonus, the individual needs to achieve a performance score of at least 95 percent.
Exhibit 14-3, included at the end of the chapter, shows the various ranges and percentage of maximum potential bonus (MPB) that an owner or employee can earn. Nothing is cast in stone about these ranges; each firm can determine what it considers to be superior performance.
Managing Owner and Executive Committee
The firm has a 3-member executive committee that consists of the managing owner and two additional owners. The managing owner bills approximately 300 hours per year and spends the remainder of his or her time leading the firm. The other two owners bill approximately 900 hours each and spend the rest of their time helping the firm grow.
The first thing to do is identify the top three or four firm goals. Ideally, we want the managing owner to focus his or her time and energy on achieving these goals. Hence, the managing owner’s bonus compensation would be based on how well the firm achieves these goals.
Let’s further assume the following agreed-upon firmwide initiatives:
Reorganize the firm by industry niches.
Increase net income per owner by 12 percent, half of which will come from mergers.
Improve owner collaboration. This is measured through a 360-degree survey conducted at the end of the year.
Because the firm is in growth mode, a majority of leadership bonuses will be based on an increase in net profits per owner and new business development. The managing owner devotes 90 percent or more of his or her time to leading the practice, so his or her bonus agreement is based entirely on achieving firmwide goals. We want the managing owner to focus on driving firmwide results.
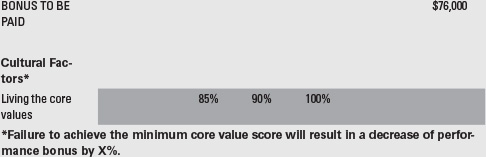
See exhibit 14-4, included at the end of the chapter, for the managing owner’s win-win agreement.
Because the other two members of the executive committee bill approximately 900 hours and are responsible for the audit and tax areas, we changed their goals to better reflect their roles. This is shown in exhibit 14-5, included at the end of the chapter.
Line Owners
The eight line owners are primarily responsible for production, so the majority of their goals are based on billable time or bringing in new business. Typical measures for line owners include
improve gross profit margin.
increase revenue.
improve client satisfaction.
improve client loyalty.
improve employee engagement.
Let’s look at the win-win agreement illustrated in exhibit 14-6, included at the end of the chapter, for owner Frank Stella. Frank’s base salary increased approximately 3 percent over the previous year from $300,000 to $309,000. Frank is eligible for a maximum $100,000 performance bonus. Potential total compensation for Frank is $409,000.
For Frank to earn his bonus, he must focus on personal production and realization. The firm has given these factors a weight of 60 percent of the total performance bonus. If we fast forward to the end of the year, we see that Frank achieved 92 percent of his billable hour goal and receives a $32,000 bonus. He also achieved the net realization goal and will receive an additional $20,000 bonus.
Frank also performed well in the business development area. His goal was to bring in $75,000 in new business from existing clients. He brought in $60,000, or 80 percent of the goal. This earned him 40 percent of the $20,000, or $8,000.
Finally, Frank had a goal to develop two new audit managers. He did not achieve this goal and earned nothing. Frank is living the firm’s core values, so there was no reduction to his bonus. His total performance bonus was $60,000. The remaining $40,000 goes into a discretionary bonus pool.
Managers
The available maximum bonus for the manager is $25,000. Mary Astor is a second-year manager, so the firm wants her to continue to focus on personal production. (Half the manager’s bonus is based on profitable production.) However, the firm also wants Mary to start building her business development skills and places a weight of 20 percent of the total bonus on business from new and existing clients. Note that the goal is not a dollar amount but a number of new opportunities.
Finally, Mary is tasked with taking the lead with five clients during the coming year. The more Mary can assume client relationships from other owners, the more these owners can spend time performing other critical work for the firm.
Exhibit 14-7, included at the end of the chapter, shows Mary’s win-win agreement.
Discretionary Pool
Let’s assume that of the $1.4 million in potential owner bonus, only $1,190,000 was actually earned and paid. That leaves $210,000 in the owners’ discretionary pool. Usually, the managing owner and executive committee allocate this amount. If the firm has long-term awards in place, it may use these dollars to pay them. A long-term award is one that is paid every three or so years based on firm, team, or individual performance of that period, or it may allocate some or all to owners who have had an exceptional year. Some firms may also choose to allocate the discretionary pool based on their equity position. Regardless of what you decide, just be sure you determine criteria up front rather than waiting until the end of the year.
Final Thoughts
Since we started developing bonus compensation plans, we have continued to simplify the template to focus owners on implementing strategy. For example, we formerly allocated some of the bonus potential to living the core values (the cultural factor). As we talked with more and more owners, however, we mutually agreed that owners should not be rewarded for doing what is expected. Therefore, in more recent compensation plans, the culture factor has been eliminated as a bonus factor. However, the bonus can be reduced if the individual owner does not obtain a minimum score on a 360-degree survey.3
When you develop your plan, our advice is to:
keep it simple because too many plans have been killed by their complexity.
recognize it usually takes a few years to work out the kinks in the plan, so be patient.
be bold in changing the plan if you find something is not working the way you intended.
Exhibit 14-2: Performance Bonus in a Midsized Firm

LEVEL 1 COMPENSATION–BASE SALARY POOL
A percentage of prior year’s total compensation (include car allowance and insurance payments)

LEVEL 2 COMPENSATION—PERFORMANCE POOL


LEVEL 3 (OPTIONAL)—SPECIAL SUBJECTIVE BONUS ALLOCATION (Extraordinary Performance)
Exhibit 14-3: Sample Maximum Potential Bonus (MPB) Ranges
Bonus score ranges and related percentage of MPB payout
| Level | Minimum score | Maximum score | Percentage of MPB |
| 1 | 95 | 100 | 100% |
| 2 | 90 | 94.9 | 80% |
| 3 | 85 | 89.9 | 60% |
| 4 | 80 | 84.9 | 40% |
| 5 | < | 80 | 0% |