
CHAPTER 6
How to Think About the Wisdom of Crowds
“And the Oscar Goes to …”

After taking a security analysis class taught by Paul J. at Columbia Business School in the fall of 1994, Paul S. and 21 of his classmates coaxed Paul J. into teaching an advanced investing course in the spring 1995 semester.
For several years, Paul S.’s friend, Jodi Heller, hosted an annual Academy Awards party where she had guests fill out ballots guessing who would win the Oscar in a small number of popular categories. To make the contest more fun, Jodi had everyone contribute to a betting pool and then awarded a cash prize to the most accurate forecaster.
With the 67th Academy Awards only a few weeks away, Paul S. thought it would be interesting to run a similar contest in Paul J.’s class, not as a test of forecasting abilities, but as a fun diversion. Paul S. suggested using Jodi’s contest format.
Coincidentally, Paul J. had recently read an article written by Jack Treynor1 that discussed a contest Treynor had run in his investment class at USC where he challenged his students to guess the number of beans in a jar he passed around the classroom. According to the article, Treynor ran the experiment twice. The jar had 810 beans in the first experiment. The average (mean) guess for the students was 841 and only 2 of the 46 students’ estimates were closer to the true value than the classroom average. The jar held 850 beans in the second experiment. This time the mean estimate was 871 with only one of the student guesses more accurate than the average. Treynor made the following observation in the article:
Apparently it doesn’t take knowledge of beans, jars or packing factors for a group of students to make an accurate estimate of the number of beans in a jar. All it takes is independence [emphasis added].2
With his interest piqued, Paul J. tried to replicate Treynor’s bean jar experiment using the 1995 Academy Awards contest as his bean jar. To facilitate the experiment, Paul J. asked his students to pick their best guess as to who would win the Oscar in each of 12 categories.
In addition to recording each student’s guesses, Paul J. tallied the median nominee selected by the students in each category, which he designated as the “group’s selection” and deemed the consensus view. After the Oscars had been announced, Paul J. determined the class winner and awarded the prize money. The contest results supported Treynor’s experience: the consensus beat the individuals.
As Table 6.1 shows, the consensus guessed 9 of 12 winners correctly, which is an impressive 75% accuracy rate. The best student in class only matched the consensus, also guessing 9 of 12 correctly, while everyone else in the contest did worse. The second-place winner guessed 8 of 12, or 67%, correctly, and the average student (excluding first and second place) got only 5 of 12, or 43%, correct.
Table 6.1 Academy Award Contest Results
| Individuals | ||||
| Consensus | 1st Place | 2nd Place | Average | |
| Number Correct | 9 of 12 | 9 of 12 | 8 of 12 | 5 of 12 |
| Percent Correct | 75% | 75% | 67% | 43% |
Paul J. ran the contest again in his class the following spring, with more students, the same rules, and similar results. That year’s consensus and best student both guessed 8 of 12, or 67%, correctly; second place guessed 7 of 12, or 58%, correctly; and the average participant guessed only 38% correctly.
Paul J. saw a clear connection between Treynor’s bean jar experiment, the Academy Awards contest, and how stock markets form consensus views. These early insights fueled Paul J.’s interest in resolving the seeming paradox between the efficient market hypothesis and his personal experience as a sell-side analyst in the stock market.
Paul J. included the Academy Awards contest in his class each spring for the next few years and enlisted Michael Mauboussin (a fellow adjunct professor at Columbia) and Paul Stevens (a colleague of Paul J.’s who taught an investment class at UC Berkeley) to run the same contest in their classes in 1997. The three different classrooms produced similar outcomes, with the consensus easily making the most accurate forecast and beating everyone in the contest. Paul J. wrote a short essay in 19983 to present the results of his annual contest, his theory on how a robust consensus is formed from a group of individuals acting independently, and the implications for market efficiency.
Paul J.’s Academy Awards essay spread around Wall Street over the next few years. Jim Surowiecki, a staff writer for The New Yorker, referenced Paul J.’s Academy Awards contest in his column “The Financial Page,” published in 2001. Surowiecki explained in that essay how the stock market consensus could be swayed by external commentary from the broader media:
Watching CNBC those two days provided a lesson in how pointless such minute-by-minute coverage of the stock market is—how it distorts the way the market works and helps turn what should be a diverse, independent-thinking crowd of investors into a herd acting upon a single collective thought [emphasis added].4
Referencing Paul J.’s contest, Surowiecki observed, “Without fail, the group’s picks . . . were more accurate than those of even the most prescient individual,” adding that it was “more proof that markets outsmart mavens, yes. But there’s something else. Johnson’s students made their decisions independently.” He concluded, “And the collective result of all that independent decision making was near-perfect. This is how markets normally work” [emphasis added].
Surowiecki’s continued interest in the topic eventually led to his writing The Wisdom of Crowds, published in August 2005. Surowiecki coined the term and the title for his book as a play on Charles Mackay’s 1841 book Extraordinary Popular Delusions and the Madness of Crowds.
While Surowiecki’s book brought the wisdom of crowds to the masses, in 1995, more than a decade before Surowiecki’s book was published, Scott Page, an economics professor at the University of Michigan, began working on diversity-based models.5 His research led to his excellent book, The Difference, published in February 2007, which in turn, prompted Michael Mauboussin to write a fantastic primer, “Explaining the Wisdom of Crowds, Applying the Logic of Diversity,”6 published in March 2007.
Looking back, after more than 20 years, we are amazed that what started out as a fun, nonsensical contest among a group of students and their professor was part of broader inquiry into crowd behavior that ultimately generated numerous articles, books, and academic studies, resulting in formal models of the wisdom of crowds that have provided further insight into how the stock market operates. These endeavors reinforce the old saying, “A good idea has many fathers.”
The Wisdom of Crowds Is Critical to Market Efficiency
As we discuss in the previous chapter, when the mechanism governing the three tenets of market efficiency is functioning properly, a stock will be efficiently priced. Why do we care so much about the wisdom of crowds? Because the wisdom of crowds serves as the governing mechanism that implements the three tenets of market efficiency.
We explain later in this chapter that when the wisdom of crowds process is functioning properly:
- Information will be adequately disseminated: market participants will observe, extract, and aggregate information.
- Information will be processed: market participants will evaluate and make estimates without bias.
- Information will be expressed, aggregated, and incorporated into the stock price through trading absent any material impediments.
And, as a result, prices will fully reflect all available information, satisfying Eugene Fama’s definition of market efficiency.
How the Wisdom of Crowds Implements the Rules of Market Efficiency
We expand on the basic tenets of market efficiency in this chapter to demonstrate how the wisdom of crowds implements the rules of market efficiency to produce an efficient stock price. This deeper understanding provides tools to identify circumstances when the basic tenets of market efficiency might malfunction, creating mispricings in the process. It can also flag situations where investors can gain an edge to exploit mispricings created by those temporary errors.
The analyst needs to understand the mechanisms by which the wisdom of crowds operates to be able to recognize patterns of inefficiencies and how those inefficiencies are corrected, which, in turn, will allow him to reliably produce alpha and hold the holy grail of investing.
The Three Main Tenets of the Wisdom of Crowds
We disaggregate the three market efficiency tenets into the following six conditions to show how the wisdom of crowds implements the rules. Keep in mind that with each item below, only a sufficient or threshold number of investors, not all, is required for the condition to hold.
Dissemination
- Information must be available and observed.
Processing
- The group must have an adequate amount of domain-specific knowledge, in the form of facts or expertise.
- The crowd must be diverse.
- Investors must act independently of each other.
Incorporation
- Investors cannot face significant impediments to trading, otherwise estimates of value will not be expressed, aggregated, and incorporated into the stock price.
- Individuals must have incentives to give estimates that they believe are accurate.
When these six conditions are met, the crowd produces an accurate answer and it will be next to impossible for individuals to beat the crowd. We show five of the six7 conditions of the wisdom of crowds process in Figure 6.1.

Figure 6.1 Proper Functioning of the Collective Process Produces an Efficient Price

An old Japanese proverb summarizes the essence of the wisdom of crowds: “None of us is smarter than all of us.” How can the crowd produce an accurate answer when individual members only have partial information or limited knowledge?
Tenet 1—The Dissemination of Information
For the wisdom of crowds to arrive at an accurate estimate, the first condition states that information must be available and observed by a sufficient number of investors. When available information is overlooked, ignored, or not properly disseminated, investors cannot, or do not, use the information in their model, which may result in mispriced stock, as depicted in Figure 6.2.

Figure 6.2 Insufficient Dissemination Results in a Mispriced Stock
This first condition satisfies the first rule of the efficient market hypothesis: all available information is (or has been) disseminated to a sufficient number of investors, as shown in Figure 6.3.

Figure 6.3 First Rule of Market Efficiency Satisfied
Tenet 2—The Processing of Information
For the wisdom of crowds to function properly, a sufficient number of investors must process information without systematic bias, which implies that the crowd is diverse and independent. The second condition requires that a sufficient number of investors in the group have an adequate level of domain-specific knowledge to form the mental model they need to process the information. In other words, if no one in the group has a clue, the wisdom of crowds will not produce an accurate answer.
In his book The Difference, Scott Page uses a simple example to make this point. If 10,000 first graders are asked to guess the weight of a Boeing 747, no one would expect their collective estimate to be close to the aircraft’s actual weight for the simple reason that the children have absolutely no idea, or reference point from which to guess, how much the 747 weighs. The crowd’s guess will not be accurate because none of the children in the crowd has any relevant domain-specific knowledge. In fact, the children might think the 747 is a toy and guess that it weighs only a few pounds!
On the other hand, imagine a group of commercial pilots who fly 747s professionally are asked to guess the plane’s weight, instead of the group of first graders. Because the pilots have deep domain-specific knowledge about 747s, we would expect them to have a general idea as to what the plane weighs. Alternatively, think of a group of aeronautical engineers who might not know the weight of a 747 off the top of their head, but have the expertise to estimate its weight accurately. As we show later in this discussion, members of the crowd do not need to have specific knowledge like the pilots or even relevant expertise like the aeronautical engineers for the crowd to produce an accurate estimate.
Even a crowd composed of adults from different walks of life—such as a doctor, a lawyer, and Indian chief; a tinker, tailor, soldier, and spy; a butcher, baker, and candlestick maker—can produce an accurate estimate. While these individuals do not have the expertise that the pilots or the aeronautical engineers possess, they have domain-specific knowledge about the weight of different objects such as a truck or a cargo ship. Using this knowledge, they might be able to arrive at a reasonable guess as to what a 747 weighs. When all of the guesses of this diverse group are averaged, assuming no systematic bias, this “less knowledgeable” crowd will produce a surprisingly accurate estimate of the weight of a 747.
However, while exact information is not required, if there is not a sufficient number of individuals in the group with the requisite level of domain-specific knowledge, the process will produce a suboptimal answer, like when the first graders attempted to guess how much a 747 weighs, as shown in Figure 6.4.

Figure 6.4 Lack of Domain-Specific Knowledge Within the Collective Results in a Mispriced Stock
The third condition, diversity, requires that a sufficient number of individuals in the crowd have different backgrounds, education, experiences, or analytical approaches, and use different models to process their observations. As we just discussed, a person’s internal mental model is shaped by their domain-specific knowledge, which includes facts they have gathered and expertise they have acquired.
We represent the different mental models as different car models in Figure 6.7. On Wall Street, the different models can include discounted cash flow analysis, technical analysis, astrology,9 macro analysis, and fundamental research, as well as other investment approaches.

Figure 6.7 Diversity of Models Produces an Efficient Price
The crowd’s diversity will be lost if everyone has the same facts and expertise, or starts thinking the same way by using the same mental model. And without diversity, individuals within the crowd produce similar answers to each other, the crowd’s guess will be only a small deviation from the individual estimates, and the crowd’s consensus will reflect nothing more than a single view. Consequently, the crowd’s answer will lack any of the benefits of diversity and will likely result in a mispriced stock.10 We represent the lack of diversity as everyone driving the same model car in Figure 6.8.

Figure 6.8 Lack of Diversity Results in a Mispriced Stock
The fourth condition, independence, requires that a sufficient number of individuals in the crowd act autonomously from each other when determining their estimate. Although specific individuals may be influenced by an external factor or a specific set of information, it is important that only a relatively small number of participants are influenced in the same way by the same external stimuli (which could be another person’s opinion). If too many participants are influenced by the same factor, the crowd’s consensus view collapses to what is essentially a single view or the view of only a few individuals, similar to what happens when a crowd loses its diversity, as described previously. If too many members of the crowd become influenced by the views of others and discount or set aside their own information in reaction to an observation, they are said to be caught in an information cascade, which we discuss in more detail the following chapter.
If the crowd is influenced systematically, it will likely produce an inefficiency in pricing. In the extreme, the collapsing of independence can cause a mania, where everyone believes an overly optimistic view of the situation, or a panic, where the crowd believes a doomsday scenario is likely to unfold. Both examples demonstrate how the lack of independence can feed on itself to produce a significant aberration in a stock’s price. Going back to Murray’s magnet analogy, we see the effect in Figure 6.9.

Figure 6.9 Mayhem Causes a Breakdown of Independence Resulting in a Mispriced Stock
Because diversity and independence are extremely important concepts for understanding the functioning, or potential malfunctioning, of the wisdom of crowds and, in turn, market efficiency, we will further emphasize their difference and interrelation with a simple example.11
Say you wake up one morning, look in the mirror, and see that your nose has turned neon yellow. You make an emergency appointment to see Dr. Ames, an established, well-known ENT specialist at Mount Sinai Hospital on the Upper East Side of Manhattan. She performs a few tests and gives you a diagnosis of malignant neon nose disease, which is not encouraging. The doctor recommends surgery to remove your nose before the infection spreads and your entire body turns neon yellow. She leaves the room and returns 10 minutes later with another doctor in her practice, a young ENT specialist who recently finished his residency, whom she introduces as Dr. Barnes. Dr. Barnes looks at you meekly and says, “I’ve been briefed by Dr. Ames on your case so I thought I’d take a look at your condition.” Dr. Barnes performs a couple of additional tests and declares, “I agree with Dr. Ames, your nose has to go.”
You decide that you should get a second opinion before committing to surgery. You make an appointment with Dr. Conner, a world-renowned ENT specialist at Weill Cornell Medical Center, another high-quality medical institution in New York City. Dr. Conner performs a few tests and gives you the same diagnosis as the two doctors at Mount Sinai—malignant neon nose disease—and also recommends surgery. You ask Dr. Conner if she knows either of the two doctors you consulted previously, to which she replies no.
You decide to call your sister Donna, who is a holistic health counselor, and while you don’t fully believe in alternative medicine, you ask her what she believes has caused your nose to turn neon yellow. She suggests that you see her good friend William Douglas. Douglas is a doctor of acupuncture and Chinese medicine and is well respected by his peers and patients. You make an appointment to see Dr. Douglas later that day at his office near the NYU Medical Center. Using traditional Chinese medicine diagnostic techniques, such as feeling your pulse and examining your tongue, Dr. Douglas concludes that it is highly unlikely that you have malignant neon nose disease. He hands you a bottle that contains capsules of an exotic Chinese herb, instructs you to take two capsules a day, and tells you that you will be fine in a week. You leave dumbfounded. A week later you wake up, look in the mirror, and see that your nose is back to normal.
While you thought you were getting four separate medical opinions, you really received only two because the doctors you consulted were not diverse and independent. We list each doctor, the different tests they performed, the medical school they attended, the hospital where they work, their diagnosis, and their final recommendation in Figure 6.10 to demonstrate the underlying connection between the three medical doctors.

Figure 6.10 Doctors’ Diagnostic Process
Dr. Ames’s recommendation was surgery. Even though Dr. Barnes performed different tests and, unbeknownst to you, had diagnosed benign neon nose, he ignored his own conclusion and instead relied on Dr. Ames’s opinion because of the senior doctor’s more extensive experience. Since Dr. Barnes’s final recommendation was not independent, any diversity gained from the additional tests he performed and the fact that he went to a different medical school was lost. Rather than getting two different recommendations, you received just one because of the doctor’s lack of independence.
The purpose of getting a second opinion is to get a different perspective. To achieve that goal, the new recommendation must be independent and diverse. You assumed that Dr. Conner’s recommendation was independent because he was at a different hospital and had never heard of Doctors Ames and Barnes. Unfortunately, this would be a superficial conclusion. Dr. Conner performed the same tests as Dr. Ames and, also unknown to you, went to the same medical school as Dr. Ames. In fact, Dr. Conner had the same classes in the same year as Dr. Ames, and although they never knew each other while in medical school, the two doctors had identical training and were taught the same diagnostic approach. The domain-specific knowledge that shaped their processing model was identical. Dr. Ames and Dr. Conner’s recommendations were independent, but not diverse, which is why the two doctors gave the same recommendation. They used the same model and processed the same information in the same way. In effect, the diagnosis and recommendation that you received from Dr. Conner were identical to those from Dr. Ames. Since Dr. Barnes’s view was influenced by Dr. Ames’s, and Dr. Conner’s domain-specific knowledge was identical to Dr. Ames, what you thought were three opinions was just one.
On the other hand, Dr. Douglas went to a school that teaches an unconventional approach to medicine. Dr. Douglas was not swayed by any other doctors’ opinions, making his diagnosis both independent and diverse.12
Conditions two, three, and four—adequate domain-specific knowledge, diversity, and independence—satisfy the second rule of market efficiency, as seen in Figure 6.11. The information is processed by a sufficient number of investors without any systematic bias.
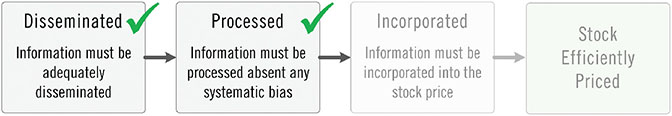
Figure 6.11 Second Rule of Market Efficiency Satisfied
Tenet 3—The Incorporation of Information
Our next two conditions require that estimates and opinions are expressed, aggregated, and incorporated without significant impediments, and that incentives exist, to ensure that the processed information is fully incorporated into the stock price.
If an investor arrives at an estimate but that estimate is not incorporated, the situation will be equivalent to a vote that is not cast. It should be noted that if enough estimates are not incorporated, the private information and domain-specific knowledge contained in an individual’s estimate will not be aggregated with the consensus, which is like the proverbial tree that falls in the woods. If no one is around to hear it, the falling tree does not make a sound. For instance, if someone guessed 12 of 12 correctly in the Academy Awards contest but did not hand in their ballot, their guesses would not be tallied with the results and not incorporated into the consensus view. It would be as if they had never guessed. Also, if there is not a critical mass of people expressing their answers, the crowd will not be a crowd and the consensus view will reflect only the opinions of the small group of individuals who expressed their opinion, which often results in a suboptimal answer. In the case of the stock market, that suboptimal answer often results in a mispriced stock. We show in Figure 6.12 what happens when an individual goes through the process of arriving at an estimate, but is not incorporated because they are unwilling or unable to express their estimate.13

Figure 6.12 Factors Preventing Information from Being Incorporated Results in a Mispriced Stock
The last rule, incentives, is important because individuals will match their effort to the reward offered. For instance, if the prize for guessing the correct number of beans in a jar is $10, then individuals will have less of an incentive to invest time and effort to increase the accuracy of their estimate than if the prize is $10,000. For $10, someone may quickly guess a number because they have only a small incentive to be accurate and win the prize, but for $10,000, the same person will work significantly harder and use much more sophisticated techniques to estimate the correct answer.14 Interestingly, incentives do not have to be monetary; they can be in the form of professional recognition or an enhanced reputation, which can be thought of as psychic income or bragging rights. Negative incentives, if present, will keep individuals from making wild, off-the-cuff guesses because there will be a penalty for being wrong.
The last two conditions satisfy the third rule of the efficient markets hypothesis: That information is incorporated into the market price by a sufficient number of investors through trading.
When all six conditions of the wisdom of crowds are working properly, the result is a wise crowd, which in the stock market results in an efficiently priced stock, one that fully reflects all available information, as shown in Figure 6.13.
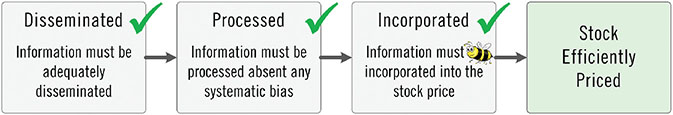
Figure 6.13 Third Rule of Market Efficiency Satisfied
Examples Illustrating How the Wisdom of Crowds Implements the Rules of the Efficient Market Hypothesis
We use several different examples in the remainder of the chapter to explain and highlight the six facets of the wisdom of crowds. We first walk through a simple example of a pen identification contest to show how information from individuals is aggregated, resulting in the crowd being smarter than the individual. Next, we walk through the quintessential wisdom of crowds example—Francis Galton and a 1906 ox-weighing contest—where we discuss the difference between independence and diversity, and explain why these two conditions are important factors for the crowd to arrive at an accurate answer. We also show what happens to the results when we introduce a bias. We then use the Beatles to demonstrate how an accurate answer can emerge from a crowd, even when only a small percentage of the crowd has information relevant to the question asked. Finally, we show how all these factors relate to the stock market.
How the Wisdom of Crowds Aggregates Individual Private Information
We show in the next example how the wisdom of crowds aggregates information to produce accurate answers—answers that are more accurate than any one individual.
Let’s pretend that each year the Fountain Pen Hospital in New York City holds a pen identification contest.15 The goal of the contest is to correctly identify the make and model of 100 different pens from four different manufacturers (25 from each manufacturer). The contestants do not know which four manufacturers the organizers of the contest will choose ahead of time. Teams can have up to four individuals and the winning team gets free pen refills for one year.
When you assemble your team, imagine each member has deep knowledge of one brand of pen. The distributed knowledge is represented in Figure 6.14.

Figure 6.14 Individual Pen Knowledge
When the 100 mystery pens in the contest are unveiled, it turns out that each person on your team has a deep knowledge of one of the four brands picked by the contest organizer.
The combined knowledge allows your team correctly identifies all 100 pens in the contest, while the other team can only identify 50 correctly. Keep in mind that if each member of your group participated alone, they would only know one brand and would only be able to identify 25 of the 100 pens correctly. However, working together they leverage each other’s domain-specific knowledge to produce an accurate guess for all the pens in the contest.
The critical point in this example is that none of the members in your group had the requisite domain-specific knowledge to identify all the pens on his own, although when the four teammates combined their expertise, the group could identify all of them. The example shows that two heads (or in this case four) are better than one.

Figure 6.15 The Collective Is More Knowledgeable Than an Individual
The wisdom of crowds aggregation process generates a “correct” answer by transferring (partial) domain-specific knowledge from individuals to the collective. In this example, the knowledge was dispersed among the four individuals (each having only 25% of the total information), although when aggregated, the collective had 100%16 of the answer.
The Quintessential Wisdom of Crowds Example—Francis Galton
The most popular example of the wisdom of crowds is based on an article written by Sir Francis Galton titled Vox Populi that appeared in Nature magazine’s March 7, 1907, issue. Galton, an accomplished English polymath and statistician, published his analysis of an ox-weighing contest held at the 1906 West of England Fat Stock and Poultry Exhibition in Plymouth, England. Each participant in the contest paid 6 pence17 (US$3.84 adjusted for inflation in 2016 dollars) to enter a guess as to what would be the ox’s weight after being slaughtered. The person with the closest guess won a prize. Galton calculated that the average of the 787 guesses was 1,19718 pounds, which was only 1 pound off the actual weight of 1,198 pounds. Even the 86-year-old Galton was surprised by the accuracy of the consensus and the crowd’s “ability” to estimate the slaughtered ox’s true weight.

While this story has been repeated ad nauseam in just about every book, article, or paper concerning the wisdom of crowds, we felt it important to include it here because the story illustrates certain concepts that are vitally important to the discussion.
Many people incorrectly infer from this story that a crowd can generate an accurate guess to just about any question asked, even if the individuals in the crowd know little about the situation (however, as we discuss with the first graders guessing the weight of a Boeing 747, there must be sufficient domain-specific knowledge in the crowd for it to arrive at an accurate answer). Scott Page understood the fallacy of that assumption and points out in his book, The Difference, that “in 1906 people knew a lot about steers.” He goes on to state, “More likely, each had some primitive model of what a steer weighed. These models led to predictions of the steer’s weight. The predictions were not naive shots in the dark.”19 Karl Pearson in his biography of Galton said, “The judgments were unbiased by passion . . . The six-penny fee deterred practical joking, and the hope of a prize and the joy of competition prompted each competitor to do his best. The competitors included butchers and farmers, some of whom were highly expert in judging the weight of cattle.”20 It is also logical to infer that people attending an event titled the “West of England Fat Stock and Poultry Exhibition” would probably have a lot more interest in and knowledge about steers than the general population. There would likely be a high level of diversity among attendees at the fair, including a wide range of young and old people, each possessing different levels of knowledge and experience. The fairgoers would be comprised of butchers, cattle ranchers, cattle auctioneers, produce farmers, veterinarians, horse trainers, pig farmers, cooks, and other consumers. This example underscores the importance of domain-specific knowledge and incentives.
It should also be noted that there were 800 tickets sold, although, as Galton wrote in his article, “After weeding thirteen cards out of the collection as being defective or illegible, there remained 787 for discussion.” This observation highlights a subtle although important point. If an estimate is made by an individual but is not incorporated, it adds nothing to the collective answer—it is as though the guess never existed. This point highlights the importance of an estimate being expressed and included in the aggregation mechanism to be properly incorporated.
Using the rudimentary process model in Figure 6.16 to represent how an individual would make a guess in an ox-weighing contest shows that she would first collect data by simply observing the ox. She would process this information to determine how much she believes the ox weighs (drawing from her domain-specific knowledge, which includes facts of what different items weigh)21 and then express her opinion by writing it on a ticket and handing it in.

Figure 6.16 Individual Decision Process Applied to the Ox-Weighing Contest
As we mention previously, for the wisdom of crowds to arrive at an accurate answer, the individuals in the crowd must be diverse in their approaches and independent from each other in their analysis and conclusions. To dive deeper into the importance of diversity and independence, we introduce the potentially intimidating diversity prediction theorem, presented in Figure 6.17. The theorem, first introduced by Scott Page in 2007, offers important insight into how crowds produce accurate predictions, such as in the ox-weighing contest.

Figure 6.17 Scott Page’s Diversity Prediction Theorem

The theorem holds that crowd error (the accuracy of the crowd’s prediction) is a function of average individual error (the accuracy of the average individual) and diversity (the diversity of the crowd’s predictions). Another way to think about this concept is that individual error is offset by diversity, resulting in a low crowd error.
The formula is not nearly as scary as it first appears.22 The first term, to the left of the equal sign, represents the crowd’s error and measures the difference between the crowd’s prediction and the actual value. In the ox-weighing contest, for example, the crowd’s prediction was 1,197 pounds and the actual weight was 1,198 pounds, producing a crowd error of only 1 pound.
The second term, just to the right of the equal sign, represents the average individual error and measures how far each individual guess is from the true value. In the ox-weighing contest, each person was, on average, approximately 74 pounds away from the true value of 1,198 pounds. This term captures the crowd’s independence.
The third term represents diversity and measures how far each individual’s prediction was, on average, from the crowd’s prediction. This term captures the differences in domain-specific knowledge of individuals within the crowd. Again, these differences include different levels of facts and expertise.
The formula shows that diversity offsets the average individual error, which reduces the crowd error. For instance, diversity reduced the average individual error significantly in Galton’s experiment, resulting in a crowd’s error of only 1 pound, as shown in the following analysis:

As the calculation shows, the crowd’s error was surprisingly low, at just 1 pound, despite a relatively high average individual error of approximately 74 pounds, because the group’s individual guesses were diverse. We present these results graphically in Figure 6.18, which shows each individual’s error, the average individual error, and the crowd error. The gray area in the chart represents the reduction in the average individual error resulting from the crowd’s diversity.

Figure 6.18 Ox-Weighing Contest: Diversity Reduces Error
Challenges like guessing the weight of an ox are difficult for individuals to estimate and, as a result, have a high level of average individual error. The crowd’s composition plays a critical role in determining the accuracy of the collective estimate in these situations because without diversity, the crowd’s prediction will reflect the high average individual error. In other words, without diversity, all individual guesses will be similar and, most likely, wrong. At the risk of being repetitive, the crowd error in the ox-weighing contest would have equaled the individual error of 74 pounds without diversity. However, because the crowd was diverse, the large individual errors were offset by their wide range (above and below the actual answer), resulting in a low crowd error.
If, on the other hand, a problem is easy to estimate accurately, then the individual guesses will be close to the actual answer and the average individual error will be low. The crowd’s diversity also will be low, but not a factor in these situations because all the individual guesses will be similar and accurate, resulting in a low crowd error.
To demonstrate this point further, let’s say that it was easy to estimate the ox’s weight and assume that the individual guesses were off from the actual weight by no more than ±1%. The crowd error would be zero, in this case, as it would equal the ox’s actual weight of 1,198 pounds. The average individual error would be small at just 7 pounds (in contrast to approximately 74 pounds in the actual contest). Diversity reduced the average individual error in the easy-to-estimate scenario by only a small aggregate amount.23

We show graphically in Figure 6.19 that there is not much of a difference between the crowd’s error and the average individual error in this example when we plot the results using the same scale as we used in Figure 6.18.

Figure 6.19 Ox-Weighing Contest: Smaller Benefit of Diversity When Estimating is Easy
What happens if we introduce a bias and put strain on the second condition, independence? Let’s pretend that there had been a well-known steer-weighing expert (a “steer seer”) at the West of England Fat Stock and Poultry Exhibition who announced to the crowd, “I think that steer weighs 1,400 pounds, so that will be my guess.” Although the steer seer’s estimate is incorrect, his proclamation would introduce a bias if it influences at least some of the individual guesses, thereby reducing the crowd’s independence and increasing its error, as we show in the following example.
Let’s assume in this scenario that individuals listen to the steer seer and believe that he may have a more accurate guess than their own. Instead of completely ignoring their original estimate, each individual decides to average their guess with the seer’s prediction,24 as sort of a hedge. As a result, the crowd’s prediction increases to 1,298 pounds. The crowd’s error now overestimates the ox’s actual weight by approximately 100 pounds, which makes sense since the seer’s stated estimate was roughly 200 pounds higher than the correct answer, and the average individual error increases from 74 pounds to 106 pounds.

Diversity narrowed the difference between the average individual error and the crowd error significantly in the original contest. Contrast this result to Figure 6.20, which shows that diversity cannot compensate for the increased individual errors caused by the steer seer’s prognostication, which introduced a bias and reduced the crowd’s independence.

Figure 6.20 Ox-Weighing Contest: Steer Seer Introduces Bias and Misleads the Crowd
The Crowd Arrives at an Accurate Answer Even When Individuals Have Limited Factual Knowledge
The second condition of the three market efficiency tenets states that there must be a sufficient number of individuals in the group who have the requisite level domain-specific knowledge, either in the form of facts or expertise. It probably seems counterintuitive, but it is possible for the crowd to arrive at an accurate answer even if most of the crowd has no factual knowledge about the situation. What is required is that some individuals within the crowd have some factual knowledge, even if it is only partial knowledge. As we demonstrate in the pen example, when individuals with only partial information are aggregated together, they can produce accurate answers. Not one person had all the information in that example, yet the crowd produced a highly accurate aggregate answer.
We show in the next example that the crowd can have a majority of clueless individuals, a few individuals with some factual knowledge, no individuals with all the factual knowledge, and still produce an accurate answer. The example also demonstrates that as individuals with more information are added to the crowd, the aggregate answer gets even more accurate.
We borrow an example from Scott Page’s book to illustrate this facet of the wisdom of crowds, although we modify the story a bit. Page uses the Monkees, an American rock band from the late 1960s, to illustrate this point in his book, while we use the Beatles. In this example, we ask 800 people, “Who on the following list was not a member of the Beatles?”25
- Ringo Starr
- Paul McCartney
- Clarence Walker
- George Harrison
- John Lennon
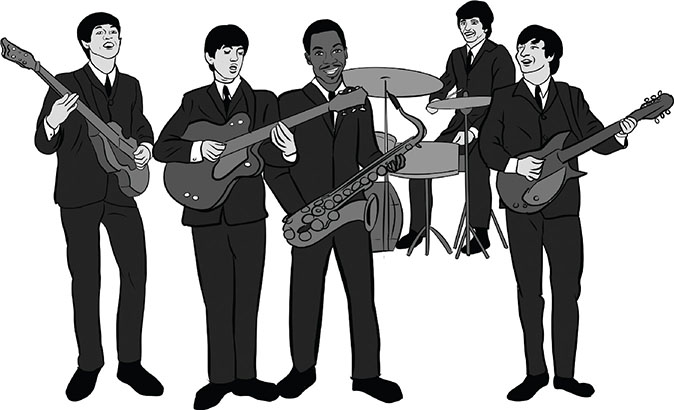
For anyone raised on the Beatles’ music,26 this is an easy, and perhaps trivial, question. In this example, the participants in the survey have different levels of knowledge about the Beatles. A few of them know a lot about the band and can answer the question easily and quickly, some recognize a band member or two but do not know the correct answer, and 75% of the participants have never heard of the band and will basically have to guess the impostor blindly (which we assume they do randomly). Intuitively, it probably seems unlikely that we would get much wisdom from a crowd where most of the people have little or no idea who the Beatles are.
The participants’ knowledge of the Beatles breaks down as follows:
- 2.5%, or 20 people, know all four Beatles
- 5.0%, or 40 people, know three of the four Beatles
- 7.5%, or 60 people, know two of the four Beatles
- 10%, or 80 people, know one Beatle
- 75%, or 600 people, have no idea who was in the band
We use this example to show how the correct answer emerges from the crowd and at the same time show how little knowledge is required for the crowd to get the right answer.
Let us assume for the moment that of the first 600 people we surveyed, not one of them had heard of the Beatles. Like the first graders having no clue about the weight of a 747, the participants in the survey cannot determine the correct answer because they simply do not know it. Let us further assume that their pick of the non-Beatle from the five possible choices is random. In this case, each of the five possible band members on the list would get the same number of guesses (120) and no consensus would emerge from the first 600 participants, as shown in Figure 6.21.

Figure 6.21 Beatles: Tally for First Group
We must emphasize that randomness is critical for the process to work properly. We show with the example of the neon nose and the steer seer that independence is critically important, and any bias will result in an incorrect answer. We assume that since individuals in this group have never heard of the Beatles they will simply pick randomly, as if they each rolled a five-sided die.27 For instance, the rule could be that if one comes up on the die, they pick Ringo, if two comes up they pick Paul, and so on. The probability of any individual number on the die coming up is 20%; therefore, if the crowd picks randomly, then each band member on the list will receive 120 votes.

Let’s assume that the next 80 people we ask coincidentally each know just one of the four Beatles. Because they know one of the band members, they can eliminate that person from the list, leaving four names from which to choose. For example, let’s say that the first person we ask knows that Ringo is a Beatle but does not know who the non-Beatle is among the remaining four names. Let’s assume he acts independently and picks randomly from the remaining four choices (like rolling a four-sided die28), and identifies George incorrectly as the non-Beatle, as shown in Figure 6.23.

The second person might know Paul is in the band, but none of the other three Beatles, so he picks randomly from the remaining four choices. In this case, let’s assume that he correctly chooses Clarence as the non-Beatle, as shown in Figure 6.24.
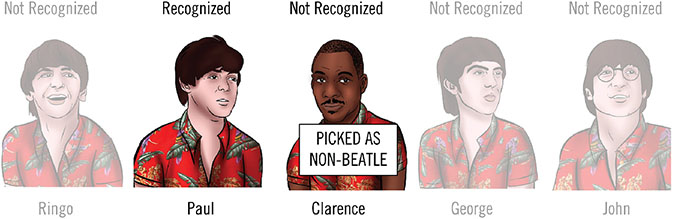
Figure 6.24 Beatles: Random and Right
Assuming the group is independent, this process would continue for the remaining 78 people in the group who each know one of the actual Beatles. At the end of that round, the 80 people will have identified Clarence most often as the non-Beatle, although by only a slim margin. He will receive 140 of the guesses, or 20.6% of the total, versus the other four names each getting 135 of the guesses, or 19.9% of the total, as shown in Figure 6.25.

Figure 6.25 Beatles: Tally for First Two Groups
Let’s now assume that the next 60 people we ask each know two of the four Beatles, which means that they can eliminate the two band members they know, leaving three names to choose from. Let’s say that the first person we ask knows Ringo and Paul are both in the band, but does not know who the impostor is among the remaining three names. He acts independently and picks randomly from the remaining three choices (like rolling a three-sided die29), and identifies John incorrectly as the non-Beatle, as shown in Figure 6.26.

Figure 6.26 Beatles: Random and Wrong
The second person from this group knows Paul and George are both in the band, but he cannot name the non-band member from the remaining three possible choices. He also acts independently and picks randomly from the remaining three names, and incorrectly chooses Ringo as the non-Beatle, as shown in Figure 6.27.

Figure 6.27 Beatles: Random and Wrong
This process would continue for the remaining 58 people in the group. Assuming each participant is also independent, this group will identify Clarence as the non-Beatle by a slightly higher margin than the prior group, receiving 160 of the guesses, or 21.6% of the total, versus the other four possible band members, who each receive 145 guesses, or 19.6% of the total, as shown in Figure 6.28.

Figure 6.28 Beatles: Tally for First Three Groups
Let us assume that the next 40 people we ask each know three of the four Beatles, which allows them to eliminate three of the five choices and leaves them with two names to choose from. The first person we ask knows Ringo, George, and Paul are in the band but does not know who the impostor is of the remaining two names. Assuming that person acts independently and picks randomly from the remaining two choices (by flipping a fair coin), he might identify John incorrectly as the non-Beatle, as shown in Figure 6.29.


Figure 6.29 Beatles: Random and Wrong
The second person from this group might also know that Ringo, George, and Paul are in the group but does not know who the impostor is of the remaining two possible band members. Assuming this person acts independently and picks randomly from the remaining two choices, he might correctly identify Clarence as the non-Beatle, as shown in Figure 6.30.

Figure 6.30 Beatles: Random and Right
Assuming this group is independent, the process would continue for the remaining 38 people. At the end of the round, this group will have identified Clarence as the non-Beatle by an even higher margin than the prior groups, getting 180 of the guesses, or 23.1% of the total, versus the other four possible band members, who each get 150 guesses, or 19.2% of the total, as shown in Figure 6.31.

Figure 6.31 Beatles: Tally for First Four Groups
Assuming that the remaining 20 people we ask each know all four Beatles, they will all correctly identify Clarence as the non-Beatle, adding 20 guesses to his total. At the end of this round, Clarence will be identified correctly by the entire group of participants as the non-Beatle, receiving a total of 200, or 25%, of the 800 guesses versus the other four potential band members each getting 150 guesses, or 18.8% of the total, as shown in Figure 6.32.

Figure 6.32 Beatles: Tally for All Five Groups
To recap, when asked, the crowd of 800 people voted as follows:
- The 20 highly knowledgeable people who know all the Beatles selected Clarence as the non-Beatle.
- Of the 40 people who know three of the four Beatles, 20 (50%) selected Clarence as the non-Beatle.
- Of the 60 people who know two of the four Beatles, 20 (33%) selected Clarence as the non-Beatle.
- Of the 80 people who know one Beatle, 20 (25%) selected Clarence as the non-Beatle.
- Of the 600 people who do not know any of the actual band members, 120 (20%) selected Clarence as the non-Beatle.
Figure 6.3330 depicts graphically how the percentage of correct answers emerges and the errors decline as we add groups of people with increasing amounts of knowledge to the results. No clear consensus emerges when people have no clue about the correct answer, as the first example shows. Because the individuals guess randomly, each potential band member receives 20% of the guesses. However, as we demonstrate with the subsequent examples, the correct answer emerges quickly as the number of knowledgeable people and their level of knowledge increases, which the charts show clearly.

Figure 6.33 Beatles: Correct Answer Emerges from the Crowd
As we demonstrate, the crowd correctly identifies Clarence Walker as the non-Beatle even though most the participants (75% of the total) do not know anything about the band. This example shows that we do not need many participants with knowledge for the crowd to arrive at the correct answer. While it may seem incredible, in fact no one in the crowd needs to have complete knowledge for the crowd to make the correct identification, as shown in Figure 6.31, where not a single person knows all four Beatles, yet Clarence is still outed by a margin of 180 guesses versus the 150 guesses for each of the other band members. However, if no one has any knowledge, there is no wisdom to be extracted from the crowd, as shown in Figure 6.21, where no determination was made. The Beatles experiment demonstrates the fourth condition of the market efficiency tenets, that there must be a sufficient number of individuals in the group who have the requisite level domain-specific knowledge—in the form of either facts or expertise—for the crowd to be wise.
How the Crowd Becomes Skewed
We can modify the Beatles story to demonstrate what happens if there is a breakdown in independence within the crowd, similar to the example with the steer seer in Galton’s ox-guessing contest. To break the independence and induce a bias, we show the participants the fake album cover (the lost Beatles, Aloha from Hawaii album) before we ask them to pick the non–band member. We then ask the original question, “Which individual from the following list was not a member of the Beatles?”

Although the 20 people who know all four Beatles (and probably know the Beatles never recorded a Hawaiian album) will be amused by the fake cover, they will not be influenced by it and will correctly identify Clarence as the non-Beatle, as they did before.
Let’s say that the remaining 780 people we asked are swayed by the fake cover and believe that since Clarence is sitting in the center of the picture, that not only is he a true Beatle, but is also the most prominent member of the band.
Let’s assume that when we survey the group of 600 people who have never heard of the Beatles, they all believe Clarence is a real Beatle because of the bias and eliminate him as a choice. If there is no other bias, they will then pick randomly from the remaining four choices, although all their picks will be wrong, as shown in Figure 6.34.

Figure 6.34 Beatles: Biased and Wrong
When we poll the group of 80 people who know one of four Beatles, they also eliminate Clarence from consideration because of the bias we introduced, along with the Beatle they know is correct, and choose randomly from the remaining three possible band members. Their pick will also be wrong if there is no other bias, as shown in Figure 6.35.

Figure 6.35 Beatles: Biased and Wrong
The same mistake happens with the 60 people in the group who know two of four and the 40 people in the group who know three of four. They all pick incorrectly.
Figure 6.36 shows that the four real Beatles will be identified as a non-Beatle by 780 people who were influenced by the fake cover, while Clarence, the real non-Beatle, will get only the 20 votes from the small group who know all four of the real band members. Although this example is overly simplistic, it demonstrates how breaking independence by introducing a bias can turn the wise crowd into a dumb one.

Figure 6.36 Beatles: Biased Answer Produces Wrong Crowd Guess
Similarly, normal human emotions can introduce biases that may pollute diversity and independence in the stock market and gum up the works of the wisdom of crowds. These biases can undermine the efficient market hypothesis, thus creating distortions and potentially mispriced stocks. These distortions are problematic for some but create opportunities for others. We discuss this in much greater detail in the next chapter.
The Wisdom of Crowds Applied to the Stock Market
As we discuss earlier in this chapter, the efficient market hypothesis lays out the rules the markets must follow to ensure an efficient market price, while we show that the wisdom of crowds is the governing mechanism by which those rules are implemented.
To demonstrate the power of the wisdom of crowds applied to the stock market, we present an example that shows how a crowd of individuals predicted Apple’s 2015 fourth-quarter earnings more accurately than a group of experienced sell side analysts.
As we state throughout the book, the estimated intrinsic value of any asset is the sum of the cash flows expected to be produced by that asset, over its useful life, discounted for the time value of money and the uncertainty of receiving those cash flows. Since Apple’s reported earnings are a reasonable proxy for the company’s cash flow, we can use this number in the following example.
The Crowd Is Smarter Than the Experts Most of the Time
To illustrate how the wisdom of crowds arrives at an accurate earnings estimate, we use a unique data set provided by Estimize.com, a company founded by Leigh Drogen, that aggregates quarterly earnings estimates from individuals. The Estimize website attracts a broad spectrum of participants, including Wall Street professionals (analysts and portfolio managers), students, academics, industry professionals, and various other interested parties. Estimize uses an aggregation mechanism similar to Galton’s in that they simply tally up the guesses and calculate the average of all the individual estimates.
The average earnings estimate for Apple from the 1,183 individual estimates on the Estimize website for the quarter ending September 2015 was $1.91 per share.31 By comparison, the Wall Street consensus estimate of 42 sell-side analysts for the same period was $1.88.32
Apple’s reported earnings for the quarter was $1.96. The Estimize prediction of $1.91 was off by only $0.05, while the average of the 42 professional sell side analysts was off by almost twice as much at $0.08 per share. The crowd was clearly more accurate than the experts in this instance. We show the range of estimates for Estimize and for the Wall Street analysts, graphed against the actual results, in Figure 6.37.

Figure 6.37 Apple: Range of Q4 Earnings Predictions
We should emphasize that this example is not a one-off result. In fact, as we discuss throughout this chapter, the wisdom of crowds process beats experts most of the time, which is supported by academic research showing that the earnings estimates produced by the Estimize collective are more accurate than Wall Street analysts 74% of the time.33
The Apple example also demonstrates how diversity produces a more accurate result. If we run the Estimize estimates for Apple through Scott Page’s diversity prediction theorem, the crowd error equals $0.05, which is the difference between the crowd’s prediction of $1.91 and the actual earnings of $1.96. The crowd’s average individual error (which measures how far the average individual is off from the actual earnings) is $0.09, implying that diversity (how far away the average individual was from the crowd) improved the crowd estimate by $0.04.

We show these results in Figure 6.38, where we graph each individual’s error, the average individual error, and the crowd error. The gray area represents the reduction in error derived from the crowd’s diversity.

Figure 6.38 Apple: Diversity Reduces Crowd Error
To demonstrate diversity within the crowd, we present details on the estimates submitted on Estimize.com, sorted by the types of individuals making the estimates, in Table 6.3. The individual categories include academics, financial professionals, students, and nonprofessionals, with the remaining participants placed in a category labeled “unknown.” Estimize also collected data for the 42 sell-side analysts who published earnings estimates for that quarter. The results (which are sorted by declining crowd error) are surprising.
Table 6.3 Apple: Earnings Estimates by Subgroup
 |
What is most striking to us is that the Wall Street sell-side analysts produced the highest crowd error at $0.080 ($1.96 actual earnings versus $1.88 average estimate). Their average individual error was $0.094, which means that diversity counteracted the average individual error by only $0.014, or 15%, implying that the group was not particularly diverse. The fact that 42 Wall Street analysts are not that diverse should not be surprising. Analysts have little incentive to be far away from their consensus34 and, because they have much greater access to company management than individual investors, their estimates are probably skewed by management’s guidance, which is a form of bias similar to what we discuss in the ox-weighing contest. Also, remember that they are sell side analysts, so they are selling more than researching. Finally, because they all receive the same story from the company’s management and do not have a lot of time to do additional research, it should not shock anyone that the individual analysts produce estimates similar to each other and, almost by definition, the group is not all that diverse.
The subgroup labeled “financial professionals” is probably the most interesting. This subgroup, which includes professional analysts and portfolio managers, had the highest average individual error at $0.104, which is what we would expect from a complex problem that is difficult to estimate accurately. However, their crowd error was only $0.047, meaning that diversity offset the individual error by $0.057, or 55%, which was the greatest benefit from diversity realized by any of the subgroups. This result might seem counterintuitive at first glance. We would not expect this group to be diverse since we would assume that they would all talk to each other, read the same periodicals, and research reports, and, in turn, produce similar estimates.
It is important to remember that these are professional investors who have taken the time to enter their estimates on Estimize.com, and therefore, are most likely calculating earnings estimates on their own. If they were simply relying on Wall Street research as the primary source for their estimates, they likely would not bother entering them on the website. These analysts are probably independent, competitive, and have incentives to be right. Some of them are likely submitting their estimates for the psychic income of being right; therefore, they will work harder, do more research, and think independently. When we think about this group in that light, their results are not all that surprising.
The Apple example not only shows that the crowd beat the experts, but also shows that when a group is homogeneous and lacks independence, such as the Wall Street analysts, it produces estimates with high individual errors and, because of the group’s lack of diversity, also produces a high crowd error. In contrast, a diverse and independent group, such as the financial professionals, has high individual errors, but its crowd error will be low because of the group’s diversity.
What happens to the consensus results if we introduce a bias and put a strain on the crowd’s independence?
How the Crowd Can be Fooled
Apple released its fourth-quarter earnings, for the period ending September 30, 2015, on October 27, 2015. Samsung, one of Apple’s most fierce competitors, announced earnings guidance for its fiscal third quarter, ending September 30, 2015, on October 7, 2015.
We are now going to create a fake story. Let’s assume that Samsung indicated in its release that its revenue for the quarter was going to be materially lower than expected because of slowing smartphone sales and that management expected earnings per share for the September quarter to be 10% less than current consensus estimate.
It is safe to assume that investors in Apple stock monitor news on Samsung to glean insights into the smartphone market (Samsung was the largest producer of smartphones at the time). Let’s say that the individuals on Estimize are influenced by the Samsung news, although they reduce their earnings estimate by only 5%, rather than Samsung’s 10% shortfall. The crowd’s estimate on Estimize would fall from $1.91 to $1.82 as a result. The Samsung news in this example is like the bias we introduced with the steer seer in the 1906 West of England ox-guessing contest.
The average individual error would increase from $0.09 to $0.16, because of the bias, and the crowd would underestimate Apple’s quarterly earnings by $0.14 rather than by $0.05 in the original example. Diversity narrowed the difference between the average individual error and the crowd error significantly in the prior Apple example. Contrast this outcome with the biased results, where diversity reduces the individual error by only $0.02, as shown in the following equation:
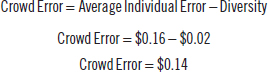
Figure 6.39 shows that diversity cannot compensate for the increased individual errors caused when a strong bias is introduced.

Figure 6.39 Apple: Biased Estimates Affect Diversity
Gems
- When the wisdom of crowds process is functioning properly:
- Information will be adequately disseminated. Market participants will observe, extract, and aggregate information
- Information will be processed. Market participants will evaluate and estimate without bias
- Information will be expressed and incorporated into the stock price through trading
- An investor seeks to create an informational advantage by combining public and quasi-public information with nonmaterial, nonpublic information. The investor then applies his analytical process to all information he possesses to arrive at a conclusion that is material and nonpublic, which, in most cases, is legal.
- To produce an efficient stock price, information must be available and observed; the information must be processed by a diverse set of models backed by sufficient knowledge to produce estimates that are independent (without bias); and the estimates need to be expressed with no limits on trading. A stock price may become mispriced (only) if there is a failure in any of these areas.
- The crowd’s diversity will be lost if everyone has the same facts and expertise or starts thinking the same way by using the same mental model. And, without diversity, individuals within the crowd produce answers similar to each other, the crowd’s guess will be only a small deviation from the individual estimates, and the crowd’s consensus will reflect nothing more than a single view. Consequentially, the crowd’s answer will lack any of the benefits of diversity and will likely result in an inefficiently priced stock.
- If the crowd is influenced systematically, it will produce an inefficiently priced stock. In the extreme, the collapsing of independence can cause a mania, where everyone believes an overly optimistic view of the situation, or a panic, where the crowd believes a doomsday scenario is likely to unfold. Both examples demonstrate how the lack of independence can feed on itself to produce a significant mispricing.
- If an investor arrives at an estimate, but that estimate is not expressed, the situation will be equivalent to a vote that is not cast. It should be noted that if enough estimates are not expressed, the private information and domain-specific knowledge contained in an individual’s estimate will not be aggregated with the consensus, which is like the proverbial tree that falls in the woods. If no one is around to hear it, the tree’s falling sound will not be noticed.
- The wisdom of crowds aggregation process generates a “correct” answer by transferring (partial) domain-specific knowledge from individuals to the collective.
- It probably seems counterintuitive, but it is possible for the crowd to arrive at an accurate answer even if most the crowd has no factual knowledge about the situation. What is required is that some individuals within the crowd have some factual knowledge, even if it is only partial knowledge.