
![]()
The ability to view HTTP traffic, which consists of the request message sent by the client and the response message sent by the server in response to the request, is a fundamental requirement for developing HTTP services. Equally important is the ability to hand-craft requests, submit them to ASP.NET Web API, and view the corresponding response from ASP.NET Web API. Fiddler is a great tool that helps you in both these needs. As you’ll see, web browsers also come with built-in tools to capture and inspect the HTTP traffic.
Another key aspect of debugging ASP.NET Web API is tracing. ASP.NET Web API supports tracing of your code as well as of the framework code. Tracing the framework code is essential for understanding what goes on behind the scenes as ASP.NET Web API handles a request, calls your code at the right moment, and sends back a response.
2.1 Using Fiddler for Web Debugging
Fiddler is a web debugging proxy. It is a useful tool for capturing and analyzing both HTTP and HTTPS traffic between the computer running Fiddler and the outside. Fiddler also has a feature to build a complete request with headers, send it to an HTTP endpoint such as the web API, and inspect the response returned by the web API. It is virtually impossible to develop a production-grade web API without using a debugger like Fiddler. You can get Fiddler from http://www.fiddler2.com/get-fiddler. Fiddler lists the requests captured in the pane on the left (see Figure 2-1).
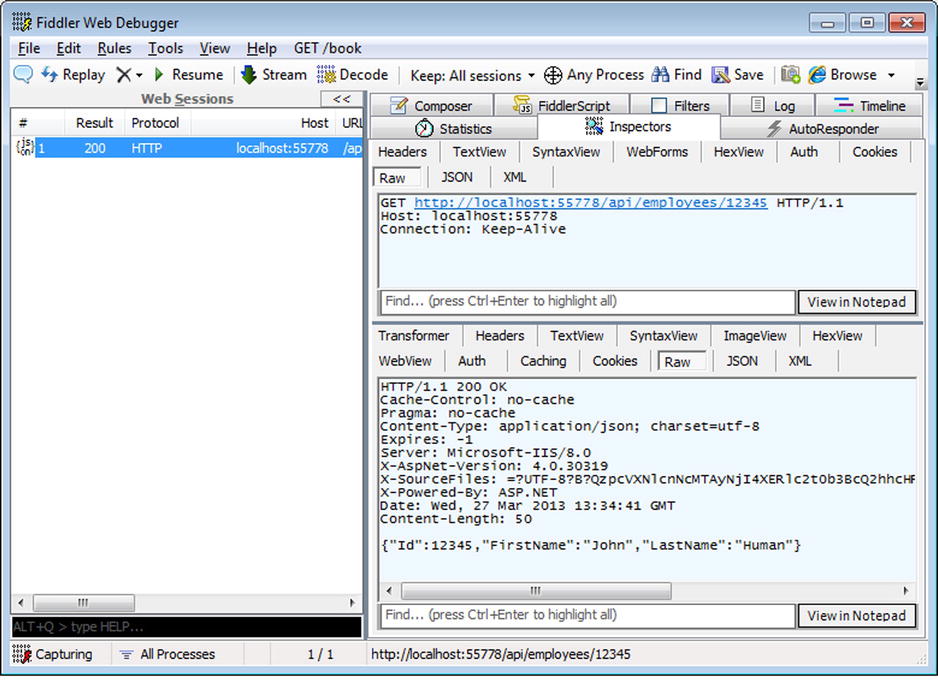
Figure 2-1. Fiddler Capture
When a specific request is selected, the Inspectors tab on the right pane shows the request on the top and the corresponding response on the bottom. The Composer tab allows the requests to be hand-crafted and submitted with the HTTP method of your choice.
The older versions of Fiddler do not capture the traffic from the localhost. Common workarounds are to use the identifier localhost with a dot suffix followed by fiddler (http://localhost.fiddler:<port>), use the machine name instead of localhost, add an entry to the C:WindowsSystem32driversetchosts file for 127.0.0.1, and use that. The following list details how Fiddler can be configured to capture the traffic with different types of applications.
- Internet Explorer: When the Fiddler tool is launched, it registers itself as the system proxy. For this reason, requests from the applications that use WinInet such as Internet Explorer are automatically intercepted by Fiddler. No setting or configuration changes are needed.
- Other browsers like Firefox: Fiddler can be configured as the web proxy with the browser to start intercepting the requests. Fiddler runs on port 8888, so the proxy can be configured as localhost:8888 or 127.0.0.1:8888.
- Non-browser applications such as a .NET Framework WPF application: Typically, these applications use the WebClient for HTTP communication. The Proxy property of the WebClient must be set to an instance of the WebProxy with the host as localhost and port as 8888 like this:
- ASP.NET web application: If you need to look at the HTTP client requests made by your code in an ASP.NET application, or by a third-party library you are using in your ASP.NET application, it is possible to configure Fiddler as the proxy in the web.config file, as shown in Listing 2-1.
Listing 2-1. Web.config Configuring Fiddler as Proxy
<configuration>
        <system.net>
            <defaultProxy>
                  <proxy usesystemdefault="False" bypassonlocal="True"
                                      proxyaddress=" http://127.0.0.1:8888 " />
            </defaultProxy>
        </system.net>
</configuration>
2.2 Capturing Console App Traffic through Fiddler
In this exercise, you will create a simple console application that uses the WebClient class to talk to the ASP.NET Web API that was created in Exercise 1.2. You will configure Fiddler as the proxy so that the request generated by the console app and the response sent by ASP.NET Web API are available for us to analyze.
- Download Fiddler and install it, if you have not already done so.
- Create a console application with a name of TestConsoleApp and add the code from Listing 2-2. Add a using directive to the top of the Program class, like so:
using System.Net;Listing 2-2. A Console Client Application
using System.Net;

class Program
{
    static void Main(string[] args)
    {
        string uri = " http://localhost.fiddler:55778/api/employees/12345 ";

        using (WebClient client = new WebClient())
        {
            client.DownloadString(uri);
        }
    }
} - Notice that the URI used is http://localhost.fiddler:55778/api/employees/12345. Fiddler does not capture the traffic on localhost, especially when your client is making the HTTP requests using System.Net (as is the case with WebClient). Remember to replace the port 55778 specified in the example code with the actual port the application you created in Exercise 1.2 runs on.
- Launch Fiddler and make sure it captures the traffic from all processes by clicking the status bar next to Capturing and selecting All Processes. See Figure 2-2.
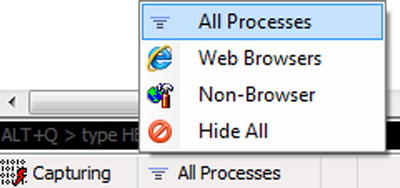
Figure 2-2. Fiddler capturing all processes
- Open the project corresponding to Exercise 1.2 in Visual Studio. Open the EmployeesController class and make sure the class is same as shown in Listing 1-4 and Listing 1-5. The code is reproduced in the following listing for your easy reference.
public class EmployeesController : ApiController
{
    private static IList<Employee> list = new List<Employee>()
    {
        new Employee()
        {
            Id = 12345, FirstName = "John", LastName = "Human"
        },

        new Employee()
        {
            Id = 12346, FirstName = "Jane", LastName = "Public"
        },

        new Employee()
        {
            Id = 12347, FirstName = "Joseph", LastName = "Law"
        }
    };

    // GET api/employees
    public IEnumerable<Employee> Get()
    {
        return list;
    }

    // GET api/employees/12345
    public Employee Get(int id)
    {
        return list.First(e => e.Id == id);
    }

    // POST api/employees
    public void Post(Employee employee)
    {
        int maxId = list.Max(e => e.Id);
        employee.Id = maxId + 1;

        list.Add(employee);
    }

    // PUT api/employees/12345
    public void Put(int id, Employee employee)
    {
        int index = list.ToList().FindIndex(e => e.Id == id);
        list[index] = employee;
    }

    // DELETE api/employees/12345
    public void Delete(int id)
    {
        Employee employee = Get(id);
        list.Remove(employee);
    }
} - Press F5 in Visual Studio and let the project corresponding to Exercise 1.2 run. This will ensure that IIS Express is running.
- Run the console application.
- Go to Fiddler and select the session captured in the left pane. Go to the Inspectors tab on the right to look at the raw request and response.
2.3 Capturing HTTPS Traffic in Fiddler
Fiddler can capture and even decrypt HTTPS traffic. Fiddler acts as a man-in-the-middle and generates certificates on the fly to decrypt HTTPS traffic.
- To enable Fiddler to capture HTTPS traffic, select Tools ➤ Fiddler Options and select the Decrypt HTTPS traffic check box as shown in Figure 2-3.
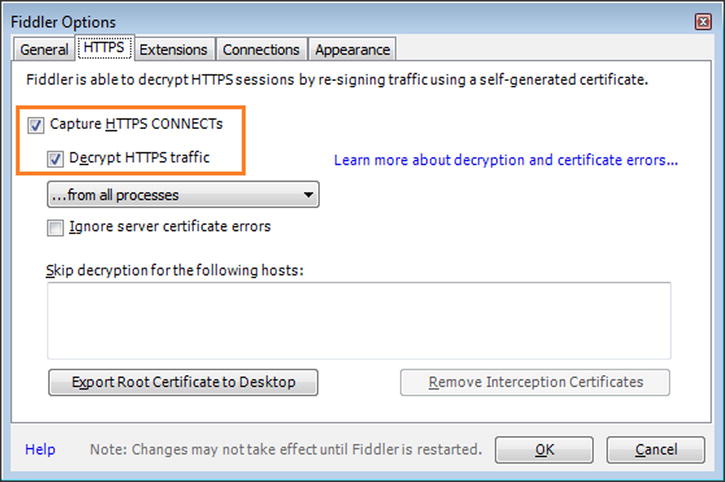
Figure 2-3. Fiddler options
- When you select the Decrypt HTTP traffic check box, Fiddler asks you whether to add the root certificate it generates to the trusted CA list in your machine.
- Select No and click OK. Fiddler is now all set to capture and decrypt HTTPS traffic.
- To see Fiddler in action capturing the HTTPS traffic, go to https://www.google.com in Internet Explorer, with Fiddler running.
- As part of the capture, Fiddler sends the public key of a certificate it has just generated to Internet Explorer, as if it is the certificate from www.google.com.
- Internet Explorer promptly displays the message “There is a problem with this website’s security certificate.”
- Go to the site without heeding Internet Explorer’s warning. Internet Explorer displays the page.
- Now go to Fiddler. You can see the traffic it has captured in all clear text, although sent over HTTPS.
- Internet Explorer does show the URL bar in red, since it suspects some foul play with the certificate it received. If you look at the certificate error, it shows that the certificate is issued to www.google.com, but it was issued by DO_NOT_TRUST_Fiddler_Root, which is not a CA that Internet Explorer trusts (see Figure 2-4). This is how a browser alerts an end user about a man-in-the-middle attack, if someone tries to eavesdrop by tampering with the certificate in HTTPS.
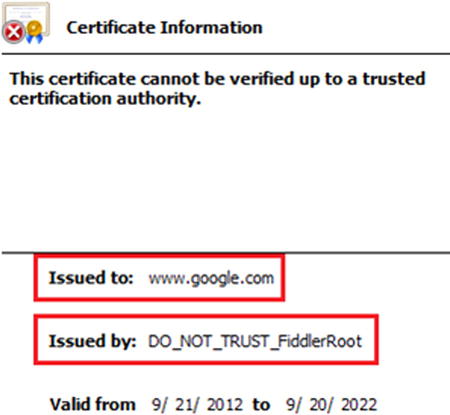
Figure 2-4. Certificate error
2.4 Composing and Submitting Requests in Fiddler
In this exercise, you will hand-craft an HTTP request and submit it to an ASP.NET Web API. In Exercise 1.2, we created a web API that supports GET, PUT, POST, and DELETE, but we tested only GET using a browser. In this recipe, we will test the other methods.
- Run the project corresponding to Exercise 1.2 in Visual Studio.
- Set a breakpoint in the Post action method.
- Run Fiddler and go to the Composer tab on the right. From the drop-down showing HTTP methods, select POST.
- Enter http://localhost:55778/api/employees for the URI. Remember to replace the port 55778 specified in the example code with the actual port the application you created in Exercise 1.2 runs on.
- Copy and paste the request, as shown in Listing 2-3. Paste the headers (first two lines) in Request Headers and the JSON in the Request Body text box.
Listing 2-3. POST Request
Host: localhost:55778
Content-Type: application/json

{"Id":12348,"FirstName":"Philip","LastName":"Hughes"} - Click the Execute button.
- Visual Studio hits the break point. Inspect the parameter. ASP.NET Web API should have created the parameter Employee object based on the JSON in the request body, as shown in Figure 2-5.
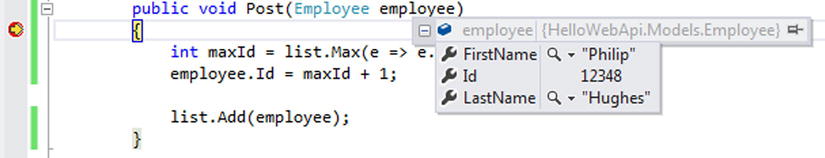
Figure 2-5. Execution Breaking in the Action Method in Visual Studio
 Note The Content-Type request header is important; without it the Employee parameter of the action method will be null.
 - Press F5 and let the execution complete. Fiddler displays an entry in the captured sessions, as shown in Figure 2-6.
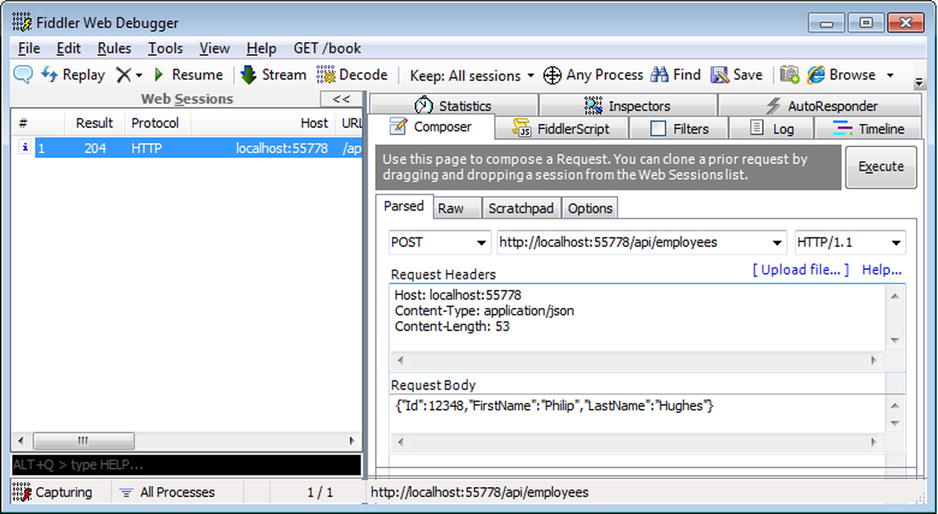
Figure 2-6. Fiddler Composer
- Select the entry to view the response sent by our web API. Since the Post method returns void, the HTTP status code of 204 - No Content is sent back.
- The Request Headers textbox in Figure 2-6 shows the Content-Length header, which we did not enter (see Listing 2-3). Fiddler automatically calculates the length based on the request body and plugs that in.
- Similarly, try making a PUT request to http://localhost:55778/api/employees/ 12348 with a message body of {"Id":12348,"FirstName":"Phil","LastName":"Hughes"}. If you now make a GET to http://localhost:55778/api/employees/12348, it will return the resource representation with the first name changed to Phil. You can try a DELETE request as well to the URI http://localhost:55778/api/employees/ 12348.
- To make a PATCH request, select PATCH from the method drop down and give the request body of {"FirstName":"Jon"}. Give the URI as http://localhost:55778/api/employees/12345. This will update only the FirstName property of the corresponding Employee object from John to Jon.
HTTP MESSAGE ANATOMY
The two endpoints of any communication based on HTTP are a server and a client. The client sends a request message to the server; the server processes the request and sends a response message back to the client and these steps constitute an HTTP transaction.
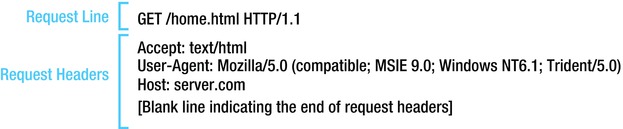
An HTTP request begins with the request line as its first line. The request line starts with the HTTP method, followed by a space followed by the URI of the resource requested, a space, and then the HTTP version. The request line is terminated by a Carriage Return (CR) and a Line Feed (LF) character. Following the request line are the request headers. The header fields are colon-separated key-value pairs, terminated by a CRLF, just like the request line. The end of the header fields is indicated by an empty field—two consecutive CRLF pairs. Finally, following the request headers is the optional request body. Depending on the HTTP method used, the request body could be present or absent. Putting all these pieces of the HTTP request together, here is what a typical request message looks like.
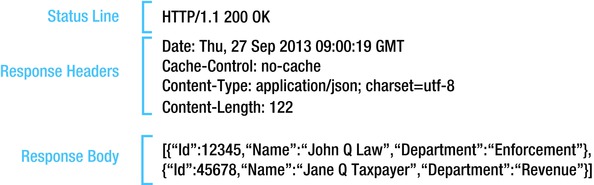
The HTTP response has the status line as its first line. The status line starts with the HTTP version, followed by a space, the status code, another space, and then the reason phrase. The HTTP response status code is a three-digit number. The Request line is terminated by a CRLF. The response body has the representation of the resource, as defined by the Content-Type header. For ASP.NET Web API, this is typically JSON or XML. Putting all these pieces of the HTTP response together, here is what a typical response message looks like, with some of the headers removed for brevity.
2.5 Using F12 Developer Tools in Internet Explorer
In this exercise, you will use the Network tab in the F12 Developer Tools of Internet Explorer to view the HTTP requests originating from IE and the corresponding response messages.
- Open Internet Explorer 9+ and press the F12 key.
- Go to the Network tab and click Start Capturing.
- Enter http://localhost:55778/api/employees/12345 in the address bar and press Enter. Remember to replace the port 55778 with the actual port that the application you created in Exercise 1.2 runs on.
- IE now shows the capture. Select the capture and click Go To Detailed View, as shown in Figure 2-7.
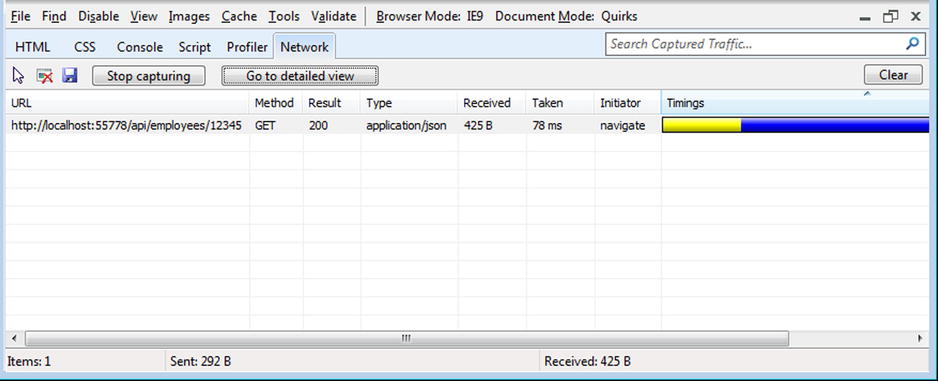
Figure 2-7. The IE Developer Tools Network tab
- IE displays the request headers, request body, response headers, response body, and so on as different tabs, as shown in Figure 2-8.
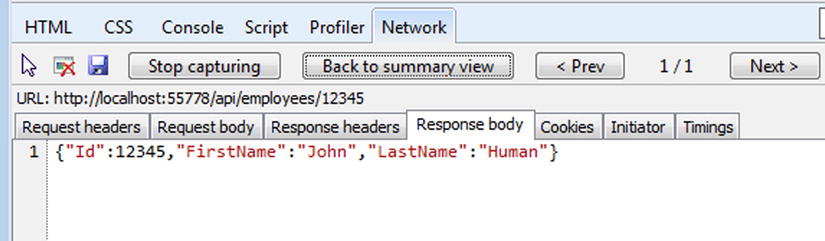
Figure 2-8. IE Developer Tools—Detailed View
This capacity will be very handy if you develop single-page applications (SPAs) with JavaScript libraries such as JQuery consuming ASP.NET Web API.
2.6 Using Developer Tools in Chrome
In this exercise, you will use the developer tools of the Chrome browser to view the HTTP requests originating from Chrome and the corresponding response messages.
- Open Chrome and press Ctrl+Shift+I. The Developer Tools option is available from the Tools menu as well.
- Navigate to http://localhost:55778/api/employees/12345. Remember to replace the port 55778 with the actual port that the application you created in Exercise 1.2 runs on.
- Chrome displays the capture in the Network tab, as shown in Figure 2-9.
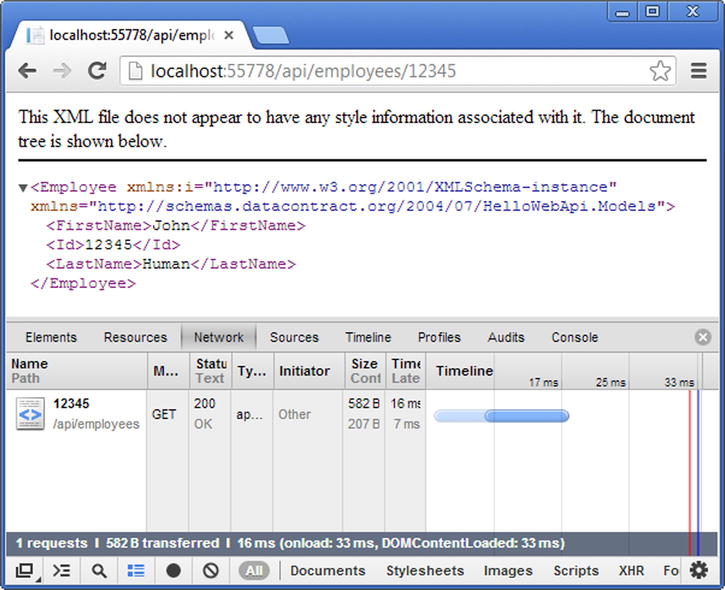
Figure 2-9. The Chrome Developer Tools
- You can click within the capture to see the details.
![]() Note It is interesting to observe that Chrome shows the response as XML, while Internet Explorer shows the response as JSON. Key to this difference in behavior is the Accept request header sent by these browsers. IE sends Accept: text/html, application/xhtml+xml, */*. Chrome sends Accept: text/html,application/xhtml+xml,application/xml;q=0.9,*/*;q=0.8. Because Chrome asked for application/xml, that’s what it gets. Since IE asked for only HTML or XHTML, ASP.NET Web API has sent the response in the default MIME type, which is application/json. You’ll learn more about this topic of content negotiation in Chapter 3.
Note It is interesting to observe that Chrome shows the response as XML, while Internet Explorer shows the response as JSON. Key to this difference in behavior is the Accept request header sent by these browsers. IE sends Accept: text/html, application/xhtml+xml, */*. Chrome sends Accept: text/html,application/xhtml+xml,application/xml;q=0.9,*/*;q=0.8. Because Chrome asked for application/xml, that’s what it gets. Since IE asked for only HTML or XHTML, ASP.NET Web API has sent the response in the default MIME type, which is application/json. You’ll learn more about this topic of content negotiation in Chapter 3.
2.7 Enabling ASP.NET Web API Tracing
In this exercise, you will enable ASP.NET Web API tracing using System.Diagnostics. You will use the NuGet package Microsoft ASP.NET Web API Tracing.
- Run Visual Studio and open the project corresponding to Exercise 1.2. Alternatively, you can create a new ASP.NET MVC 4 project with the Web API template, add a new ApiController with a name of EmployeesController, and paste the code from Listing 1-4 and Listing 1-5 of Chapter 1. (This code is also reproduced in Exercise 2.2 earlier in this chapter for your easy reference.) If you create a new project, remember to add the Employee model class to it as well.
- Click on Tools ➤ Library Package Manager ➤ Package Manager Console. In the Package Manager Console, as shown in Figure 2-10, enter Install-Package Microsoft.AspNet.WebApi.Tracing and press Enter.
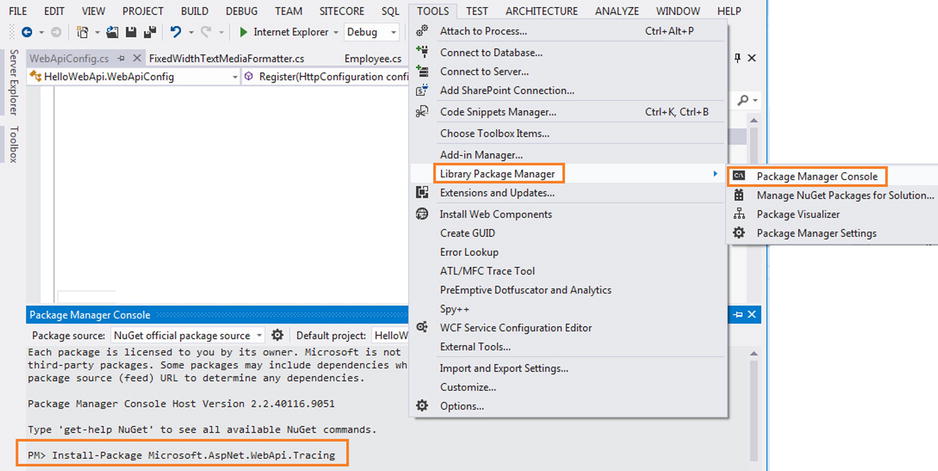
Figure 2-10. Installing the Microsoft ASP.NET Web API Tracing NuGet package
- In the Register method of WebApiConfig, in the App_Start folder, add the following line of code:
config.EnableSystemDiagnosticsTracing();
- Rebuild the solution and run the project by pressing F5. Clear the Output window of Visual Studio by right-clicking it and selecting Clear All.
- In the Internet Explorer window that opens up, type the URI http://localhost:55778/api/employees/12345 in the address bar. Remember to replace the port 55778 with the actual port your application runs on.
- Review the trace lines that are now written into the Output window. Trace provides a good insight into how ASP.NET Web API goes about handling the GET request.
iisexpress.exe Information: 0 : Request, Method=GET, Url= http://localhost:55778/api/employees/12345 , Message=' http://localhost:55778/api/employees/12345 '
iisexpress.exe Information: 0 : Message='Will use same 'JsonMediaTypeFormatter' formatter', Operation=JsonMediaTypeFormatter.GetPerRequestFormatterInstance
iisexpress.exe Information: 0 : Message='Will use same 'XmlMediaTypeFormatter' formatter', Operation=XmlMediaTypeFormatter.GetPerRequestFormatterInstance
iisexpress.exe Information: 0 : Message='Will use same 'FormUrlEncodedMediaTypeFormatter' formatter', Operation=FormUrlEncodedMediaTypeFormatter.GetPerRequestFormatterInstance
iisexpress.exe Information: 0 : Message='Will use same 'JQueryMvcFormUrlEncodedFormatter' formatter', Operation=JQueryMvcFormUrlEncodedFormatter.GetPerRequestFormatterInstance
iisexpress.exe Information: 0 : Message='Employees', Operation=DefaultHttpControllerSelector.SelectController
iisexpress.exe Information: 0 : Message='HelloWebApi.Controllers.EmployeesController', Operation=DefaultHttpControllerActivator.Create
iisexpress.exe Information: 0 : Message='HelloWebApi.Controllers.EmployeesController', Operation=HttpControllerDescriptor.CreateController
iisexpress.exe Information: 0 : Message='Selected action 'Get(Int32 id)'', Operation=ApiControllerActionSelector.SelectAction
iisexpress.exe Information: 0 : Message='Parameter 'id' bound to the value '12345'', Operation=ModelBinderParameterBinding.ExecuteBindingAsync
iisexpress.exe Information: 0 : Message='Model state is valid. Values: id=12345', Operation=HttpActionBinding.ExecuteBindingAsync
iisexpress.exe Information: 0 : Message='Action returned 'HelloWebApi.Models.Employee'', Operation=ReflectedHttpActionDescriptor.ExecuteAsync
iisexpress.exe Information: 0 : Message='Will use same 'JsonMediaTypeFormatter' formatter', Operation=JsonMediaTypeFormatter.GetPerRequestFormatterInstance
iisexpress.exe Information: 0 : Message='Selected formatter='JsonMediaTypeFormatter', content-type='application/json; charset=utf-8'', Operation=DefaultContentNegotiator.Negotiate
iisexpress.exe Information: 0 : Operation=ApiControllerActionInvoker.InvokeActionAsync, Status=200 (OK)
iisexpress.exe Information: 0 : Operation=EmployeesController.ExecuteAsync, Status=200 (OK)
iisexpress.exe Information: 0 : Response, Status=200 (OK), Method=GET, Url= http://localhost:55778/api/employees/12345 , Message='Content-type='application/json; charset=utf-8', content-length=unknown'
iisexpress.exe Information: 0 : Operation=JsonMediaTypeFormatter.WriteToStreamAsync
iisexpress.exe Information: 0 : Operation=EmployeesController.Dispose
![]() Note Tracing is not enabled by default, and this exercise showed you how to enable it. If you have installed the tooling refresh of Visual Studio 2012 ASP.NET and Web Tools 2012.2, tracing is enabled by default when you create your project from Web API project template.
Note Tracing is not enabled by default, and this exercise showed you how to enable it. If you have installed the tooling refresh of Visual Studio 2012 ASP.NET and Web Tools 2012.2, tracing is enabled by default when you create your project from Web API project template.
2.8 Creating a Custom Trace Writer
In this exercise, you will create a custom trace writer that writes XML elements. A custom trace writer must implement the System.Web.Http.Tracing.ITraceWriter interface.
- Run Visual Studio and open the project corresponding to Exercise 1.2. If you have opted to create a new project instead of using the project from Exercise 1.2, open it.
- Create a new class WebApiTracer implementing ITraceWriter, as shown in Listing 2-4. There is an ITraceWriter interface in the Newtonsoft.Json.Serailization namespace as well as in System.Web.Http.Tracing. We need the latter. Make sure you include the using System.Web.Http.Tracing; directive.
Listing 2-4. A Custom Trace Writer
using System;
using System.IO;
using System.Net.Http;
using System.Text;
using System.Web.Http.Tracing;
using System.Xml;

public class WebApiTracer : ITraceWriter
{
    public void Trace(HttpRequestMessage request,
                            string category,
                                    TraceLevel level,
                                        Action<TraceRecord> traceAction)
    {
        if (level != TraceLevel.Off)
        {
            TraceRecord rec = new TraceRecord(request, category, level);
            traceAction(rec);
            WriteXmlElement(rec);
        }
    }

    private void WriteXmlElement(TraceRecord rec)
    {
        using (Stream xmlFile = new FileStream(@" C:pathlog.xml", FileMode.Append))
        {
            using (XmlTextWriter writer = new XmlTextWriter(xmlFile, Encoding.UTF8))
            {
                writer.Formatting = Formatting.Indented;
                writer.WriteStartElement("trace");
                writer.WriteElementString("timestamp", rec.Timestamp.ToString());
                writer.WriteElementString("operation", rec.Operation);
                writer.WriteElementString("user", rec.Operator);

                if (!String.IsNullOrWhiteSpace(rec.Message))
                {
                    writer.WriteStartElement("message");
                    writer.WriteCData(rec.Message);
                    writer.WriteEndElement();
                }

                writer.WriteElementString("category", rec.Category);
                writer.WriteEndElement();
                writer.WriteString(Environment.NewLine);
                writer.Flush();
            }
        }
    }
} - Visual Studio shows a wavy red underline for the types that need using directives. You can right-click each one and choose the namespace to resolve it. Listing 2-4 shows the required using directives preceding the class definition.
- To implement ITraceWriter, you must implement the Trace method. The logic of the Trace method is as follows.
- a. Create a new TraceRecord object.
- b. Invoke the caller’s traceAction, passing the TraceRecord object.
- c. Write XML out based on the TraceRecord object with details filled in by the caller.
- d. I use C:pathlog.xml in Listing 2-4 as a placeholder. You will need to adjust this path to get the XML file created in a valid path in your computer.
- To plug the trace writer in, add a line of code in the Register method of WebApiConfig under App_Start folder, like so:
config.Services.Replace(typeof(ITraceWriter), new WebApiTracer());
Make sure this line appears after the line config.EnableSystemDiagnosticsTracing(); that you added in Exercise 2.7. This sequence is important to ensure that the WebApiTracer class you just created replaces all the existing services for the ITraceWriter service type.
- ITraceWriter is from the namespace System.Web.Http.Tracing. So you will need to add a using directive to the WebApiConfig class, like so:
using System.Web.Http.Tracing;
- Rebuild the solution and issue a request to the web API (it can be any request).
- Open the XML file and review the contents.
You will see that an XML element is created for each trace record. Currently, our trace writer is tracing only the framework code.
In this exercise, you will create a custom trace writer that writes trace records with the time taken for each operation. The ASP.NET Web API pipeline writes traces at the beginning and end of an operation. By finding the difference between the timestamps of the beginning and end trace records, you can find the time taken by that operation. This is a handy way to quickly check the performance in production. Of course, you will need to enable the tracing in production for this. Generally, tracing is switched on for a short duration, and once the sufficient data is collected, it is switched off again. No production server will have tracing enabled all the time.
In this exercise, we will store TraceRecord objects in a modified version of a ring buffer. We will keep it simple and not use the head and tail pointers typically used with a ring buffer; instead, we will use only one pointer, which resets back to the index 0 once it is past the last element of the buffer. The older entries are evicted to make room for the newer ones. The buffer will be read by an ApiController that returns the trace information as StringContent, after computing TimeSpan differences.
- Create a new trace writer with a name of EntryExitTracer, as shown in Listing 2-5. The trace writer just stores the TraceRecord object with details in a ring buffer, which is our custom implementation.
Listing 2-5. The EntryExitTracer Class
using System.Net.Http;
using System.Web.Http.Tracing;

public class EntryExitTracer : ITraceWriter
{
    public void Trace(HttpRequestMessage request,
                            string category,
                                    TraceLevel level,
                                        Action<TraceRecord> traceAction)
    {
        if (level != TraceLevel.Off)
        {
            TraceRecord rec = new TraceRecord(request, category, level);
            traceAction(rec);

            RingBufferLog.Instance.Enqueue(rec);
        }
    }
} - Create a new RingBufferLog class, as shown in Listing 2-6. It is a singleton class, and it stores the TraceRecord objects in a fixed-size array. The basic idea is to ensure that only TraceRecord objects of a fixed size are stored, and the older items are evicted to make way for the newer items. When an item is queued, it moves the pointer by one and stores the item in that position. If the pointer reaches the end of the array, it is reset to 0. Since multiple threads can queue, we use lock to handle concurrency. PeekAll returns the buffer content, and DequeueAll drains the buffer.
Listing 2-6. The Ring Buffer for Storing TraceLog
using System.Collections.Generic;
using System.Linq;
using System.Web.Http.Tracing;

public class RingBufferLog
{
    private const int BUFFER_SIZE = 1000;

    TraceRecord[] buffer;
    int pointer = 0;
    private readonly object myPrecious = new object();

    private static RingBufferLog instance = new RingBufferLog();

    private RingBufferLog()
    {
        buffer = new TraceRecord[BUFFER_SIZE];
        ResetPointer();
    }

    public IList<TraceRecord> DequeueAll()
    {
        lock (myPrecious)
        {
            ResetPointer();

            var bufferCopy = new List<TraceRecord>(buffer.Where(t => t != null));

            for (int index = 0; index < BUFFER_SIZE; index++)
            {
                buffer[index] = null;
            }

            return bufferCopy;
        }
    }

    public IList<TraceRecord> PeekAll()
    {
        lock (myPrecious)
        {
            var bufferCopy = new List<TraceRecord>(buffer.Where(t => t != null));

            return bufferCopy;
        }
    }

    private void ResetPointer()
    {
        pointer = BUFFER_SIZE - 1;
    }

    private void MovePointer()
    {
        pointer = (pointer + 1) % BUFFER_SIZE;
    }

    public void Enqueue(TraceRecord item)
    {
        lock (myPrecious)
        {
            MovePointer();
            buffer[pointer] = item;
        }
    }

    public static RingBufferLog Instance
    {
        get
        {
            return instance;
        }
    }
} - To plug the trace writer in, add a line of code in the Register method of WebApiConfig under App_Start folder, as shown in Listing 2-7. You can comment out the previous lines or simply leave them in. By adding the line shown in bold type as the last line, you are replacing all the existing services for the ITraceWriter service type with that of EntryExitTracer.
Listing 2-7. The Register Method in WebApiConfig
public static class WebApiConfig
{
    public static void Register(HttpConfiguration config)
    {
        config.Routes.MapHttpRoute(
            name: "DefaultApi",
            routeTemplate: "api/{controller}/{id}",
            defaults: new { id = RouteParameter.Optional }
        );

        //config.EnableSystemDiagnosticsTracing();
        //config.Services.Replace(typeof(ITraceWriter), new WebApiTracer());

        config.Services.Replace(
                              typeof(System.Web.Http.Tracing.ITraceWriter),
                                     new EntryExitTracer());
    }
} - Add a new ApiController with a name of TracesController. Add an action method to handle GET, as shown in Listing 2-8. The logic implemented in the action method consists of the following steps:
- a. Retrieve all the TraceRecord entries from the buffer.
- b. For each record of Kind of TraceKind.Begin, try to find the corresponding TraceKind.End record.
- c. If there is one, calculate the difference in the TimeStamp values and display the time taken. Do the matching based on the Operation, Operator, Category, and RequestId values.
- d. Keep track of the indent level to format the string, which is returned back to the caller as Content-Type: text/plain.
- e. This implementation just peeks into the entries. The DequeueAll method of the buffer is not called by this controller. In a production environment, the entries must be dequeued to clear the memory taken by the TraceRecord objects, probably from a DELETE action method (not implemented here though).
Listing 2-8. An API Controller to Display Trace Entries
using System;
using System.Linq;
using System.Net.Http;
using System.Text;
using System.Web.Http;
using System.Web.Http.Tracing;

public class TracesController : ApiController
{
    public HttpResponseMessage Get()
    {
        StringBuilder content = new StringBuilder();

        var entries = RingBufferLog.Instance.PeekAll();
        if (entries != null && entries.Count > 0)
        {
            int indent = 0;

            foreach (var entry in entries)
            {
                if (!String.IsNullOrEmpty(entry.Operation) &&
                            !String.IsNullOrEmpty(entry.Operator) &&
                                !String.IsNullOrEmpty(entry.Category))
                {
                    if (entry.Kind == TraceKind.Begin)
                    {
                        var end = entries.FirstOrDefault(e =>
                                                       entry.RequestId.Equals(e.RequestId) &&
                                                        entry.Operator.Equals(e.Operator) &&
                                                          entry.Operation.Equals(e.Operation) &&
                                                            entry.Category.Equals(e.Category) &&
                                                                e.Kind == TraceKind.End);
                        string millis = String.Empty;

                        if (end != null)
                            millis =
                               (end.Timestamp - entry.Timestamp).TotalMilliseconds.ToString();

                        content.Append('	', indent);
                        content.AppendFormat("BGN {0} {1} {2} {3}
",
                                             entry.RequestId, entry.Operator,
                                             entry.Operation, millis);

                        indent++;
                    }
                    else
                    {
                        indent--;

                        content.Append('	', indent);
                        content.AppendFormat("END {0} {1} {2}
",
                                             entry.RequestId, entry.Operator, entry.Operation);
                    }
                }
            }
        }

        return new HttpResponseMessage()
        {
            Content = new StringContent(content.ToString())
        };
    }
} - Rebuild the solution and make a few requests to EmployeesController.
- Make a GET request to http://localhost:55778/api/traces from Internet Explorer. Remember to replace the port 55778 with the actual port that the application runs on. It displays the trace with time in milliseconds, as shown in Figure 2-11.
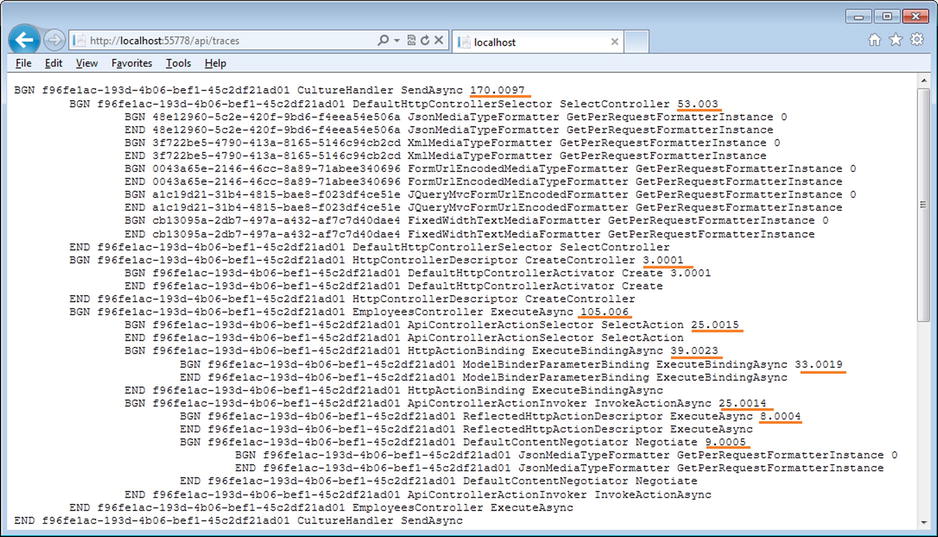
Figure 2-11. Trace output
2.10 Tracing from Your Code
In this exercise, you will use the trace writer to write trace output from your code.
- Modify the Register method of WebApiConfig in the App_Start folder, as shown in Listing 2-9. We are basically going back to the WebApiTracer.
Listing 2-9. The Register method of WebApiConfig
public static class WebApiConfig
{
    public static void Register(HttpConfiguration config)
    {
        config.Routes.MapHttpRoute(
            name: "DefaultApi",
            routeTemplate: "api/{controller}/{id}",
            defaults: new { id = RouteParameter.Optional }
        );

        config.Services.Replace(typeof(ITraceWriter), new WebApiTracer());
    }
} - Comment out the code in the EmployeesController class and add the code from Listing 2-10. The TraceWriter.Info method is the shorthand equivalent of the Trace method. The Get action method uses them both just for illustration.
Listing 2-10. The Get Action Method Writing Trace
using System;
using System.Collections.Generic;
using System.Linq;
using System.Web.Http;
using System.Web.Http.Tracing;
using HelloWebApi.Models;

public class EmployeesController : ApiController
{
    private readonly ITraceWriter traceWriter = null;

    public EmployeesController()
    {
        this.traceWriter = GlobalConfiguration.Configuration.Services.GetTraceWriter();
    }

    private static IList<Employee> list = new List<Employee>()
    {
        new Employee()
        {
            Id = 12345, FirstName = "John", LastName = "Human"
        },

        new Employee()
        {
            Id = 12346, FirstName = "Jane", LastName = "Public"
        },

        new Employee()
        {
            Id = 12347, FirstName = "Joseph", LastName = "Law"
        }
    };

    public Employee Get(int id)
    {
        var employee = list.FirstOrDefault(e => e.Id == id);

        if (traceWriter != null)
            traceWriter.Info(Request, "EmployeesController", String.Format("Getting employee {0}", id));

        if (traceWriter != null)
            traceWriter.Trace(
                Request, "System.Web.Http.Controllers", System.Web.Http.Tracing.TraceLevel.Info,
                    (traceRecord) =>
                    {
                        traceRecord.Message =
                        String.Format("Getting employee {0}", id);

                        traceRecord.Operation = "Get(int)";
                        traceRecord.Operator = "EmployeeController";
                    });

        return employee;
    }
} - Rebuild the solution and make a GET request from Internet Explorer to the URI http://localhost:55778/api/employees/12345.
- Open log.xml and search for the string Getting Employee. There will be two entries corresponding to the two trace statements we have in Listing 2-10.
<trace>
  <timestamp>4/13/2013 3:47:49 AM</timestamp>
  <operation />
  <level>Info</level>
  <operator />
  <request_id>07cc7d16-90ff-401f-bf1a-2df4a4072423</request_id>
  <message><![CDATA[Getting employee 12345]]></message>
  <category>EmployeesController</category>
</trace>

<trace>
  <timestamp>4/13/2013 3:47:49 AM</timestamp>
  <operation>Get(int)</operation>
  <level>Info</level>
  <operator>EmployeeController</operator>
  <request_id>07cc7d16-90ff-401f-bf1a-2df4a4072423</request_id>
  <message><![CDATA[Getting employee 12345]]></message>
  <category>System.Web.Http.Controllers</category>
</trace>
It is possible to write begin and end trace from your code as well, just as the framework does. We’ll do that in the following steps.
- Revert to the EntryExitTracer by modifying the Register method of WebApiConfig under App_Start folder as shown in Listing 2-11.
Listing 2-11. The Register Method of WebApiConfig
public static class WebApiConfig
{
    public static void Register(HttpConfiguration config)
    {
        config.Routes.MapHttpRoute(
            name: "DefaultApi",
            routeTemplate: "api/{controller}/{id}",
            defaults: new { id = RouteParameter.Optional }
        );

        config.Services.Replace(typeof(System.Web.Http.Tracing.ITraceWriter),
                                       new EntryExitTracer());
    }
} - Add the action method for GET, as shown in Listing 2-12, to the EmployeesController shown in Listing 2-10. This action method previously returned the list of employees defined as a field at the controller level. It still does that, but now inside the TraceBeginEnd method. I have added a delay of one second just for illustration.
Listing 2-12. The Get Action Method Tracing the Entry and Exit
public IEnumerable<Employee> Get()
{
    IEnumerable<Employee> employees = null;

    if (traceWriter != null)
    {
        traceWriter.TraceBeginEnd(
            Request,
            TraceCategories.FormattingCategory,
            System.Web.Http.Tracing.TraceLevel.Info,
            "EmployeesController",
            "Get",
            beginTrace: (tr) =>
            {
                tr.Message = "Entering Get";
            },
            execute: () =>
            {
                System.Threading.Thread.Sleep(1000); // Simulate delay
                employees = list;
            },
            endTrace: (tr) =>
            {
                tr.Message = "Leaving Get";
            },
            errorTrace: null);
    }

    return employees;
} - Rebuild the solution and make a GET request from Fiddler or Internet Explorer to the URI http://localhost:55778/api/employees. Remember to replace the port 55778 with the actual port that the application runs on.
- Make another GET request from Fiddler or Internet Explorer to the URI http://localhost:55778/api/traces. You will see the begin and end trace appearing for the Get method, like so:
BGN 7b577bf9-4e5d-4539-b15a-3d4c629e4de2 EmployeesController Get 1000.0572
END 7b577bf9-4e5d-4539-b15a-3d4c629e4de2 EmployeesController Get
2.11 Tracing Request and Response Messages
In this exercise, you will use the trace writer to log the request and response messages. I use a message handler for this purpose; you’ll learn more about message handlers in Chapter 8. A message handler runs both before and after the action method is executed; the request handling part runs before the action method starts executing, and the response handling part runs after the action method has generated the response. This behavior is similar to an action filter, but message handlers run for all the requests in a route (a pre-route handler) or for all requests (a global handler). The important difference is that a message handler runs much earlier in the ASP.NET Web API pipeline.
- Create a message handler as shown in Listing 2-13 by adding a new class to the project with a name of TracingHandler. I initialize new HttpMessageContent instances of the request and response objects and call ReadAsStringAsync to get the corresponding message, which you’ll write to the trace.
Listing 2-13. Tracing Message Handler
using System;
using System.Net.Http;
using System.Threading;
using System.Threading.Tasks;
using System.Web.Http;

public class TracingHandler : DelegatingHandler
{
    protected override async Task<HttpResponseMessage> SendAsync(
                                                            HttpRequestMessage request,
                                                            CancellationToken cancellationToken)
    {
        HttpMessageContent requestContent = new HttpMessageContent(request);
        string requestMessage = await requestContent.ReadAsStringAsync();

        var response = await base.SendAsync(request, cancellationToken);

        HttpMessageContent responseContent = new HttpMessageContent(response);
        string responseMessage = await responseContent.ReadAsStringAsync();

        GlobalConfiguration.Configuration.Services.GetTraceWriter()
                .Trace(request, "System.Web.Http.MessageHandlers",
                                                   System.Web.Http.Tracing.TraceLevel.Info,
                (t) =>
                {
                    t.Message = String.Format(
                                              "
{0}
{1}
", requestMessage, responseMessage);
                });

        return response;
    }
} - Revert to the WebApiTracer by modifying the Register method of WebApiConfig under App_Start folder, as shown in Listing 2-14. Also in that method, add the message handler to the handlers collection. If you have multiple message handlers in your project, ensure that this is the first handler that appears in the handlers collection.
Listing 2-14. The Register method of WebApiConfig
public static class WebApiConfig
{
    public static void Register(HttpConfiguration config)
    {
        config.Routes.MapHttpRoute(
            name: "DefaultApi",
            routeTemplate: "api/{controller}/{id}",
            defaults: new { id = RouteParameter.Optional }
        );

        config.Services.Replace(typeof(ITraceWriter), new WebApiTracer());

        config.MessageHandlers.Add(new TracingHandler());
    }
} - Rebuild the solution and make a GET request from Fiddler or Internet Explorer to the URI http://localhost:55778/api/employees/12345.
- Open log.xml and you will find an entry like this one:
<trace>
    <timestamp>4/13/2013 5:13:11 AM</timestamp>
    <operation />
    <level>Info</level>
    <operator />
    <request_id>69bfa407-a2ba-4d0b-8843-8773e2da699f</request_id>
    <message>
    <![CDATA[
        GET /api/employees/12345 HTTP/1.1
        Host: localhost:55778
        User-Agent: Fiddler

        HTTP/1.1 200 OK
        Content-Type: application/json; charset=utf-8

        {"Id":12345,"FirstName":"John","LastName":"Human"}
    ]]>
    </message>
    <category>System.Web.Http.MessageHandlers</category>
</trace>
Summary
The ability to view the request message coming into your ASP.NET Web API and the response message sent by your web API is fundamental for developing HTTP services. Another important need is to hand-craft requests by manipulating headers and the body content and submit them to ASP.NET Web API and view the corresponding response.
Fiddler, a web debugging proxy, is a useful tool to capture and analyze HTTP and HTTPS traffic between the computer running Fiddler and the outside. Fiddler also has a feature to build a complete request with headers, send it to an HTTP endpoint such as the web API, and inspect the response returned by the web API. By default, traffic from any WinInet stack, such as that of Internet Explorer, is automatically captured by Fiddler. For others, Fiddler can be configured as proxy. For classes such as WebClient that are part of the System.Net namespace, a special URL (http://localhost.fiddler:<port >) can be used so that Fiddler captures the traffic. Fiddler can also capture and even decrypt HTTPS traffic. Fiddler acts as a man-in-the-middle and generates certificates on the fly to decrypt HTTPS traffic.
Apart from Fiddler, the browsers come with tools to capture and inspect the HTTP traffic originating from them. You saw that Internet Explorer has F12 Developer Tools and Chrome has Developer Tools too, for the purpose of allowing an end user (or a developer) to view the traffic. As we reviewed the developer tools of IE and Chrome, we observed that ASP.NET Web API is capable of sending response messages in both XML and JSON. Chrome shows the web API response as XML, while Internet Explorer shows the response as JSON. In the next chapter, we will explore this topic of content negotiation further.
Another key aspect of debugging ASP.NET Web API is tracing. ASP.NET Web API supports tracing of your code as well as the framework code. Tracing the framework code is essential to understand what goes on behind the scene as ASP.NET Web API handles a request, calls your code at the right moment, and sends back a response.
The NuGet package Microsoft ASP.NET Web API Tracing enables tracing using System.Diagnostics. Here you learned how to can create your own custom tracer by implementing the System.Web.Http.Tracing.ITraceWriter interface.