
“In God, we Trust; all others must bring data”
—W. Edwards Deming, a statistician who devised “Plan-Do-Study-Act” method
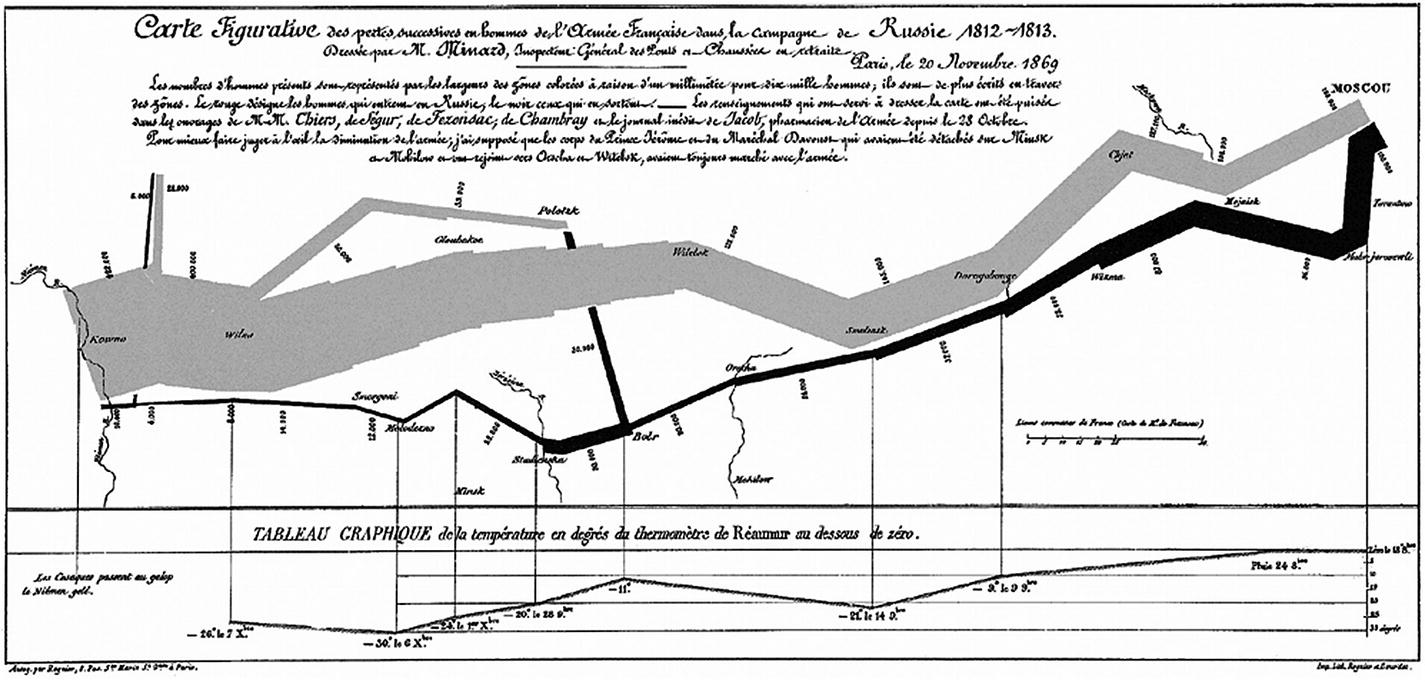
Minard’s map of Napolean’s russing campaign in 1812 Source: “Worth a thousand words: A good graphic can tell a story, bring a lump to the throat, even change policies. Here are three of history’s best.” The Economist, December 19, 2007, https://www.economist.com/node/10278643 .
From the above chart, in 1812, the Grand Army consisted of 422,000 personnel started from Poland; out of which only 100,000 reached Moscow and 10,000 returned. The French community describes the tragedy as “C’est la Bérézina”.
The chart depicts the tragic tale with such clarity and precision. The quality of the graph is accredited to the data analysis from Minard and a variety of factors soaked in to produce high-quality map. It remains one of the best examples of statistical visualization and data storytelling to date. Many analysts have spent ample time to analyze through Minard’s map and prognosticated the steps he must have gone through before painting a single image, though painful, of the entire tragedy.
Data analysis is not new in the information industry. What has grown over the years is the data and the expectation and demand to churn “gold” out of data. It would be an understatement to say that data has brought nothing but a state of confusion in the industry. At times, data gets unreasonable hype, though justified, by drawing an analogy with currency, oil, and everything precious on this planet.
Approximately two decades ago, data was a vaporous component of the information industry. All data used to exist raw, and was consumed raw, while its crude format remained unanalyzed. Back then, the dynamics of data extraction and storage were dignified areas that always posed challenges for enterprises. It all started with business-driven thoughts like variety, availability, scalability, and performance of data when companies started loving data. They were mindful of the fact that at some point, they need to come out of relational world and face the real challenge of data management. This was one of the biggest information revolutions that web 2.0 companies came across.
The information industry loves new trends provided they focus on business outcomes, catchy and exciting in learning terms, and largely uncovered. Big data picked up such a trend that organizations seemed to be in a rush to throw themselves under the bus, but failed miserably to formulate the strategy to handle data volume or variety that could potentially contribute in meaningful terms. The industry had a term for something that contained data: data warehouse, marts, reservoirs, or lakes. This created a lot of confusion but many prudent organizations were ready to take bets on data analytics.
Data explosion: the beginning
Data explosion was something that companies used to hear but never questioned their ability to handle it. Data was merely used to maintain a system of record of an event. However, multiple studies discussed the potential of data in decision making and business development. Quotes like “Data is the new currency” and “Data is the new oil of Digital Economy” struck headlines and urged many companies to classify data as a corporate asset.
Research provided tremendous value hidden in data that can give deep insight in decision making and business development. Almost every action within a “digital” ecosystem is data-related, that is, it either consumes or generates data in a structured or unstructured format. This data needs to be analyzed promptly to distill nuggets of information that can help enterprises grow.
So, what is Big Data? Is it bigger than expected? Well, the best way to define Big Data is to understand what traditional data is. When you are fully aware of data size, format, rate at which it is generated, and target value, datasets appear to be traditional and manageable with relational approaches. What if you are not familiar with what is coming? One doesn’t know the data volume, structure, rate, and change factor. It could be structured or unstructured, in kilobytes or gigabytes, or even more. In addition, you are aware of the value that this data brings. This paradigm of data is capped as Big Data IT. Major areas that distinguish traditional datasets from big data ones are Volume, Velocity, and Variety . “Big” is rather a relative measure, so do the three “V” areas. Data volume may differ by industry and use case. In addition to the three V’s, there are two more recent additions: Value and Veracity. Most of the time, the value that big data carries cannot be measured in units. Its true potential can be weighed only by the fact that it empowers business to make precise decisions and translates into positive business benefits. The best way to gauge ROI would be to compare big data investments against the business impact that it creates. Veracity refers to the accuracy of data. In the early stages of big data project lifecycle, quality, and accuracy of data matters to a certain extent but not entirely because the focus is on stability and scalability instead of quality. With the maturity of the ecosystem and solution stack, more and more analytical models consume big data and BI applications report insights, thereby instigating a fair idea about data quality. Based on this measure, data quality can be acted upon.
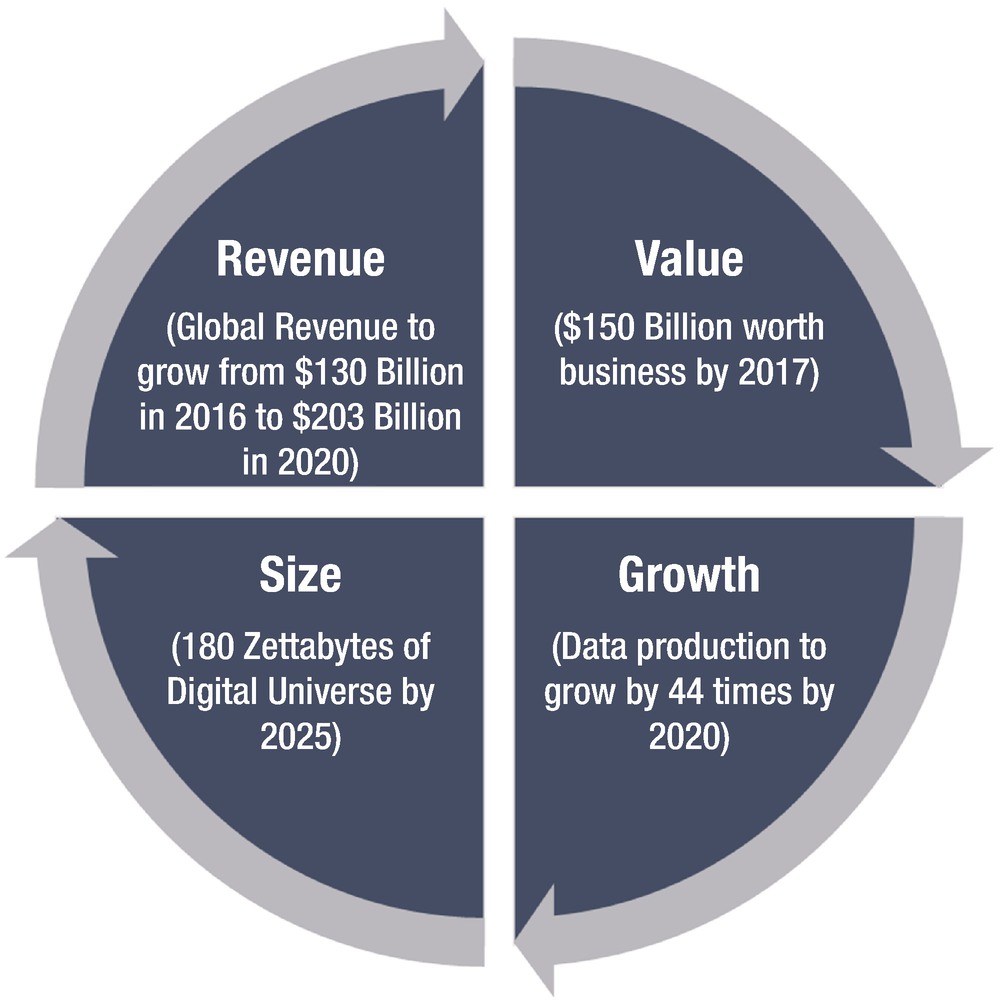
Top big data trends in 2017. Source: Data from “Double-Digit Growth Forecast for the Worldwide Big Data and Business Analytics Market Through 2020 Led by Banking and Manufacturing Investments, According to IDC,” International Data Corporation (IDC), October, 2016, https://www.idc.com/getdoc.jsp?containerId=prUS41826116 .
- 1.
Per IDC, worldwide revenues for big data and business analytics (BDA) will grow from $130.1 billion in 2016 to more than $203 billion in 2020.
- 2.
Per IDC, the Digital Universe estimated is to grow to 180 Zettabytes by 2025 from pre-estimated 44 Zettabytes in 2020 and from less than 10 Zettabytes in 2015.
- 3.
Traditional data is estimated to fold by 2.3 times between 2020 and 2025. In the same span of time, analyzable data will grow by 4.8 times and actionable data will grow by 9.6 times.
- 4.
Data acumen continues to be a challenge. Organization alignment and a management mindset are found to be more business centric than data centric.
- 5.
Technologies like Big Data, Internet of Things, data streaming, business intelligence, and cloud will converge to become a much more robust data management package. Cloud-based analytics to play key role in accelerating the adoption of big data analytics.
- 6.
Deep Learning, one of Artificial Intelligence’s (AI) strategies, will be a reality. It will be widely used for semantic indexing, and image and video tagging.
- 7.
Non-relational analytical data stores will grow by 38.6% between 2015 to 2020.
Big data ecosystem
- 1.
Data can be structured, semi-structured, or not structured at all. It is to impossible to design a generic strategy that can cater datasets of all structures.
- 2.
Data from different sources can flow at different change rates. It may or may not have a schema.
- 3.
How to process disparate datasets of sizes ranging from multi terabytes to multi petabytes together?
- 4.
Common infrastructure must be cost effective and reliable, and should be fault tolerant and resilient. Total cost of ownership should be controllable to achieve high returns.
For a Big Data IT strategy to be successful, data must flow from a distinctive and reliable source system at a pre-determined frequency. Data must be relevant and mature enough to create critical insights and achieve specific business outcomes. From the cost perspective, enterprises were investing huge, in infrastructure to support storage, computing power, and parallelization.
Hadoop and MapReduce – Early days
In 2004, Google, in an effort to index the web, released white papers on data processing for large distributed data-intensive applications. The intent was to address two problem statements directly: storage and processing.
Google introduced MapReduce as the data processing framework and Google File System (GFS) as a scalable distributed file system. What makes the MapReduce framework highly scalable is the fact that a parallelized processing layer comes down all the way to the data layer that is distributed across multiple commodity machines. Google File System was designed for fault tolerance that can be accessed by multiple clients and achieve performance, scalability, availability, and reliability at the same time.
MapReduce proved to be the game changer for data process-intensive applications. It’s a simple concept of breaking down a data processing task into a bunch of mappers that can run in parallel on thousands of commodity machines. Reducers constitute a second level of data processing operations that runon top of output generated from mappers.
Evolution of Hadoop
In the year 2002, the Yahoo! development team started a large-scale open-source web search project called Nutch. While Hadoop was still in the conceptual phase, Nutch’s primary challenge was its inability to scale beyond a certain page limit. Then the concept of Google’s GFS was introduced to project Nutch. A GFS-like file system resolved storage-related issues by allowing large files to sit in a system that was fault tolerant and available. By 2004, an open source implementation of GFS was ready as Nutch Distributed Filesystem (NDFS).
In 2004, Google introduced the MapReduce processing framework, which for obvious reasons, was immediately added into project Nutch. By early 2005, Nutch algorithms were already working with NDFS and MapReduce at an enterprise level. Such instrumentation was the combination of NDFS and MapReduce that, in 2006, Yahoo! took this package out of project Nutch. Doug Cutting was fascinated by a little stuffy yellow elephant and named this package Hadoop for the ease of memory and pronunciation. In 2008, Apache Software Foundation took over Hadoop to work beyond web-search optimization and indexing.
In a series of events starting in 2008, Hadoop stack has been pulling some magical numbers to prove its power of processing and worth at the enterprise level. In February 2008, Yahoo! claimed to generate a web search index on 10,000 core Hadoop cluster. In April 2008, Apache Hadoop set a world record as the fastest platform to process terabyte of data with a 910-node cluster. Hadoop could sort one terabyte of data in just 209 seconds, beating the previous benchmark of 297 seconds.
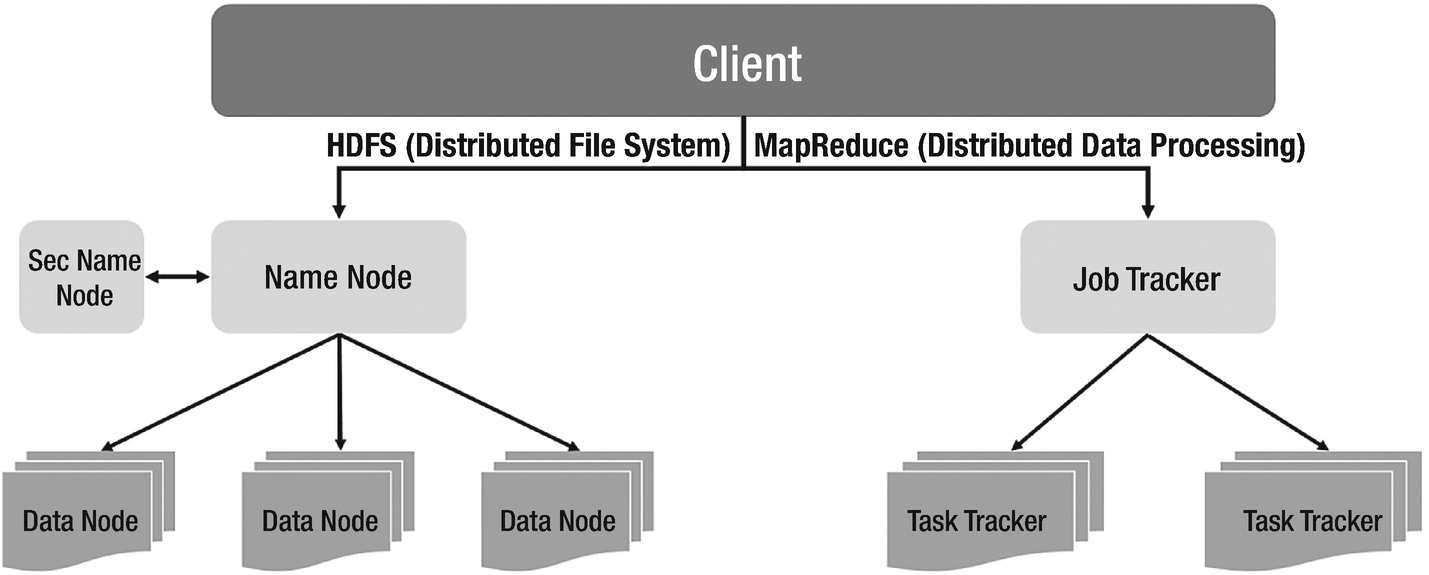
Hadoop 1 high-level architecture
Standby NameNode to support high availability of primary NameNode
- YARN for cohesive resource management and efficient job scheduling
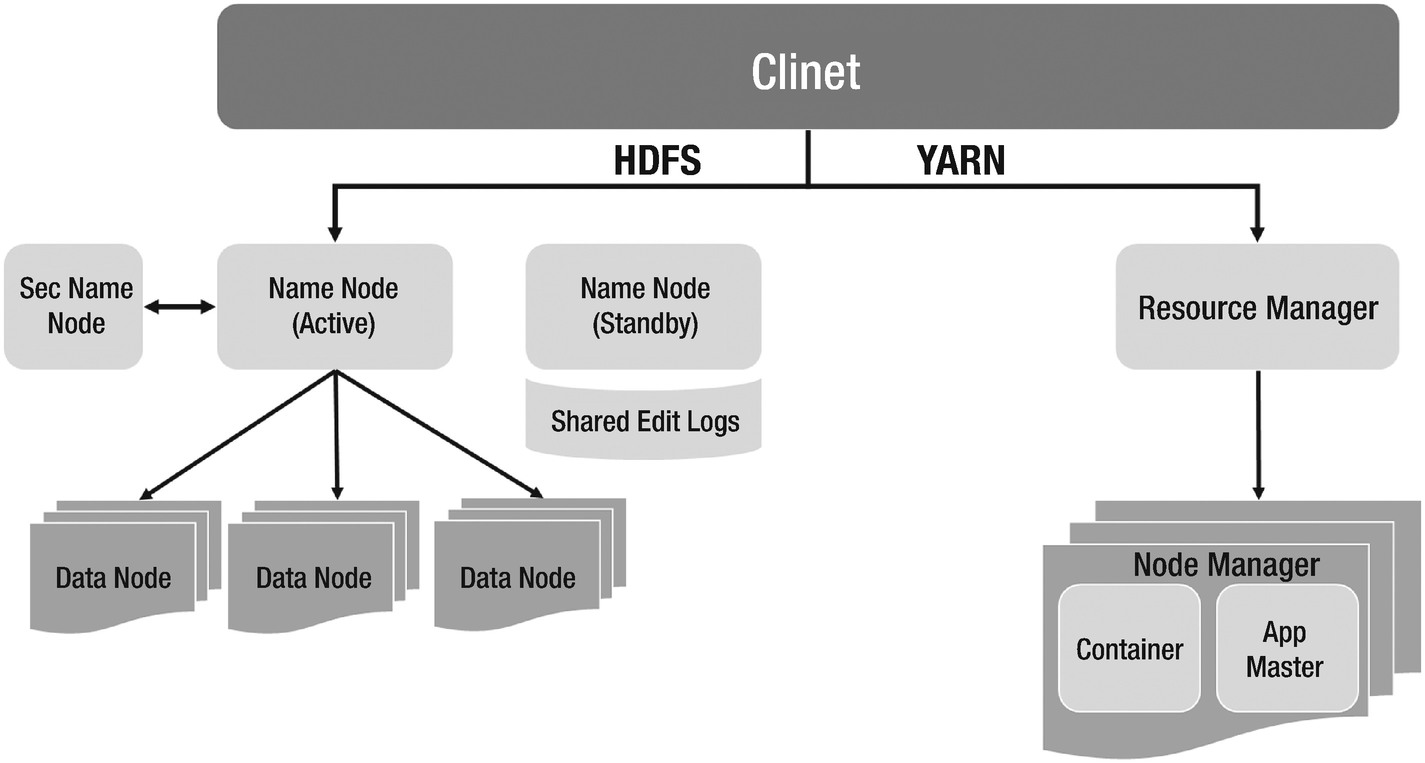 Figure 1-4
Hadoop 2 high-level architecture
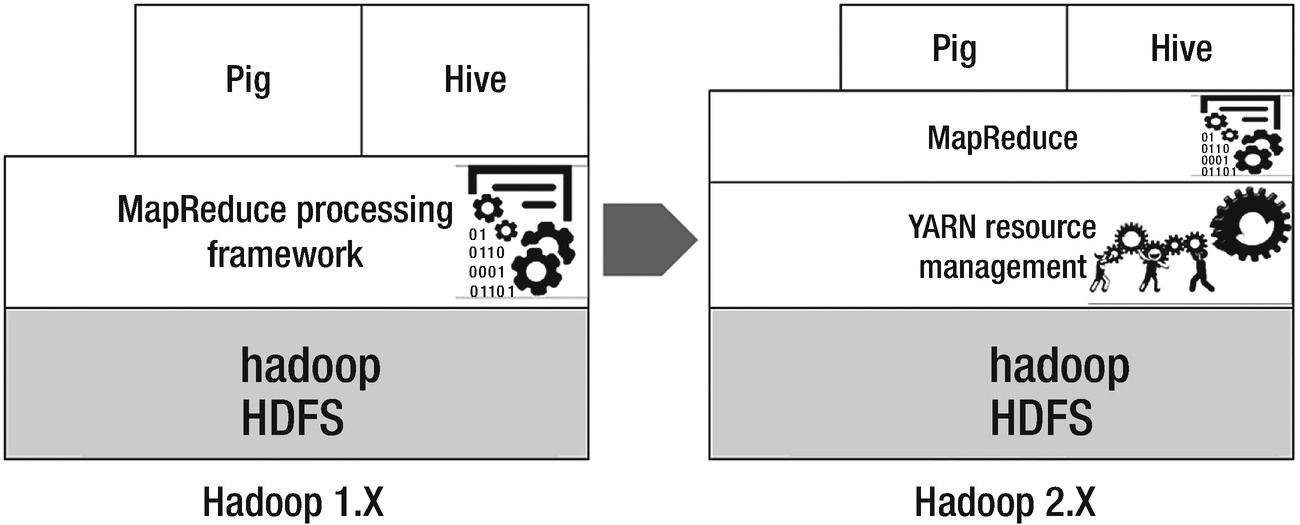
Head to head comparison of Hadoop 1 and Hadoop 2
History of Data Lake
Since the time Big Data trends have become buzzwords, several marketing terms have been coined to describe data management strategies. Eventually, all of them happen to represent a version of the Big Data ecosystem.
In 2010,1 James Dixon came up with a “time machine” vision of data. Data Lake represents a state of enterprise at any given time. The idea is to store all the data in a detailed fashion in one place and empower business analytics applications, and predictive and deep learning models with one “time machine” data store. This leads to a Data-as-an-Asset strategy wherein continuous flow and integration of data enriches Data Lake to be thick, veracious, and reliable. By virtue of its design and architecture, Data Lake plays a key role in unifying data discovery, data science, and enterprise BI in an organization.
According to James Dixon2 “If you think of a datamart as a store of bottled water—cleansed and packaged and structured for easy consumption—the data lake is a large body of water in a more natural state. The contents of the data lake stream in from a source to fill the lake, and various users of the lake can come to examine, dive in, or take samples.”
The adoption rate of Data Lake reflects the progression of open-source Hadoop as a technology and its close association with the Big Data IT trend. Keep in mind that although data lake is presumed to be on Hadoop due to the latter’s smooth equation with Big Data IT, it’s not mandatory. Don’t be surprised if you Find Data Lake hosted on relational databases. You must factor in the cost of standing a non-Hadoop stack, data size, and BI use cases.
Data Lake: the concept
Data Lake is a single window snapshot of all enterprise data in its raw format, be it structured, semi-structured, or unstructured. Starting from curating the data ingestion pipeline to the transformation layer for analytical consumption, every aspect of data gets addressed in a data lake ecosystem. It is supposed to hold enormous volumes of data of varied structures.
Data Lake is largely a product that is built using Hadoop and a processing framework. The choice of Hadoop is as direct as it can be. It not only provides scalability and resiliency, but also lowers the total cost of ownership.
At a broader level, data lake can be split into a data landing layer and an analytical layer. From the source systems, data lands directly into the data landing or mirror layer. The landing layer contains the as-is copy of the data from source systems, that is, raw data. It lays the foundation for the battleground for the analytical layer. The analytical layer is a highly dynamic one in the Data Lake world as it is the downstream consumer of raw data from the mirror layer. The landing or mirror layer data is fed through a transformation layer and builds up the analytical or consumption layer. The analytical layer ensures data readiness for data analytics sandbox and thus, acts as a face-off to data scientists and analysts. Pre-built analytical models can be directly plugged in to run over the consumption layer. Perhaps, dynamic analytics like data discovery or profiling models can also be made to run directly on the consumption layer. Data visualization stacks can consume data from the consumption layer to present key indicators and data trends.
Another split of data lake can be based on temporal dimensions of data. Historical raw data can be archived and stored securely within the data lake. While it will still be active to the data lake consumers, it can be moved to a secondary storage. Mirror layer that we discussed above can hold incremental data given a pre-determined timeline. In this case, consumption layer is built upon augmented mirror layer only.
This model doesn’t need to have physical data marts that are custom built to serve a singular static model. Rather they transform the data in a usable format to enable analytics and business insights. On the other hand, data warehouse provides an abstract image of a specific business wing.
Data lake architecture
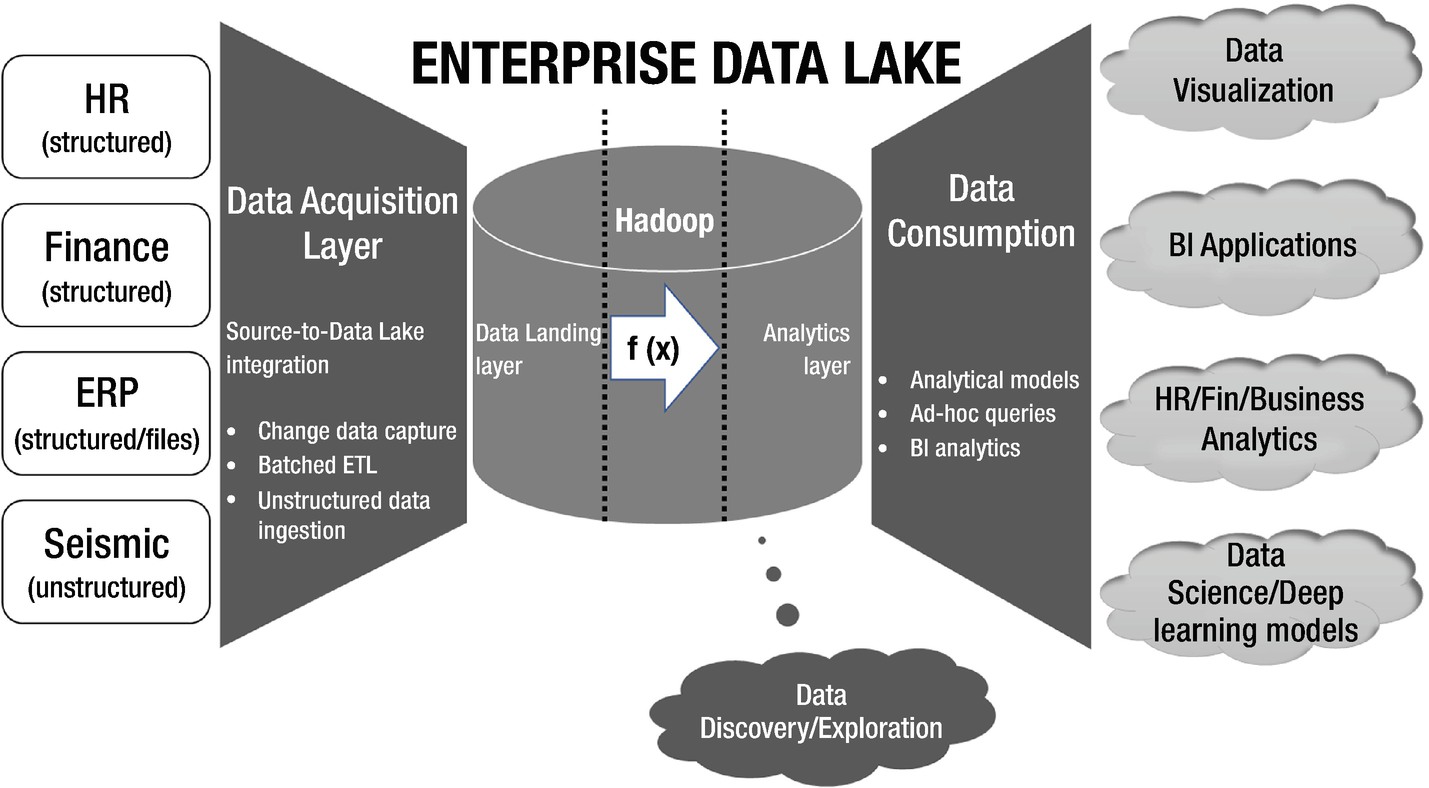
Enterprise Data Lake Architecture
In the above architecture diagram, there may be multiple source systems dumping data into the Enterprise Data Lake. Source systems can be of variety of nature and structure. It may come from relational sources, static file systems, web logs, or time-series sensor data from Internet of Things devices . It may or may not be structured. Without hampering the structure of data from the source and without investing into data modeling efforts in Hadoop, all source systems ingest data into Data Lake in stipulated real time.
Once data comes in the purview of Data Lake frontiers, it propagates through the processing layer to build the analytical layer. At this stage, it may be required to define the schema and structure for raw data. Thereafter, depending upon the data exchange guidelines laid down by the data governance council, data gets consumed by predictive learning models, BI applications, and data science tracks. Meanwhile, the anatomy of data discovery continues to provide a visual and exploratory face to big data in Hadoop Data Lake by directly working on raw data.
Why Data Lake?
Big Data IT is driven by competition. Organizations want to exploit the power of data analytics at a manageable cost to stand out to their competitors. Data Lake provides a scalable framework to store massive volumes of data and churn out analytical insights that can help them in effective decision making and growing new markets. It brings in a shift of focus from protracted and laborious infrastructure planning exercise to data-driven architecture. Data ingestion and processing framework becomes the cornerstone rather than just the storage.
Another perspective that comes with Data Lake building is the simplified infrastructure. Organizations spend a lot in building reliable stack for different nature of data and usually follow best fit approach to manage data. For example, relational databases have been the industry de-facto for structured data for ages. For the semi-structured and unstructured data coming through sensors, web logs, social media, traditional file systems were being used widely. At the end of the day, they have data marts bracketed by data structure, use cases, and customer needs but incur high capital and operational expenses. All such scenarios are easily addressed with Data Lake with a simplified infrastructure.
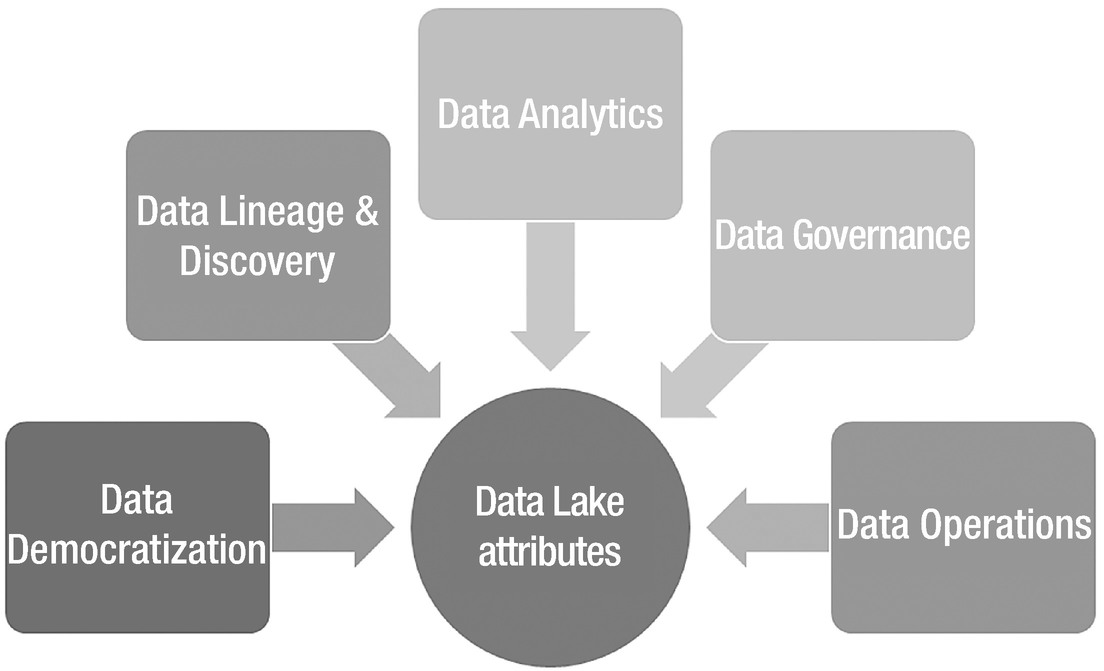
Data Lake attributes
Data Lake Characteristics
- 1.
Data lake must be built using a scalable and fault tolerant framework – the data lake concept focusses upon simplification and cost reduction without compromising on quality and availability. Apache Hadoop provides cost benefits by running on commodity machines and brings resiliency and scalability as well.
- 2.
Availability – data in the data lake must be accurate and available to all consumers as soon as it is ingested.
- 3.
Accessibility – shared access models to ensure data can be accessed by all applications. Unless required at the consumption layer, data shards are not a recommended design within the data lake. Another key aspect is data privacy and exchange regulations. Data governance council is expected to formulate norms on data access, privacy and movement.
- 4.
Strategy to track data lineage, right from the source systems up to consumption – the data lineage tracker provides a single snapshot of life cycle of data. Starting from its source onset, the tracker would depict data’s movement and consumption through layers and applications.
- 5.
Data reconciliation strategy from the source systems – from the data operations perspective, data reconciliation is a critical facet of quality.
- 6.
Data governance policies must not enforce constraints on data – Data governance intends to control the level of democracy within the data lake. Its sole purpose of existence is to maintain the quality level through audits, compliance, and timely checks. Data flow, either by its size or quality, must not be constrained through governance norms.
- 7.
Data in the data lake should never get disposed. Data driven strategy must define steps to version the data and handle deletes and updates from the source systems.
- 8.
Support for in-place data analytics – the data lake is a singular view from all the source systems to empower in-house data analytics. Downstream applications can extract the data from the consumption layer to feed a disparate application.
- 9.
Data security – security is a critical piece of Data Lake. Enterprises can start with a reactive approach and strive for proactive ways to detect vulnerabilities. Data-centric security models should be capable of building real-time risk profiles that can help detect anomalies in user access or privileges.
- 10.
Archival strategy – as part of ILM strategy (Information Lifecycle Management), data retention policies must be created. Retention factor of data, that resides in a relatively “cold” region of lake, must be considered, which is not a big deal in the Hadoop world though, but storage consumption multiplied by new data exploration, brings a lot of wisdom to formulate a data archival strategy.
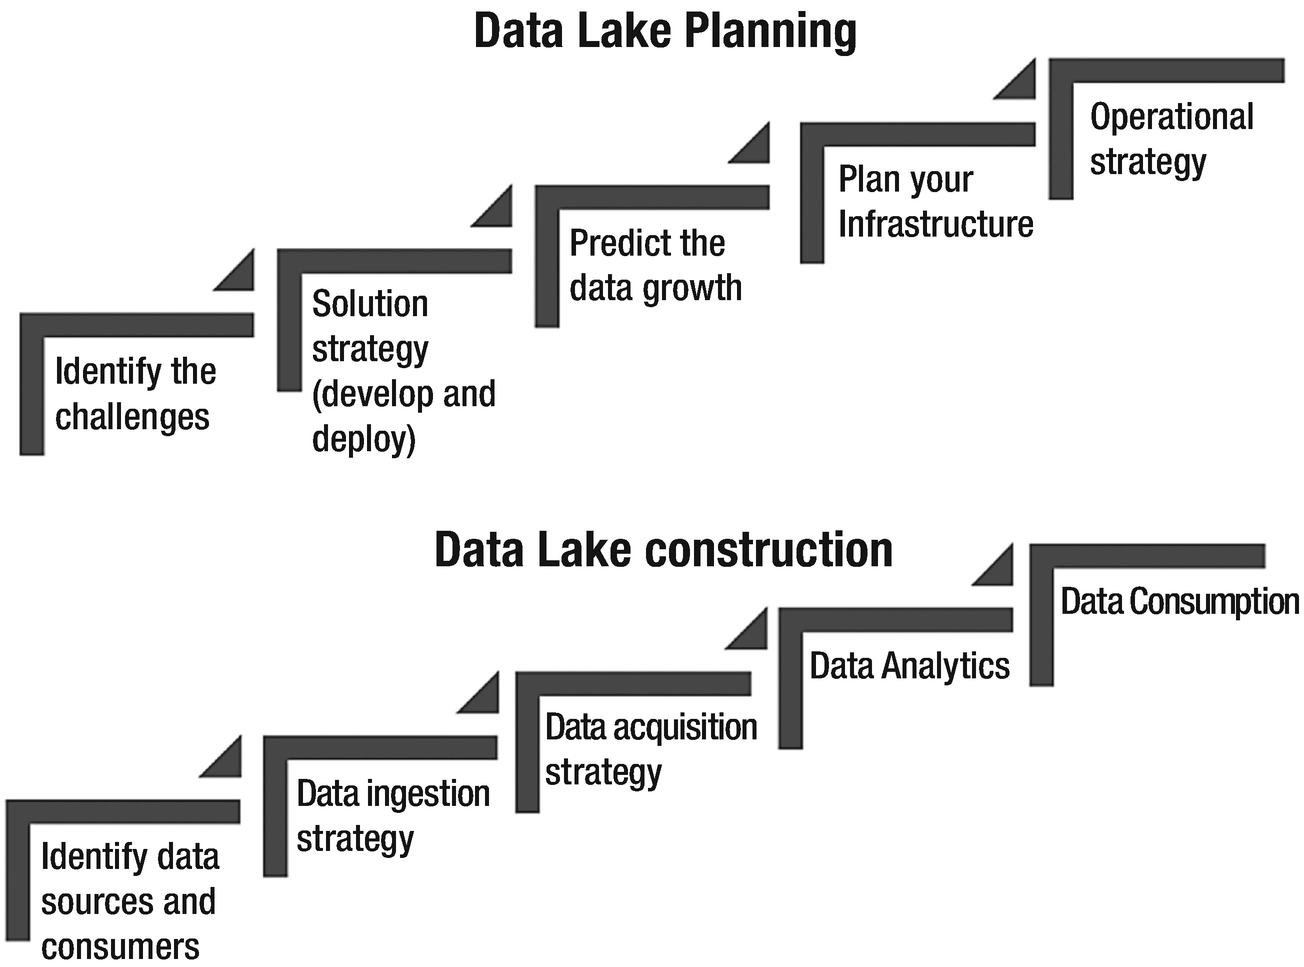
Steps involved in data lake planning and execution
Data lake vs. Data warehouse
Data warehousing, as we are aware, is the traditional approach of consolidating data from multiple source systems and combining into one store that would serve as the source for analytical and business intelligence reporting. The concept of data warehousing resolved the problems of data heterogeneity and low-level integration. In terms of objectives, a data lake is no different from a data warehouse. Both are primary advocates of terms like “single source of truth” and “central data repository.”
In basic terms, a data lake ingests all data in its raw format, unprocessed and untouched to build a huge data store. It goes super trendy with Hadoop due to its sheer volume and affinity for distributed computing. A data warehouse, on the other hand, extracts data from the source systems that pass through a processing layer before settling down in different schemas (schema on-write). All data in a warehouse is processed, well modeled, and structured. In fact, the building paradigm that both the stores follow can be closely associated to its target users. Data warehouse targets business professionals, management, and business analysts who expect structured analysis reports at the end of the day. On the contrary, a data lake opens a war room for data scientists, analysts, and data engineering specialists from multiple domains for data crunching, exploration, and refining.
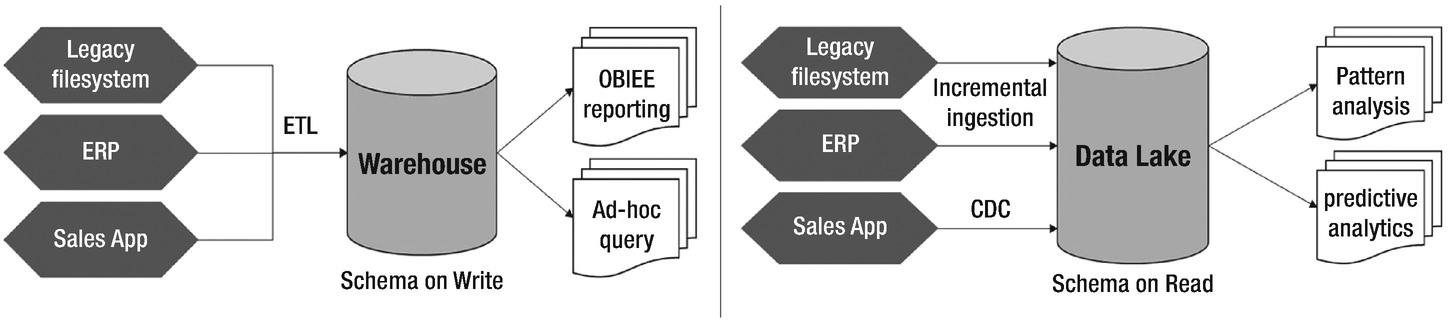
Data warehouse versus Data Lake
A data warehouse follows a pre-built static structure to model source data. Any changes at the structural and configuration level must go through a stringent business review process and impact analysis. Data lakes are very agile. Consumption or analytical layer can be modified to fit in the model requirements. Consumers of a data lake are not constant; therefore, schema and modeling lies at the liberty of analysts and scientists.
Various analogies have been drawn to clarify the difference between the two worlds . What differentiates a Cricket World Cup from the Olympics is exactly how a warehouse is different from a data lake.
How to achieve success with Data Lake?
The strategy to hold the data and extract its real value plays a vital role in justifying the capital and operational expenses incurred upon building up the data lake. There might be questions around data classification and its criticality quotient. How long is the data valuable to a business? What’s the measure of potential in a data slice? Let us check out a few key drivers that can ensure a data lake’s success.
Facebook works with 30+ Petabytes of user-generated data. Google is concerned with every bit that we do in a day. Data-driven companies never shy away from gathering and storing data. Vision is loud and clear – data has no expiration date. Every bit of data carries a value that can be maximized. Therefore, you must have a clear understanding of who the consumers are, what use cases are served by the data lake currently, and most importantly, what’s the vision?
Vision drives a lot of data strategies. Data late curators need to understand what is being consumed and what is needed. First, the pace at which data acquisition occurs determines the measure of data lake enrichment as an asset. This lifts the data ingestion barriers, allowing data to grow centrally and restrict duplication and proliferation of data. Second, the rate at which raw data gets consumed indicates the measure at which it becomes dormant. This will push data stewards to rethink data archival strategy and create space for fresh data from existing and new sources.
Data governance and data operations
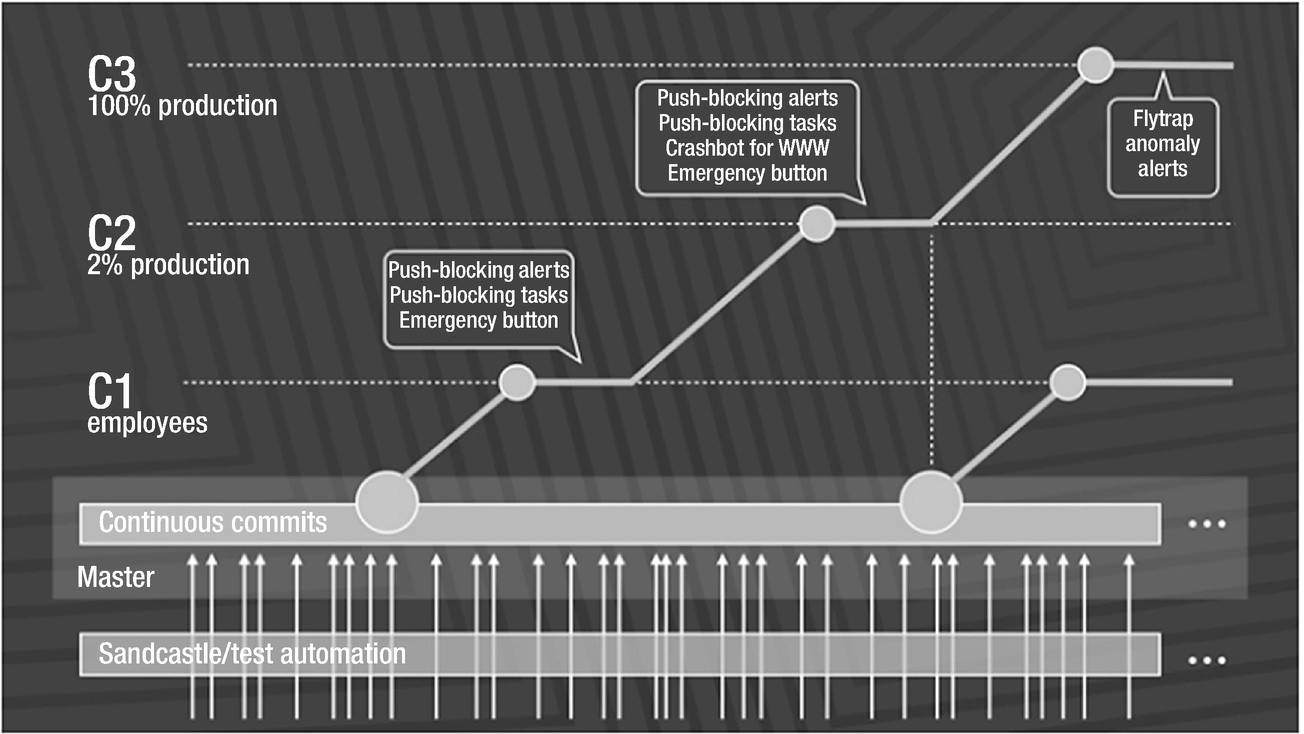
Rapid release at massive scale. Source: Rossi, Chuck; “Rapid Release at Massive Scale,” August 31, 2017, https://code.facebook.com/posts/270314900139291/rapid-release-at-massive-scale/
Data Lake, in its initial stages, acts as a playgroup to try out pre-built analytical models that are well versed with the resident data. As data lake matures to an instrumental level, it opens a war room for data scientists and analysts to be ruthless with data churning exercise.
- 1.
DevOps handshake – Data lake operations desk accompanies DevOps team at critical stages of development and deployment
- 2.
Availability and maintenance – Operations shoulder the responsibility of ensuring availability of the data lake infrastructure. They plan and execute platform upgrades and coordinate periodic maintenance activities.
- 3.
Release management – Codebase maintenance and production releases are guarded by data lake operations.
- 4.
Monitoring of data flows and capture key data lake metrics – Data lake operations employ a layered support model for continuous monitoring of data movement from mirror to analytical and further consumption.
- 5.
Runbook and standard operating procedures – Documents that describe formal and ad-hoc exercises to be carried out by data lake operations.
When Facebook acquired WhatsApp, both had different privacy norms, which further called for an investigation on data sharing. The Electronic Privacy Information Center and the Center for Digital Democracy filed a complaint with the Federal Trade Commission (FTC) stating “Specifically, WhatsApp users could not reasonably have anticipated that by selecting a pro-privacy messaging service, they would subject their data to Facebook’s data collection practices,” leading to violation of Section 5 of the FTC Act, 15 U.S.C. § 45(n). It led to the revision of data governance laws at Facebook .
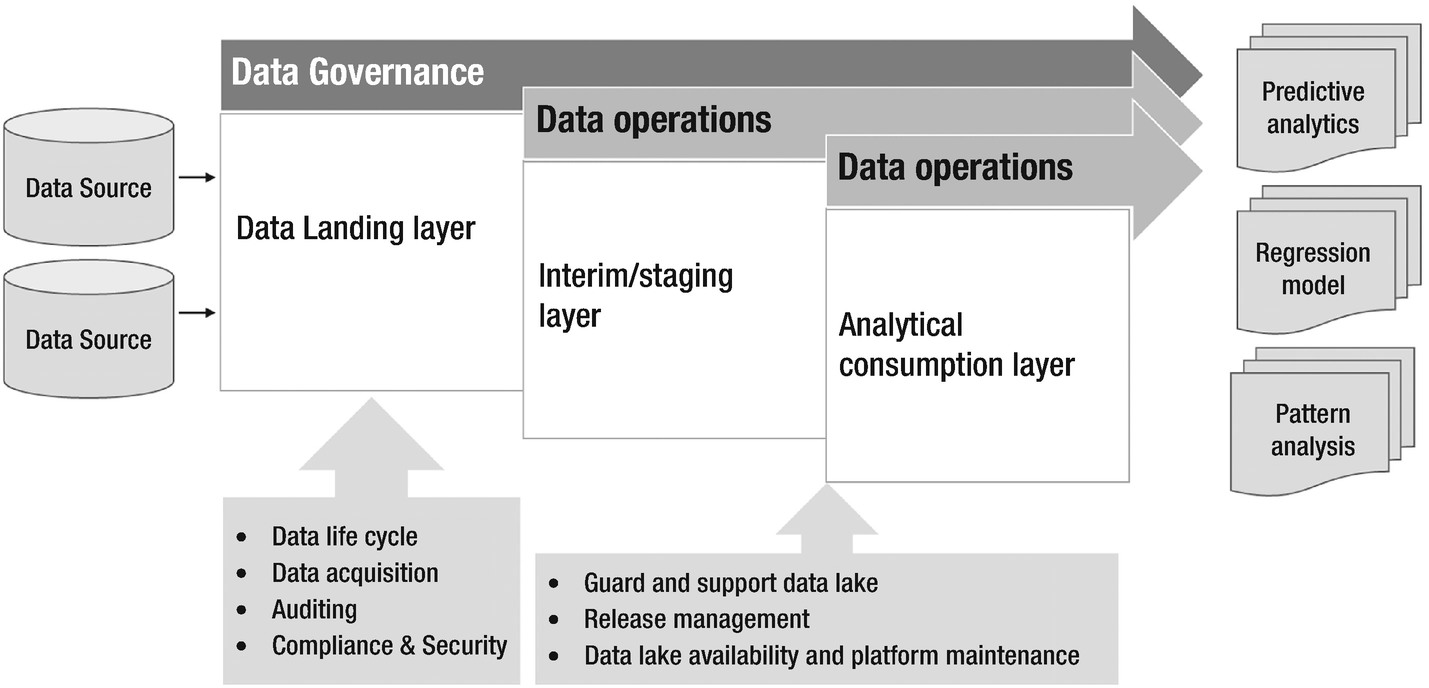
Concentration of data governance and data operations in a data lake
- 1.
Data Acquisition – Formulate a strategy to idealize the data lake as an asset. This piece of governance council defines what organizational data can be lodged within the lake. When should it come and how?
- 2.
Data catalog – Cataloging is a critical piece when explicating data lake roadmap and vision. Data scientists and analyst can be crucial in providing feedback and proposing council on what data could be vital for effective analytics.
- 3.
Data organization – The governance council should also focus on structure and format of data to enrich and maintain synergy within the data lake.
- 4.
Metadata management – Data governance stewards keep an eye on data quality, profiling, and lineage. It helps in the evolution of data categories like internal, confidential, public, and others.
- 5.
Compliance and security – Deal with data security, access management, and abide by the organization’s compliance policies.
Effective data governance elevates confidence in data lake quality and stability, which is a critical factor to data lake success story. Data compliance, data sharing, risk and privacy evaluation, access management, and data security are all factors that impact regulation.
Data democratization with data lake
One of the appreciative traits of a data warehouse is that each ETL process or development holds a definite business objective. Every penny of data in a warehouse undergoes a thorough validation and approval process. On the other hand, data lake has been an ardent supporter of data democratization.
To withstand today’s data-driven economy, organizations tend to work with lots of data. The datasets exist in different shapes and sizes and may follow different routes of consumption. However, this data is discoverable to only those who are familiar with data lineage. Non-data practitioners may find it tedious to explore and play with data of interest. Half of their time is wasted in data discovery, data cleansing, and hunting down reliable sources of data. Data dwelling in silos prevents liberation of data to its full potential.
Data democratization is the concept of diluting data isolation and ensuring that data is seamlessly available to the appropriate takers on time. In addition to data agility and reliability, data democratization lays down a layer of data accessibility that helps in discovering data quickly through custom tools and technologies. The objective is to empower data analysts with swift access to the veracious data set, so as to enable rapid data analysis and decision making.
- 1.Curated data layers – Curated data layers help in flattening out data models for functional users. These users may be interested in only 10% of total raw information but could struggle in narrowing down the data of interest. The objects contained in curated layers are intended to provide sliced and diced data in a flattened-out structure. Figure 1-12 shows the SALES curated layer built on top of six base layer tables.
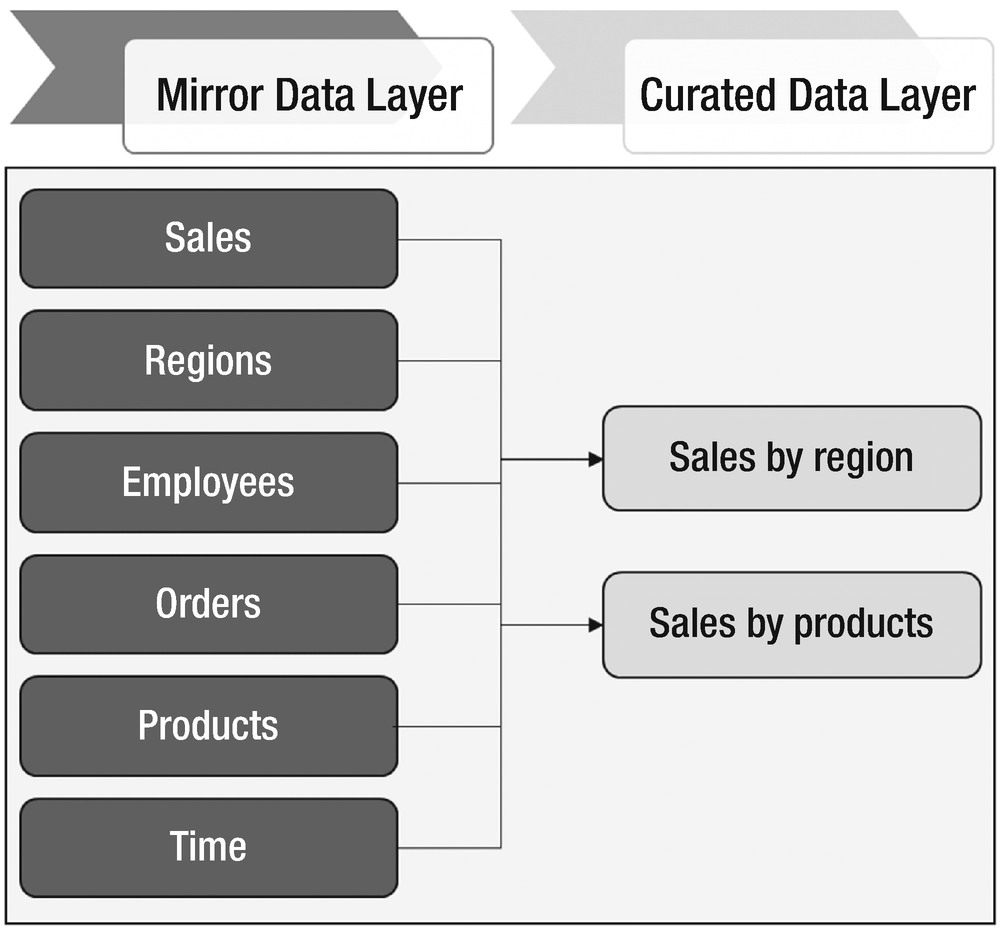 Figure 1-12
SALES layer curated from base data layer
- 2.
Self-service platforms – Self-service portals may act as a data marketplace wherein a user can traverse through data sets, discover based on functional implications, mold and transform data representations, and download them for personal records. In the backend, the framework can work through with APIs for dataset transformation, data discovery, and extraction.
By collating all the key elements, data democratization cuts across the concepts of data nirvana and open data paradigms. Data democratization can be achieved in an enterprise data lake. The basic idea behind data lake is to treat all the data equally relevant and insource into a single platform without the barriers of architecture, models, or predefined framework.
Let us now talk about concerns connected to data democratization. An argument that has gained community support states that democratization catalyzes the ability of a data lake to become a data swamp. Keep in mind that swamps are created when data movement is unregulated and a lot of irrelevant data houses are in the lake for no reason. However, we need to democratize data to affiliate an open data concept by easing data discovery through self-service frameworks. Subject matter experts with diversified expertise can access required data easily and contribute to organizational insights. Few organizations have raised security and integrity concerns of democratizing data for the entire workforce. This adds to the responsibilities of the data governance council who are in charge of data categorization. Although data security has been on the rise over the last few years, the surface area of the company’s internal and confidential data should still be restricted.
Fast Data - Life beyond Big Data
Today, Big Data analytics is popular. Enterprises not into data analytics are extinct or endangered. While there are many still getting their feet wet, there were organizations who not only achieved “big data” milestone well before, but also came up with cases that demanded stretched-out capabilities of big data.
One of the facts that we realized in this chapter is that Big Data is not just “Big”, but it is fast, precious, and relatively mysterious. Big Data is an abstract trend while Data Lake is an ecosystem that implements big data analytics. Data from the source systems, in its original format, be it structured or unstructured, flows into the data lake at different magnitudes. It may be in the scale of gigabytes per second or terabytes per hour. However, the data settles down first and then gets processed to build an analytical layer. Consumption models are oblivious to the fact that what they consume has gone through levels of functional and logical transformation. A lineage tracking exercise will reflect the lag between the data generation phase and the consumption phase. This lag is accredited to the ETL pipeline in the data acquisition layer and the time consumed during transformation, which leads to delayed analytics. Let us see a few use cases.
A telecom company monitors all international calls in the country. It applies the NLP algorithm on voice intercepts to filter out suspicious calls and send out a notification to the security agencies. The expectation is to have monitoring in real time and any delayed alert will be treated as an opportunity missed. Although data volume and velocity are high, ingestion and analysis are critical.
Another scenario could be a cricket analytics website that needs to predict if a batsman will be bowled or run out on the next ball (depending on his current as well as last 10 outings). Cases like these share a common trait. It is not the data size that matters but what matters is how fresh the data is at the time of producing actionable insights.
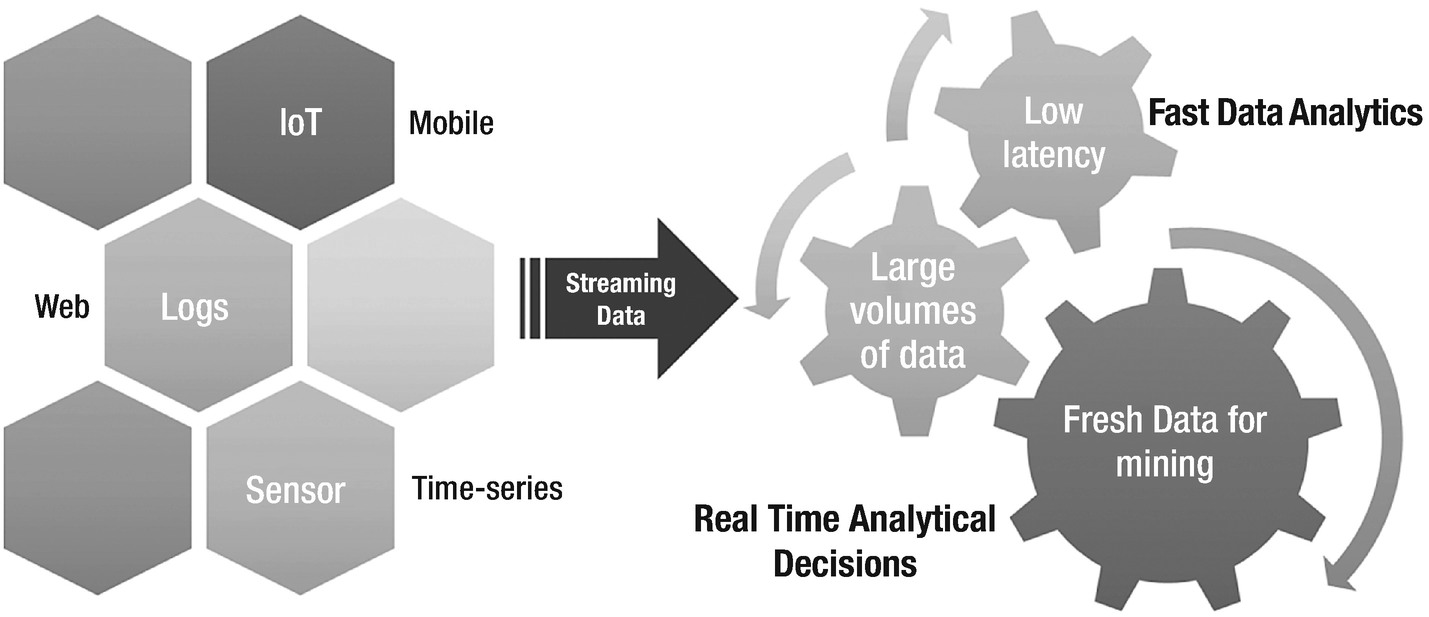
Fast data analytics is the next gen analytics engine where it focuses on time-sensitivity factor of data for analytics
What fast data analytics achieves is proactive real-time insights. It can play a significant role in reducing latency, enhancing accuracy, faster decision making, and improved customer experience. Applications that leverage data from sensors and machine to machine communication in the Internet of Things provide the best fit use case for fast data analytics.
Conclusion
Let us quickly revisit the concepts covered to introduce a data lake. Big data can be structured or unstructured and is relatively big in terms of volume, velocity, and value. Market analysts predicted big data to be a key aspect to several business insights, provided it is appropriately stored and analyzed. The Organizations realize the value hidden in this heap but huge investments in storage and building efficient computing models was a challenge. In 2004, Google’s concept of distributed file systems and distributed processing frameworks comes to the rescue. The evolution of the Hadoop distributed file system has been a rapid expedition as it enabled storage on relatively cheap commodity hardware. MapReduce, the distributed computing framework, instantiated processing framework to connect with data for processing.
Data lake is an ecosystem for the realization of big data analytics. What makes data lake a huge success is its ability to contain raw data in its native format on a commodity machine and enable a variety of data analytics models to consume data through a unified analytical layer. While the data lake remains highly agile and data-centric, the data governance council governs the data privacy norms, data exchange policies, and the ensures quality and reliability of data lake.
While big data trends on a run, fast data analytics is the one that is picking up the speed lately. It is different from big data and deals with the same volumes and structures of data but endeavors data freshness more than data volume. Recently, enterprises have started realizing the true essence of data usage. All big data cannot be fast and at the same time, all fast data need not be big. The data lake ecosystem can complement the two concepts entirely and empower organizations with both big and fast flavors of data.
In the next chapter, we will start off with a deep dive into data ingestion principles. We will understand batched ingestion, real-time data movement, and change data capture concepts along with architecture and design considerations.