Splunk is the world’s leading operational data intelligence platform. It is used by software developers, site reliability engineers, DevOps engineers, data scientists, security professionals, and business analysts. It can parse and index large quantities of unstructured machine data (in many cases, hundreds of terabytes per day). Data is ingested into Splunk using varieties of means, and I find one big advantage being that there is no data source that cannot be ingested into Splunk. The Splunk platform can help to reduce incidents, improve observability, shorten MTTR (mean time to repair), and reveal deeper insights. With a little bit of learning, you will also find Splunk to be a joy to work with. I’ve personally interacted with hundreds of Splunk users who love the versatility and richness of the platform. The Splunk platform provides an end-to-end solution to manage your machine data, regardless of where it lives or how big it is.
In this chapter, I’m going to introduce you to the Splunk platform and get into the problems that it solves. I’ll show you how Splunk can help organizations of all sizes make effective use of machine data. I’ll provide an overview of Splunk platform architecture and walk you through various use cases of Splunk. Then, I’ll move on to introduce Search Processing Language (SPL), the language of the Splunk platform. I’ll show you how to navigate the Splunk Web interface, which is the primary interface you will be using to run searches. Finally, I’ll have you run your first SPL query.
Machine Data
Splunk enables you to collect, organize, and make use of machine data, at scale. But first, let’s define what machine data is.
What Is Machine Data?
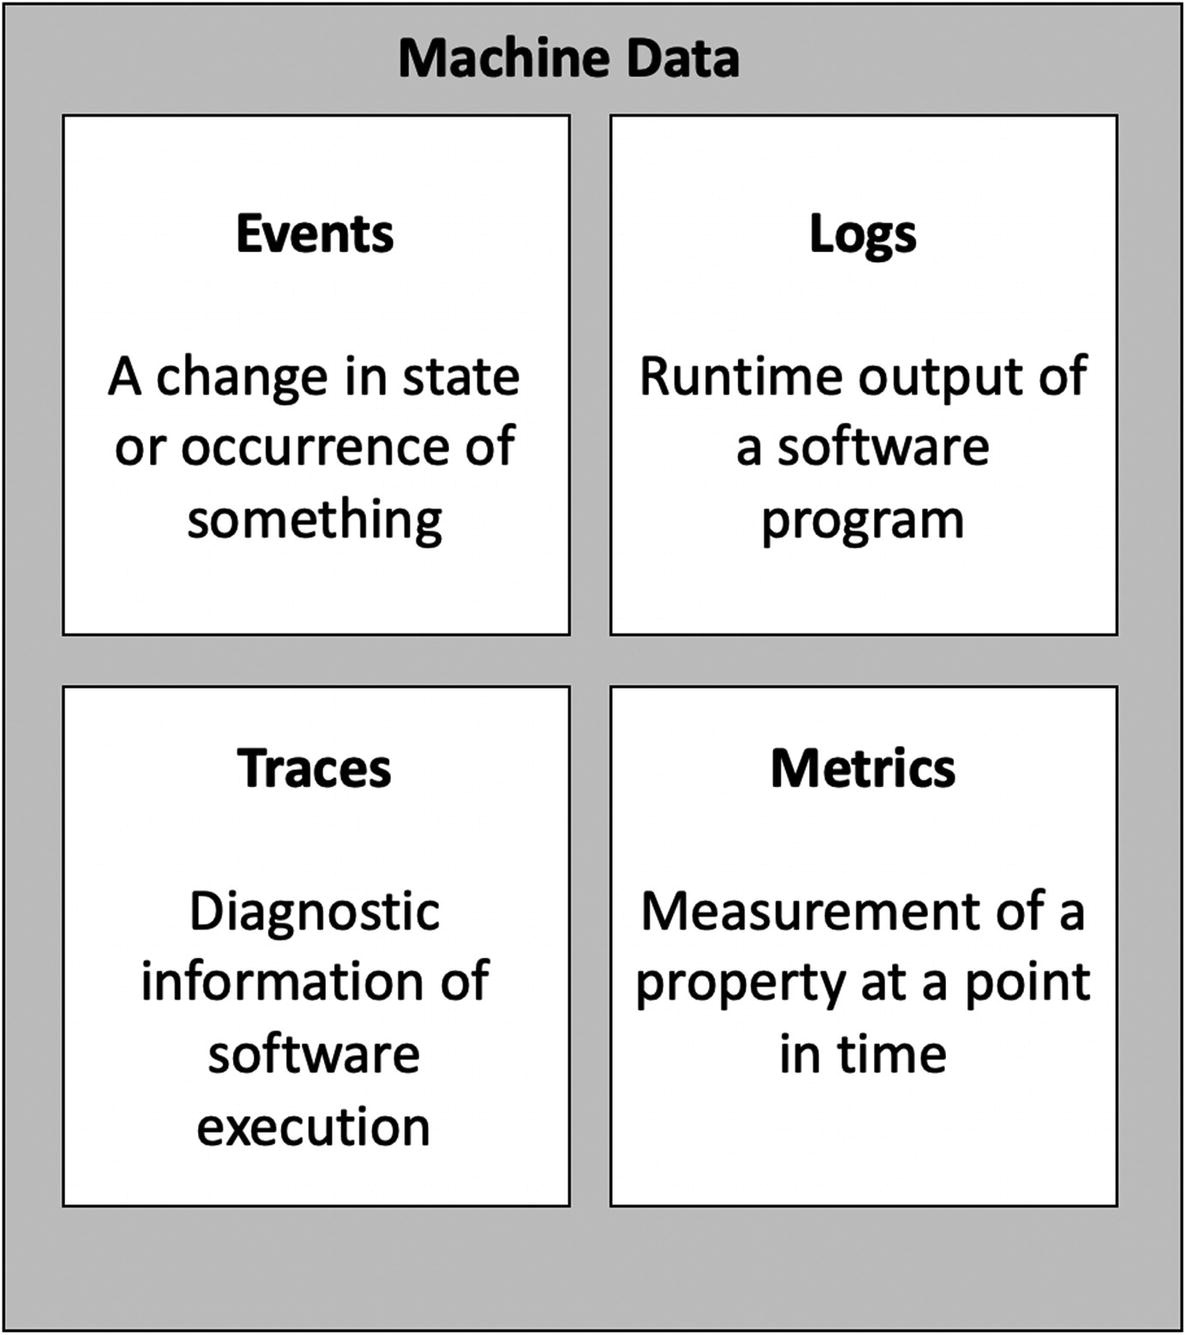
The four categories of machine data
Events
A sample Windows event
In Splunk, an event is a single piece of indexed data. Data ingested by Splunk is broken into events and stored in the index.
In general, event data can be structured or semistructured though it depends on the system that generates the events.
Logs
A sample web access log
Logs make up the biggest portion of the machine data ecosystem in organizations. They are typically unstructured, and because of that, they are difficult to index.
Traces
Traces are diagnostic information produced by software as it executes. They are extremely valuable for analyzing the end-to-end flow of a transaction. They typically contain information such as contextual data, runtime parameters, and program stack traces. Due to the rich set of information they contain, traces are often used to diagnose complex problems that traverse multiple systems. Traces are generally stored as text files.
A sample java stack trace
The content and format of the trace files are dependent on the software that creates them. Because the trace files can get very large in a short period of time, they may be produced on an ad hoc basis.
Metrics
A sample cpu metric
Time-Series Nature of Machine Data
Each event in the machine data is often accompanied by a timestamp. Storing time-series data significantly differs from traditional database storage. With time-series information, data is typically stored in time-based bins (or buckets). Further, data management is strongly time oriented. For instance, data retention policies can be implemented to meet various user needs based on the age of the data.
The Value of Machine Data
It is easy to overlook the value you can derive from machine data. However, I’ve seen scores of teams solving varieties of problems using machine data. For example, machine data can be used to implement real-time error rate monitoring of a service. Here are the four major areas where you can utilize machine data.
IT Operations and Monitoring

Raw Error Rate of an application over time, which is derived from machine data
Security and SIEM
Machine data is a treasure trove for uncovering fraud and illicit security attacks against your systems. Many organizations use machine data in the form of audit logs for identifying malicious login attempts. The web access log can help you identify a DDoS (Distributed Denial of Service) attack by looking for patterns in the client IP field. With a powerful query language such as Splunk Search Processing Language (SPL), an analyst can run effective ad hoc queries and correlate events across many sources. Further, by collecting and indexing audit logs, you can create useful reports to meet compliance requirements.
Business Analytics
Using machine data in business analytics is relatively a new user case compared to IT analytics and security. Traditionally, business analytics is performed using transactional data stored in huge data warehouses such as Teradata. But machine data contains several bits of useful information that are often overlooked though very handy for business analytics. For instance, you can measure the geographical distribution of your sales volume using web server and application server log files. And with the adequate machine data, you can also automatically discover business process flows.
AIOps
AIOps (Artificial Intelligence for IT Operations) is fast emerging as a disruptive technology. AIOps comprises related technologies such as machine learning, predictive analytics, and anomaly detection. Collecting and indexing all of the machine data in your organization opens doors for many innovative use cases using AIOps.
Splunk provides Machine Learning Toolkit, an app that you can install on top of Splunk Enterprise to use machine learning algorithms on your data.
The Shortcomings of Machine Data
If machine data is so useful, then why aren’t all organizations making the full use of it? There are four reasons why machine data does not get the attention it deserves.
Size
Machine data can be extremely large in terms of size. In organizations of any size, machine data can easily grow to several terabytes per day (especially when collecting logs from network devices). In web-scale companies, it can even reach petabytes. Collecting and ingesting this much data requires well-designed software platforms such as Splunk Enterprise. Traditional data warehouses don’t help much as they are not designed for indexing time-series data. Big data platform such as Hadoop requires complex map-reduce jobs to retrieve data as they are primarily used for batch loads.
Speed
Machine data has enormous velocity. It is not uncommon to see millions of events per second, especially when you collect metrics from operating systems and network devices. This makes it hard for reliability collecting and indexing them. Once again, a well-designed platform such as Splunk will need to be deployed if you want to make full use of machine data.
Structure
Logs, the largest machine data category, largely tend to be unstructured. This makes it difficult to parse and index. Traditional data stores require the data to be either structured or, at least, semistructured. Splunk platform solves this problem by employing schema-on-read technology. During parsing and indexing, Splunk extracts just a few metadata fields such as timestamp, source, sourcetype, index, index time, and host. All other field extractions happen during the search-time. This means that you only need to have some high-level idea about the machine data being ingested (the most important ones being line-break pattern and timestamp). In schema-on-write however, you need to fully define the fields in the machine data ahead of indexing.
Distribution
Machine data is everywhere. Server log files, application traces, IoT devices logs, sensor outputs, and voice call records are examples of machine data. Since the data is widely spread out and often difficult to collect, many organizations don’t even consider the possibility of collecting and ingesting all of machine data in one central system. Recent explosion in containers and cloud platforms make it even more complex.
The Splunk Operational Data Intelligence Platform
Splunk is the industry leader in operational data intelligence. With its powerful Search Processing Language (SPL), which is the focus of this book, and rich set of visualizations, Splunk aids in solving the problems with the machine data mentioned earlier. In addition, the Splunk platform employs an extensible architecture. This has paved ways for thousands of community-developed Splunk apps, which are a set of configuration files, program files, and visualizations that extend Splunk’s capabilities.
Primary Functions of Splunk
There are five functions of Splunk. Each of these functions addresses a specific area of handling machine data. Let us review them in detail.
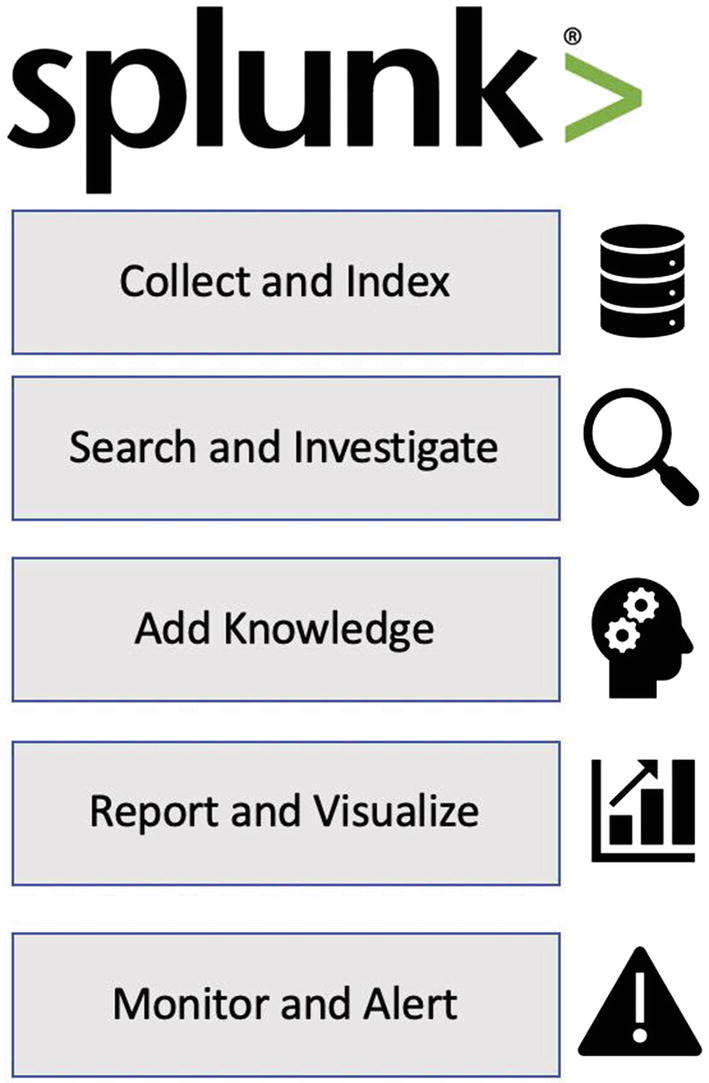
Five main functions of Splunk operational data intelligence platform
In the Collect and Index function, Splunk offers several ways to receive data from machine data sources. The most common way is using Splunk Universal Forwarder, which is a piece of software installed on the machine data hosts. There are many other ingestion mechanisms such as Splunk HTTP Event Collector and Splunk DBConnect. The collected data is parsed and indexed in indexes, which are flat files that consist of raw data and time-series index files.
In the Search and Investigate function, Splunk provides Search Processing Language (SPL) to query the indexed data. With its powerful SQL-like and Unix pipe syntax, SPL provides unprecedented flexibility when it comes to slicing and dicing your machine data. SPL provides more than 140. In addition, because of schema-on-read, you are able to manipulate, group, and correlate data on the fly. SPL provides a family of commands known as transforming commands using which you can generate reports and visualizations just with one or two commands.
In the Add Knowledge function, Splunk offers a variety of tools such as lookups, field extractions, tags, event types, workflow actions, and data models. These tools help you to make sense of your machine in the quickest and most effective way.
In the Report and Visualize function, Splunk offers the capability to produce stunning reports and dashboards and even schedule them for automatic delivery. Splunk Search Processing Language (SPL) provides a set of commands called transforming commands such as stats and timechart that instantly creates varieties of tables and visualizations based on the search results.
Finally, in the Monitor and Alert function, Splunk enables you to monitor your systems and trigger alerts based on the thresholds you set. There are varieties of actions you can perform when an alert is triggered, the most common one being email alerts. Splunk can also call a REST endpoint using HTTP post request. In addition, you can write your own action using Splunk’s custom alert action framework.
Architecture of Splunk Platform

High-level architecture of Splunk operational data intelligence platform
- 1.
Indexer
- 2.
Search head
- 3.
Forwarder
Let us take a look at each of the preceding components in detail.
Indexer
The indexer is the core Splunk Enterprise process which converts raw data into searchable events and stores them in indexes. During indexing, the indexer breaks the raw data into events, extracts timestamp (and few other metafields), and writes the data to the disk. It is also the process that searches and retrieves the indexed data. In Unix systems the indexer process is named splunkd. In a distributed environment, the indexer is also called search peer . Many indexers are grouped in a cluster, and data is replicated among cluster members.
Once data is indexed, it cannot be modified.
Search Head
The search head handles the searches run by the users. It is a Splunk Enterprise process that employs map-reduce architecture. It distributes search requests (the map phase of map-reduce) to a group of indexers (also known as search peers) where the searches get executed. Search head receives the search results and merges them (the reduce phase of map-reduce) before sending the results back to the user. Search heads can also be grouped in a search head cluster. Search head clusters provide high availability and load balancing. They also help in controlling access to the indexed data. Typically, when you log in to the Splunk Web interface, you are logging on to the search head.
It is possible to have the same splunkd process assume both indexer and search head roles. This setup is common in dev/lab environments.
Forwarder
The forwarder is a Splunk Enterprise software process that collects data from the machine data host. The most common type of forwarder is the Splunk Universal Forwarder which is typically installed in Unix and Windows operating systems. Based on the configuration, universal forwarder collects and sends machine data to indexers. Universal forwarders can also send the machine data collected to a special type of forwarders called heavy forwarders. Unlike universal forwarders, heavy forwarders parse the data before sending them to indexers. Heavy forwards can also optionally index the data locally.
There are other types of Splunk Enterprise components such as deployment server, search head deployer, cluster master, and license master. They are typically present in large-scale distributed environments. There are other books that cover the full range of Splunk features. However, as the focus of this book is on the Search Processing Language, these components will not be covered in detail. So let’s dive into the language next.
Introducing Splunk Search Processing Language (SPL)
Splunk Search Processing Language (SPL) is the language of the Splunk platform. It is the language used to perform searches against the indexed data. With its versatile SQL-like and Unix pipe syntax, SPL offers a very powerful way to explore and investigate your machine data. You usually run SPL queries using the Search & Reporting app that comes by default with Splunk Enterprise. You can also use Splunk REST-API and command-line interface (CLI) to run SPL queries. The search is executed by Splunk Enterprise, and the results are shown in the user interface. By employing certain commands in SPL, you can also generate reports and visualizations of your search results.
Syntax of SPL
The Search Processing Language is a hybrid of SQL (Structured Query Language) and Unix pipe. Just like any other query language, SPL follows certain syntax. When a query has a syntax error, it does not execute, and an error is shown indicating the problem with the syntax. Let us take a look at the general syntax of SPL. An SPL query can consist of any or all of the following.
Commands
stats
eval
timechart
table
fields
At the start of an SPL query, the search command is implied so you don’t need to explicitly type it. The search command must be specified if it comes later in the search pipeline.
Literal Strings
Error
i/o Exception
“java.lang.NullPointerException”
“Order processed successfully”
“Program quit unexpectedly”
Key-Value Pairs
index = main
sourcetype = userPortal:app:errorLog
status = 500
result = “Order processed successfully”
log_level = ERROR
If the field name contains spaces, use single quotes around them, for example, ‘user id’ = jsmith.
Wildcard
status = 5* ← Retrieves events that have status starting with 5. For example, 500, 503, and 504
“java.net.Connection*” ← Retrieves events that have the string java.net.Connection followed by zero or more of any character. For example, java.net.ConnectionRefused, java.net.ConnectionTimedOut
“Login for user*failed” ← Retrieves events that have the string “Login for user” followed by zero or more of any character, followed by the string “failed”
“Account number:*activated” ← Retrieves events that have the string “Account number:* followed by zero or more of any character, followed by the string “activated”
Using the * wildcard as the first character in a string is very inefficient. For example, avoid searching for strings like “*error”.
You can also use the like function of eval command to perform SQLite-style wildcard matching. The like function supports percent ( % ) to match multiple characters and underscore ( _ ) to match a single character. We discuss eval and like in Chapter 2, “Calculating Statistics.”
Comparison Operators
=
==
!=
>
>=
<
<=
percentage_utilzation < 50
response_time >= 500
The operators = and == are treated the same when comparing.
Boolean
AND (implied if not explicitly specified)
OR
NOT
log_level = WARNING OR log_level = ERROR
result = Failed AND user = jsmith
output = “Login succeeded” NOT admin
result = Error OR (result = Pass AND response_time > 500)
The Boolean operators must be in uppercase. You can also use parenthesis to force precedence.
Functions
…| stats avg(response_time). ← Calculates the average response time
…| timechart perc95(processingTime) ← Calculates the 95th percentile of processingTime
…. | eval percentSuccess = round(success_rate,2) ← Rounds the success_rate to two decimal places and stores the result in a new filed percentSuccess
eval command calculates an expression and stores the result into a field.
Arithmetic Operators
SPL arithmetic operators
Arithmetic operator | Meaning | Example |
|---|---|---|
+ | Sum | … | eval counter = counter + 1 |
- | Subtract | … | eval price = total – discount |
* | Multiply | … | eval tax = income * .20 |
/ | Divide | … | eval dollars = pennies / 100 |
% | Modulo | … | eval rem = num % 2 |
The Search Pipeline

As indicated in the preceding figure, as you traverse through the pipeline from left to right, the results are increasingly narrowed (although in some cases, you may manually add new fields by using eval, lookup, and subsearches). While troubleshooting why some SPL queries don’t return the results you want, it is a good idea to keep removing the segments from right to left to review the intermediate results table.
Do not worry if you don’t fully understand the SPL query at this point. We will cover the commands such as top and fields later in this book.
Navigating the Splunk User Interface
You interact with Splunk using Splunk Web, a web-based interface that comes with the Splunk product. Search & Reporting app (also known as Search app) is a preinstalled app that you use to run searches and create reports. It is important to understand all the features of the Search app to aid in effective use of Splunk.
An app in Splunk is a set of configuration files and/or visualizations installed on Splunk Enterprise platform. App is the primary mechanism by which the basic functionality of Splunk is extended.
Installing Splunk
The best way to learn Splunk is to use your own Splunk environment (preferably nonproduction) as you will be searching the data you are already familiar with. But if you don’t have access to a Splunk environment, it is easy to download and install a trial version on your PC, Linux, or Mac. The trial includes all features of Splunk with 500MB/day ingestion limit for 60 days. After 60 days, the license automatically changes to free version at which point certain features like alerting and access control are disabled. You can also use Splunk Cloud Trial which is a SaaS (Software as a Service) offering from Splunk. Use the following links to get started:
Splunk Enterprise download: https://www.splunk.com/en_us/download/splunk-enterprise.html
Splunk Cloud Trial: https://www.splunk.com/en_us/campaigns/splunk-cloud-trial.html
Simply follow the instructions from the preceding links to install and start up Splunk. The default port for Splunk Web is 8000.
During the install, you would be asked to set up an administrator user and password. By default, the administrator user is called admin. Make sure to keep the credentials for the administrator user safe.
Logging onto Splunk Web
Log on to Splunk Web interface using a web browser. If you had installed the trial version on your PC, Linux, or Mac, the URL to access Splunk Web will most likely be the following:
http://localhost:8000

Splunk Web launcher home page
If you are using your organization’s Splunk environment, depends on how your Splunk administrator has configured access control, your home page may look different.

Splunk Web Search & Reporting home page
Let us look at the various sections of the Search & Reporting home page and their use.
1. Splunk Bar

2. App Bar

3. App Icon and Label
The current app icon and label show the app that you are currently on. It is a good idea to periodically make sure that you are in the correct app as you navigate through different screens within Splunk Web.
4. Search Bar
The search bar provides a text field for you to enter the SPL query. The keywords are color coded as you type. For example, the commands usually appear in blue, and functions are in pink and so on. To execute a search, you can simply press Enter, or click the magnifying glass icon at the right.
5. Time Range Picker
The time range picker enables you to specify the time range for your query. The default time range can be configured by your Splunk administrator. I always suggest setting the time frame as narrow as possible to get the best search performance. You can pick from any of the preset time frames or use advanced options to specify a custom time frame.
6. Search History
You can retrieve your previously run searches using search history. This can come in handy if you don’t want to retype your SPL queries. You can also search within the search history using the filter found at the top of the Search History pane.
If you are using Splunk in a search head cluster setup, depends on which search head member you land on when you log in, you may not see your previously run searches. By default, search history is not replicated among search head members. An administrator can override this by configuring conf_replication_include.history=true in server.conf.
Write Your First SPL Query
At this point, you have learned the basic functionality of Splunk, a high-level understanding of SPL syntax and the search interface. Let’s move ahead by actually writing your first SPL query. In this section I’ll walk you through uploading Splunk tutorial data, and we’ll start querying.
Using Splunk Tutorial Data
While using your own data in your organization is certainly helpful to learn Splunk, to follow along the examples I am going to show you, you will need to install the Splunk Enterprise trial in your PC/Mac and upload the data sets I provide. This way, you can avoid mixing the tutorial data with your organization’s data. See the section “Installing Splunk” in this chapter to find the instructions for installing Splunk trial version.
Download Splunk Tutorial Data Zip File
You will need to download the Splunk tutorial data zip file using the following link:
You can always search Splunk product documentation at docs.splunk.com to locate the Splunk tutorial download files.
The name of the tutorial zip file is tutorialdata.zip.
Download the zip file tutorialdata.zip into your PC/Mac. You will be uploading this file into Splunk in the next step.
Do not unzip the downloaded file. You will need the zip file to be uploaded to Splunk.
Add Splunk Tutorial Data Zip File into Splunk
- 1.
Log in to Splunk Web as administrator.
- 2.Click Add Data. See Figure 1-8.
 Figure 1-8
Adding data to Splunk
If you are using your organization’s Splunk environment, you may not find the Add Data icon. This happens when your Splunk administrator has disabled this option. Use Splunk Enterprise trial if this is the case.
- 3.
Click Upload. See Figure 1-9.

Uploading data from your computer
- 4.
Click Select File, and choose the tutorialdata.zip file you had earlier downloaded. Make sure the file is in zip format. See Figure 1-10.

Selecting tutorialdata.zip to upload to Splunk
- 5.
Click Next. See Figure 1-11.

Continuing uploading tutorialdata.zip into Splunk
- 6.
In the Input Settings screen, choose the main index and click Review as shown in Figure 1-12.

Selecting target index while uploading tutorialdata.zip
- 7.
Click Submit in the Review screen. Note that the hostname defaults to the hostname of your computer. See Figure 1-13.

Reviewing the settings before starting the indexing process
- 8.
Splunk uploads and indexes the data. If there are no errors, you see a success message as shown in Figure 1-14. Click the Splunk Enterprise icon at the top left to go back to the home screen.
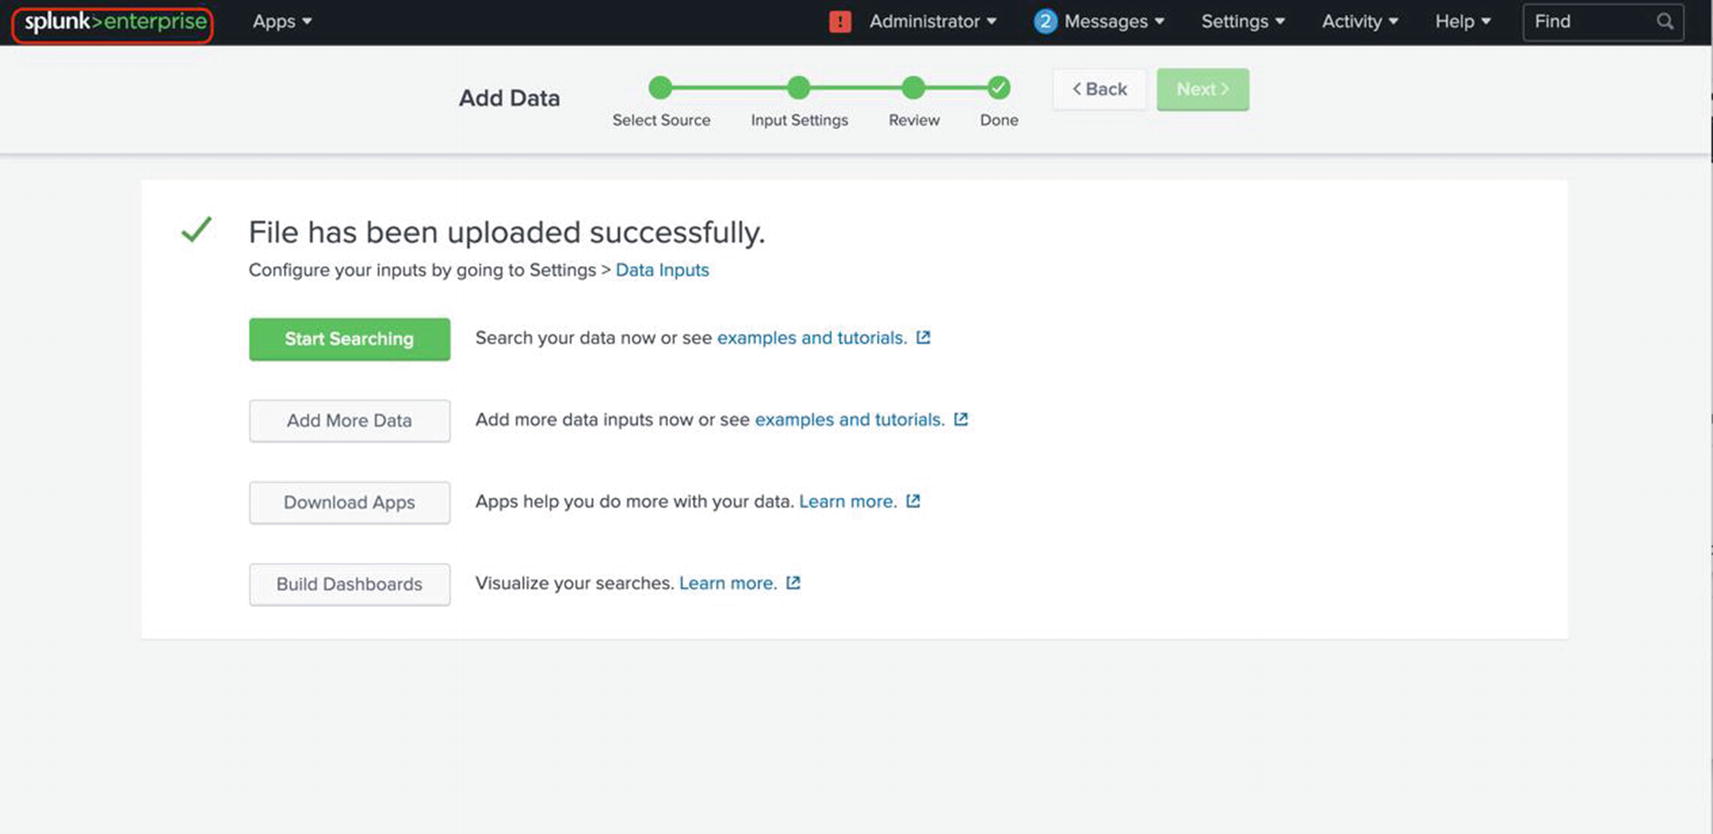
Finishing up the upload process
- 9.
Launch the Search & Reporting app as shown in Figure 1-15. Now you are ready to search.

Launching Search & Reporting app
Turning on Search Assistant
- 1.
In the Splunk bar, click the down arrow right next to your username and click the Preferences menu. See Figure 1-16.

Preferences menu
- 2.
In the Preferences menu, click the SPL Editor tab and select Full Search Assistant. In addition, enable Line numbers and Search auto-format as shown in Figure 1-17. Click Apply.

Turning on Search Assistant
You are all set. Let’s go ahead and run your first search.
Search Modes

Selecting the search mode
Let’s go more into depth on the significance of these modes and what they mean in your search.
Fast Mode
Fast mode favors performance. In this mode Splunk does not waste time in discovering fields (field discovery). It only extracts fields that are present in your SPL query. Further, when you use a transforming command such as stats to generate a report, fast mode does not generate the event details. Instead it jumps straight to Statistics or Visualization tab.
Verbose Mode
Verbose mode favors thoroughness over performance. It discovers all possible fields. When you run a transforming command such as stats to generate a report, verbose mode generates the events list and timeline. This may be useful in some scenarios. Because of the performance hit (in some cases, as much as ten times), use verbose mode with caution.
Smart Mode
This is the default mode, and I recommend you run your searches in this mode. Smart mode provides a blended approach between fast mode and verbose mode. With smart mode, automatic field discovery is turned on. In this, it is similar to the verbose mode. But when you use a transforming command such as stats to generate a report, smart mode does not generate the full events list. In this, it is similar to the fast mode.
Run the Search

Choosing time frame while running the search
To run the search, you either click the Search icon at the right corner of the Search bar or simply click anywhere in the search bar where you typed your query, and press Enter.
In practice, you should always specify as narrow of a time frame as possible for the best performance. However in this case, we choose All time to ensure all of tutorial data is retrieved.
What Happens When You Run the Search?

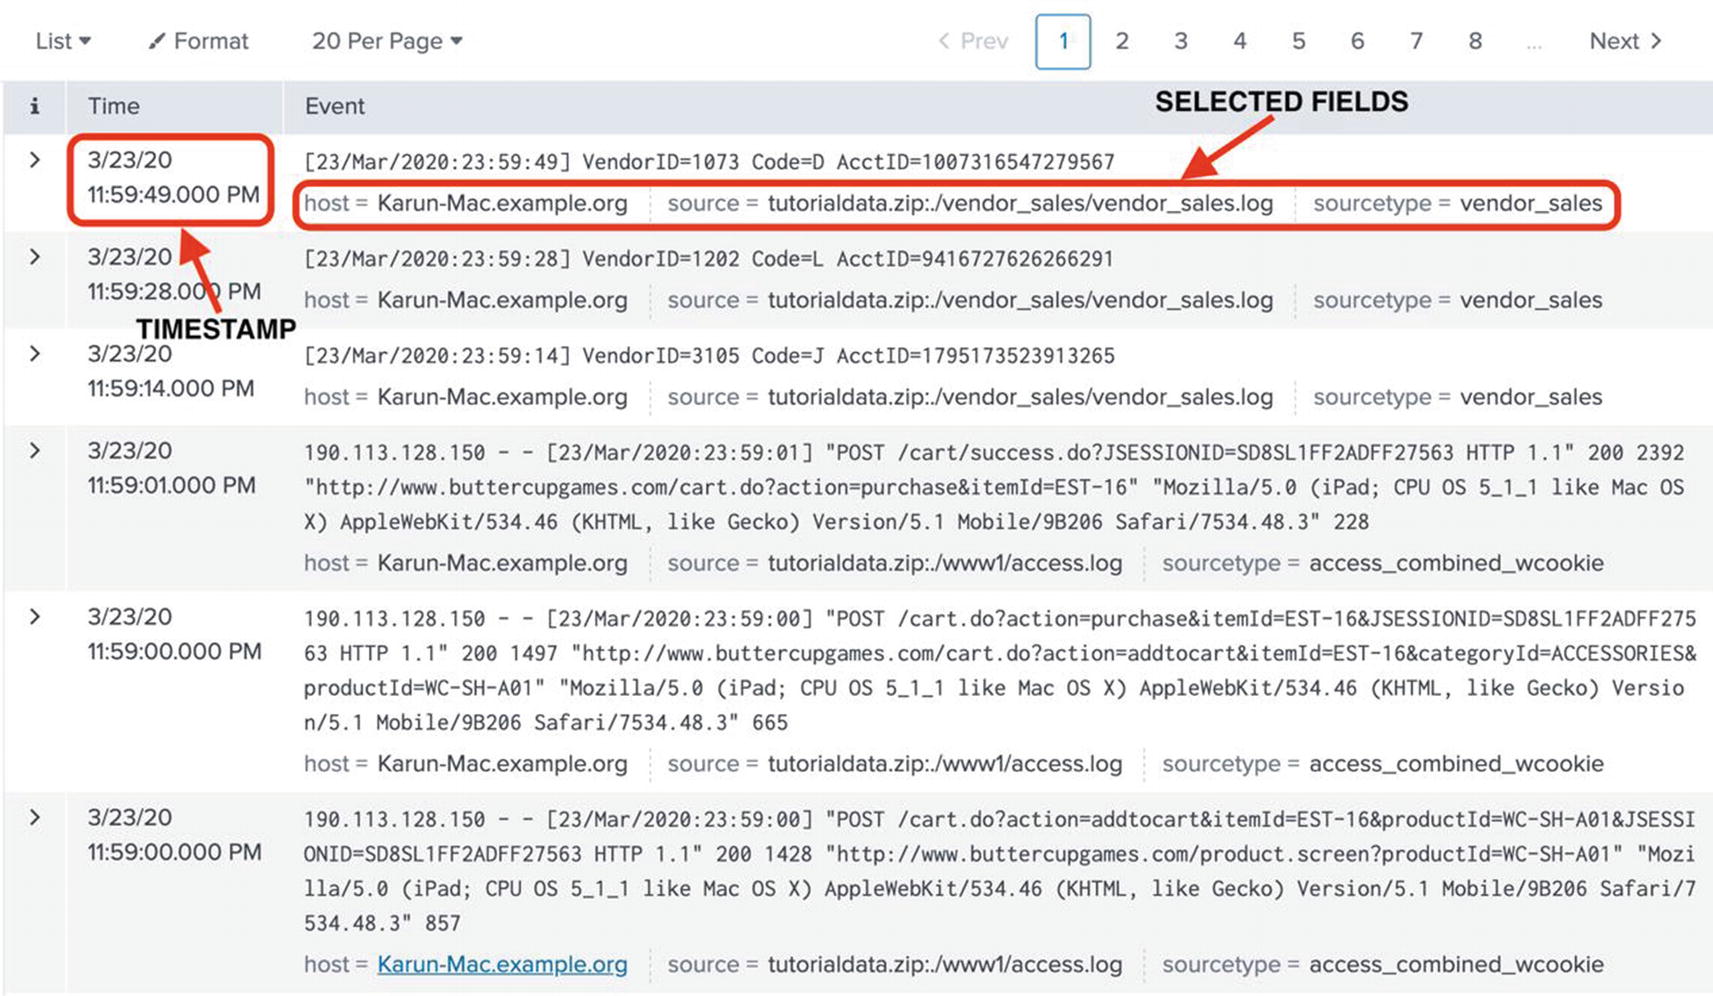
Search results
Congratulations! You have just taken your first step toward immersing yourself into the fascinating world of machine data and Splunk.
Before we go deeper, I would like to point out the various sections and menus that just became available after you ran the search. They will come in very handy to make full use of Splunk.
Timeline
The timeline provides a graphical view of the number of events returned from the search. It can be a quick way to identify any spikes in the number of events. For example, if you are searching for a specific string such as java.lang.NullPointerExeption, glancing at the timeline can provide a quick way to identify any spikes.
When you click on any area of the timeline, the Events tab automatically zooms in based on the selected time range. You can also drag on the timeline to select a range of time. If you double-click a specific bar in the timeline, Splunk reruns the search with the new time range.
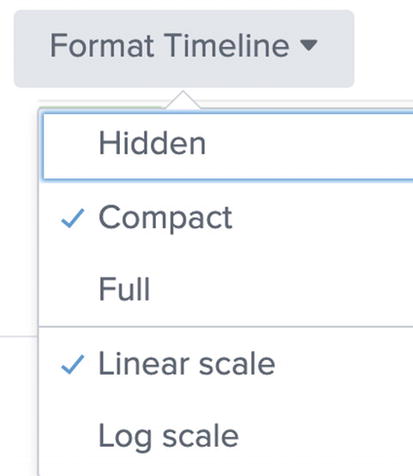
Customizing timeline
By default, Compact timeline is selected. You can choose Full timeline which will show x- and y-axis values. In addition, you can choose between Linear scale and Log scale for the display.
Fields Sidebar
The fields sidebar is where you will find automatically and manually extracted fields. Fields are searchable key-value pairs that Splunk extracts from your data. Fields are extremely useful to tailor your searches. We’ll look at fields in depth in a later chapter.
There are two sections of the fields sidebar, Selected Fields and Interesting Fields.
Selected fields are a set of configurable fields that are displayed for each event. Host, source, and sourcetypes are three default selected fields. Since these are very important fields, let me quickly describe these fields.
Host is the device from which the data originated. Typically, this is the server on which the Splunk Universal Forwarder is installed. In some ingestion mechanisms such as HTTP Event Collection, the hostname can be specified by the client.
Source is the name of the file from which the data has been ingested. Source can also be a stream or other input types.
Sourcetype denotes a specific data type. Splunk automatically recognizes many popular log files (e.g., Apache web server access logs). You can also create custom sourcetypes.
Interesting fields are fields that are present in at least 20% of the events in the result set. These fields could be automatically extracted by Splunk, or manually extracted by you.

Fields sidebar
Event Details
Event details
The SPL command transaction can group multiple events based on constraints you specify. For example, you can group all events related to a one user session in a web event log.

An expanded event
Key Takeaways
- 1.
Splunk can ingest any type of text data, structured, unstructured, or semistructured.
- 2.
Splunk utilizes the concept of schema-on-read in which most of the structuring of the machine data happens at search-time.
- 3.
Splunk organizes and stores data in indexes.
- 4.
Search Processing Language (SPL) is the query language used to retrieve data from Splunk. SPL syntax is a hybrid of SQL and Unix pipe.
- 5.
While there are 140+ commands in SPL, mastering a few key commands is more than enough to make full use of Splunk.
- 6.
While using Splunk Web, turn on full search assistant for a rich experience while searching.
- 7.
Prefer smart mode while searching.
- 8.
The time range you specify for a search will have the biggest influence on search performance.
Now that you have learned the basics of Splunk platform and SPL, in the next chapter, “Calculating Statistics,” we’ll dive right into useful SPL commands by learning how to calculate statistics from your machine data.