With over 140 commands and associated functions, SPL provides unprecedented flexibility to search and analyze massive amounts of unstructured data. Majority of the SPL commands use fields, and some of them require fields. In order to fully utilize the power of SPL, you should be able to represent your data in terms of fields. Fields are searchable key-value pairs in your data. They are the building blocks of SPL. As a Splunk user, you will inevitably run into situations where you need to first extract fields from your data in order to produce informative reports. In this chapter, we’ll learn about fields and how to extract them. We’ll first study the importance of fields in SPL; then we’ll move on to learning about automatically extracted fields. We’ll dive deep into manually extracting fields. We’ll cover the command rex in detail with plenty of examples. Finally, we’ll learn some important SPL commands that make use of fields, such as sort and dedup. By the end of this chapter, you will have enough knowledge to create and make use of fields in Splunk.
Why Learn About Fields?
In almost all examples in this book, we’ve been using fields. In your day-to-day interaction with Splunk, it won’t be any different – you will be using fields in almost every search. Let’s take a look at the significance of learning about fields.
Tailored Searches
Whereas you can use SPL to simply search for any string or phrase, the real power of SPL is its ability to tailor the searches using fields. For example, in order to find the events with HTTP status code 500, you could use the following SPL:
500
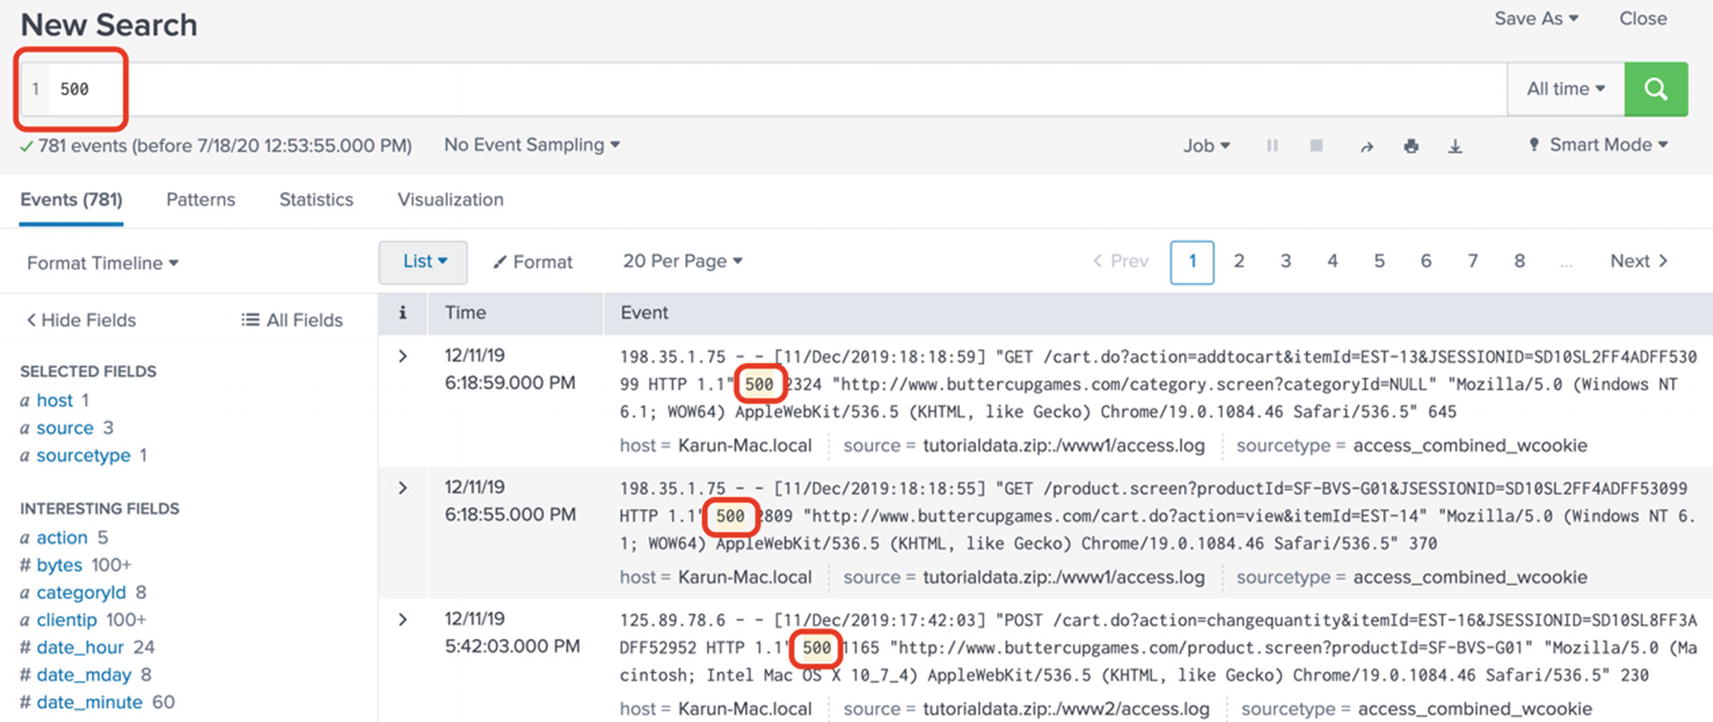
The SPL query contains just one string 500. This is a perfectly legal SPL query. Strictly speaking, Splunk implicitly adds the search command at the beginning. There is nothing wrong with the SPL query. When executed, Splunk will search all the default indexes associated with the user (who is executing the query) for the time range selected in the time picker. When it finds events matching 500, it retrieves the data and displays the results in the search interface. See Figure 5-1.
Figure 5-1
Searching for a literal string in Splunk
Note
When index is not explicitly specified in the SPL query, the default indexes are searched. Default indexes are configured by Splunk administrators for a given Splunk role. A user belongs to at least one Splunk role.
But there are many problems with this search. First, the string 500 is very generic, and it will match many strings other than the HTTP status code. For example, if the response time of the request (which is logged as the last field in the access log event) happens to be 500, that event will be retrieved as well. Likewise, if a JSESSIONID has the string 500 in it, that event will be retrieved as well.
Second, the search has to search through the entire event until it locates all the matching strings in an event. A wasted effort as all we are interested is just the HTTP status code.
Finally, the search is going to be very inefficient because it does not do any filtering. For example, if we had specified index=main and sourcetype=access_combined_wcookie, the search would have been much more efficient as it greatly reduces the data it needs to sift through. Let us rewrite the SPL query as follows:
This is a much more accurate and efficient search as it focuses on just the status field and applies two additional filtering – index and sourcetype. More importantly, it paves the way for tailoring your searches in a variety of ways. For example, if you want to find all status codes that start with 5
Using the wildcard *, we are able to easily retrieve all HTTP status codes that begin with 5. It will match statuses 500,501,502, and so on. And it gets even better. If we need to locate all the HTTP statuses between 300 and 599, we can write the following SPL:
index=main sourcetype=access_combined_wcookie status >= 300 AND status <= 599
When it comes to tailoring searches, fields open a world of possibilities with eval functions. For example, if you want to categorize the HTTP status codes as Client Error and Server Error, you can easily do so using the following eval statement using the status field:
index=main sourcetype="access_combined_wcookie"
| eval category = case(status >= 400 AND status < 500, "Client Error", status >= 500, "Server Error")
The SPL query uses eval’s case statement to evaluate status and assign the result to a new field named category. If the status is between 400 and 500, the field category is assigned the value Client Error. If the status is greater than 500, it is assigned the value Server Error. You can then use the field category to tailor your search. For example, to report on the number of errors by category
index=main sourcetype="access_combined_wcookie"
| eval category = case(status >= 400 AND status < 500, "Client Error", status >= 500, "Server Error")
| stats count by category
Splunk produces the following result:
category count
--------------------
Client Error 3818
Server Error 1432
Insightful Charts
With fields, you can produce informative charts and reports with ease. The most common use of fields in creating reports and charts is the ability to split the results using the by clause. For example, consider the following SPL:
index=main sourcetype="access_combined_wcookie" action IN ("view","addtocart","purchase")
| timechart count
The preceding SPL query plots the count of events over time where the action is view or addtocart or purchase. Splunk produces the following statistical output:
_time count
---------------------
2019-12-04 502
2019-12-05 2456
2019-12-06 2512
2019-12-07 2445
2019-12-08 2277
2019-12-09 2363
2019-12-10 2336
2019-12-11 1980
You can also visualize the preceding info in a column chart. See Figure 5-2.
Figure 5-2
Visualizing timechart without a split-by field
Whereas the preceding chart is informative, it can impart even more useful data by splitting the data by the action taken. Consider the following SPL:
index=main sourcetype="access_combined_wcookie" action IN ("view","addtocart","purchase")
| timechart count BY action
The SPL query simply adds the split by clause by appending the statement by action. Splunk produces the following statistical output:
_time addtocart purchase view
---------------------------------------
2019-12-04 179 157 166
2019-12-05 837 783 836
2019-12-06 869 903 740
2019-12-07 813 829 803
2019-12-08 786 781 710
2019-12-09 799 793 771
2019-12-10 796 797 743
2019-12-11 664 694 622
And the corresponding column chart is shown in Figure 5-3.
Figure 5-3
Visualizing timechart with split-by field
As you can see, splitting the count by action readily provides a visualization that breaks down the action taken.
Flexible Schema
One of the strengths of Splunk platform is its ability to apply a data schema when searching. This is known as schema-on-read or schema-on-demand. The traditional relational databases and many document-based data stores rely on a structure before the data is ingested. This is known as schema-on-write. In those systems, you have to painstakingly map out your fields before you ingest the data. And any changes to this schema result in incorrectly parsed data. With Splunk though, by using fields, you can apply any schema you want during search-time. This is a very powerful capability as it provides numerous possibilities to slice and dice the data. For example, consider the following events:
[11/Dec/2019:19:18:23] A fatal error occurred java.lang.InterruptedException
[11/Dec/2019:19:35:50] java.lang.NullPointerException exception found
[11/Dec/2019:20:04:10] We may have caught a java.lang.NumberFormatException
[11/Dec/2019:21:33:22] java.lang.RuntimeException - program aborting
In these events, there are many java exceptions scattered around. They don’t follow any particular pattern – that is, they don’t appear in a certain place within an event. Mapping this out before ingesting the data into Splunk will be hard because we simply don’t know where these exceptions will show up. In other words, creating fields before ingesting data is virtually impossible. With Splunk however, you can easily create a field named exception during search-time by using varieties of ways. For example, let me show you how you can use rex command to extract the exception field. Let’s rewrite the SPL as shown in the following:
index="main" sourcetype="java:exception"
| rex "(?<exception>java.[^s]+)"
I have piped the events to rex command which uses the regular expression(?<exception>java.[^s]+) to create a new field named exception. The regular expression translates to any string that starts with java, until a space is found. We will cover rex command and regular expression in detail later in this chapter. The result of this SPL query is a new field named exception being created. To simply show the exceptions and their counts
index="main" sourcetype="java:exception"
| rex "(?<exception>java.[^s]+)"
| stats count by exception
Splunk produces the following result:
exception count
----------------------------------------
java.lang.InterruptedException 2
java.lang.NullPointerException 1
java.lang.NumberFormatException 1
java.lang.RuntimeException 2
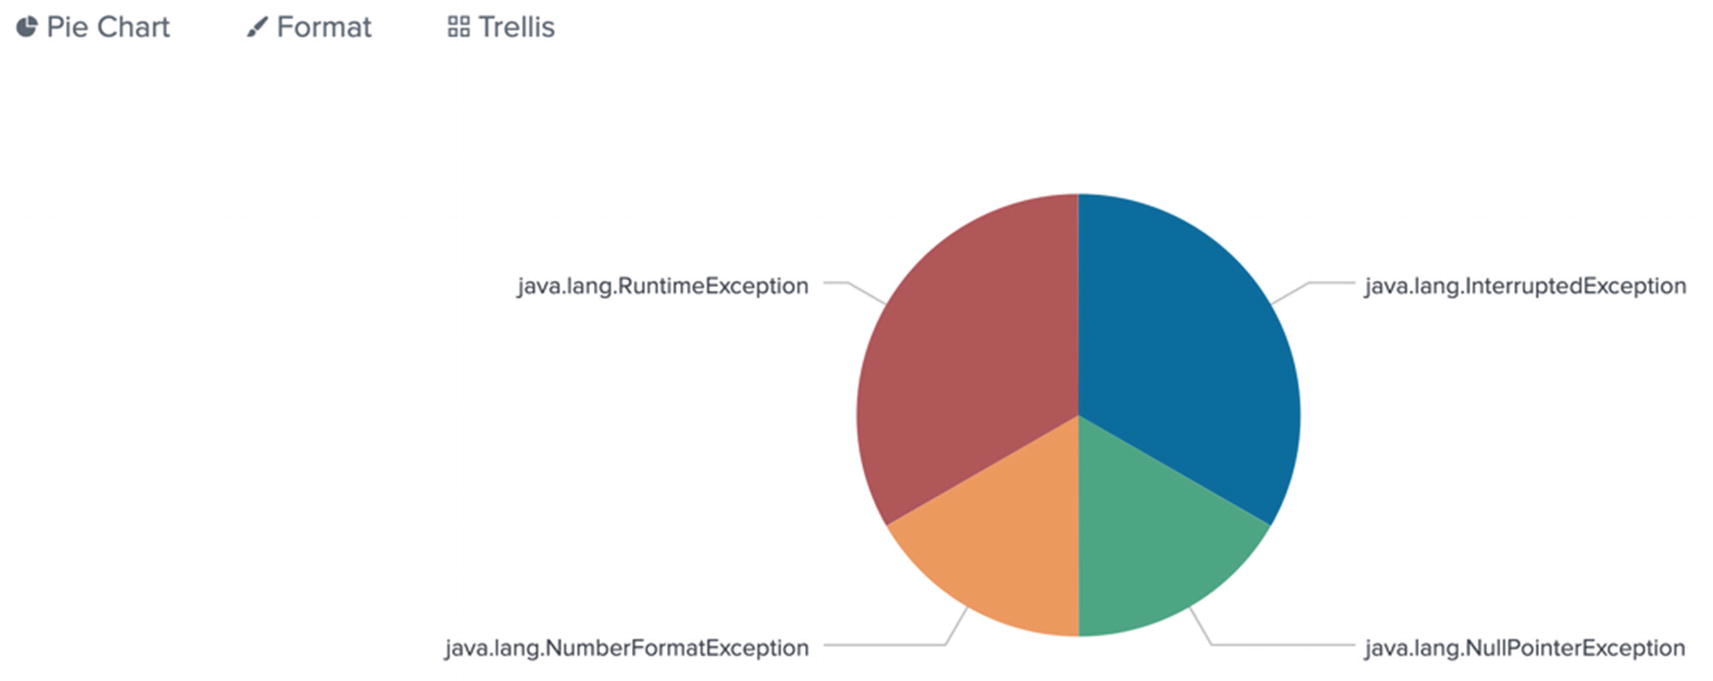
You can also visualize this in a pie chart. See Figure 5-4.
Figure 5-4
A pie chart made possible by extracting fields during search-time
As you can see, by using fields you are not dependent on a particular data schema. You can slice and dice the data in any way you want during search-time.
Index-Time vs. Search-Time Fields
In Splunk, fields can be created either during index-time or during search-time. As Splunk processes the incoming raw data during indexing, it can extract fields. This is called index-time field extraction. Many default fields such as host, source, and sourcetypes are extracted this way. You can also extract custom fields during index-time using props.conf and transforms.conf configuration files. As we have seen, Splunk can also extract fields during search-time. The rex command we example we saw earlier is an example of extracting fields during search-time. From SPL’s perspective, whether a field is an index-time field or search-time field makes no difference. However, there are three major implications to consider with index-time fields.
First, because Splunk has to perform additional processing to extract fields during index-time, the overall indexing time is increased. In addition, once the data is indexed, any changes to the indexed fields will require reindexing the data.
Second, searches on the indexes can become slower because the index has been enlarged due to the index-time fields. In general, searching on a larger index takes longer to process.
Third, indexed fields must be written to disk and require more storage. The total additional storage burden is based on the number of additional indexed fields and the length of those fields’ values.
As a general rule, perform the field extractions during search-time as it provides greater freedom and flexibility.
There is a benefit to using indexed fields. Metasearches, such tstats and metadata, operate only on indexed fields. tstats can be exponentially faster than search, and, in an environment where a field is used commonly but the data set spans terabytes or petabytes, this can be the preferred usage over search-time fields.
Automatically Extracted Fields
As Splunk processes the incoming data during the indexing phase, it automatically extracts many useful fields. These are also called default fields. These fields are kept in the index with the raw data. In addition, there are a few internal fields that Splunk creates during index-time. Internal field names being with _ (underscore), for example, _time. Further, Splunk also discovers new fields during search-time when search mode is set to either smart or verbose. This process is called field discovery. These three groups of automatically extracted fields (default, internal, and discovered) provide tremendous help in exploring your data. Let us learn about them in detail.
Default Fields
Splunk creates many default fields as it processes data during indexing. These fields can be very useful during search-time to filter your data. Let us take a look at these fields. Table 5-1 lists these fields and their descriptions.
Table 5-1
Default fields made available by Splunk
Field
Description
index
The index in which the data is indexed
host
The host from which the data was received
source
The source (generally the log file path) from which the data was received
sourcetype
The sourcetype used to parse the data Sourcetypes tell Splunk how to recognize the data
splunk_server
The Splunk server (indexer) that processed this data during indexing
linecount
Number of lines in the event. For example, a java stack trace can contain several lines but still indexed as one event
punct
Contains the punctuation pattern extracted during indexing
date_* fields
Provides additional granularity to the event timestamps. The fields include date_hour, date_mday, date_minute, date_month, date_second, date_wday, date_year, date_zone
Caution
The date_ fields are only available when the raw event contains a valid timestamp. Further, date_ fields are directly extracted from the raw event and do not take the time zone customizations you may have done into account.
An example of using default fields is shown in the following:
| stats count AS "Failed password attempts on Sundays" BY date_mday
The SPL query calculates the number of failed login attempts on Sundays and breaks it down by the date. Note the use of default fields index, sourcetype, date_wday, and date_mday.
Internal Fields
Splunk automatically creates many internal fields as it indexes the data. The names of internal fields begin with _ (underscore). Table 5-2 lists the internal fields.
Table 5-2
Internal fields made available by Splunk
Field
Description
_raw
The raw data of the original event
_time
Timestamp of the event in Unix time. The time is always stored in the index in UTC format and is translated to human-readable format during search-time
_indextime
The time at which the event was indexed, in Unix time. This field is hidden by default and will not be displayed unless renamed or used with eval
In addition to the preceding internal fields, there are also _cd which contains the address of an event within an index and _bkt which contains the bucket ID. Both of these fields are hidden by default. Use of these internal fields is not recommended for new users as they are used for internal reference only.
An example of SPL utilizing the internal index is shown in the following:
index=_internal sourcetype=splunkd
| eval latency = _indextime - _time
| convert ctime(_indextime) AS Indextime
| sort 4 -latency
| table Indextime,_time,latency
The SPL query calculates the latency between the timestamp of the event (_time) and the time at which it was indexed (_indextime). It also uses the command convert with ctime function to translate Unix time to human-readable time and stores the result in the Indextime field. It sorts the top four events using latency in descending order. Finally, it prints the results in a table. Notice the use of the internal fields _time and _indextime. Splunk produces the following result:
We discuss sort command in detail later in this chapter.
Fields Extracted Through Field Discovery
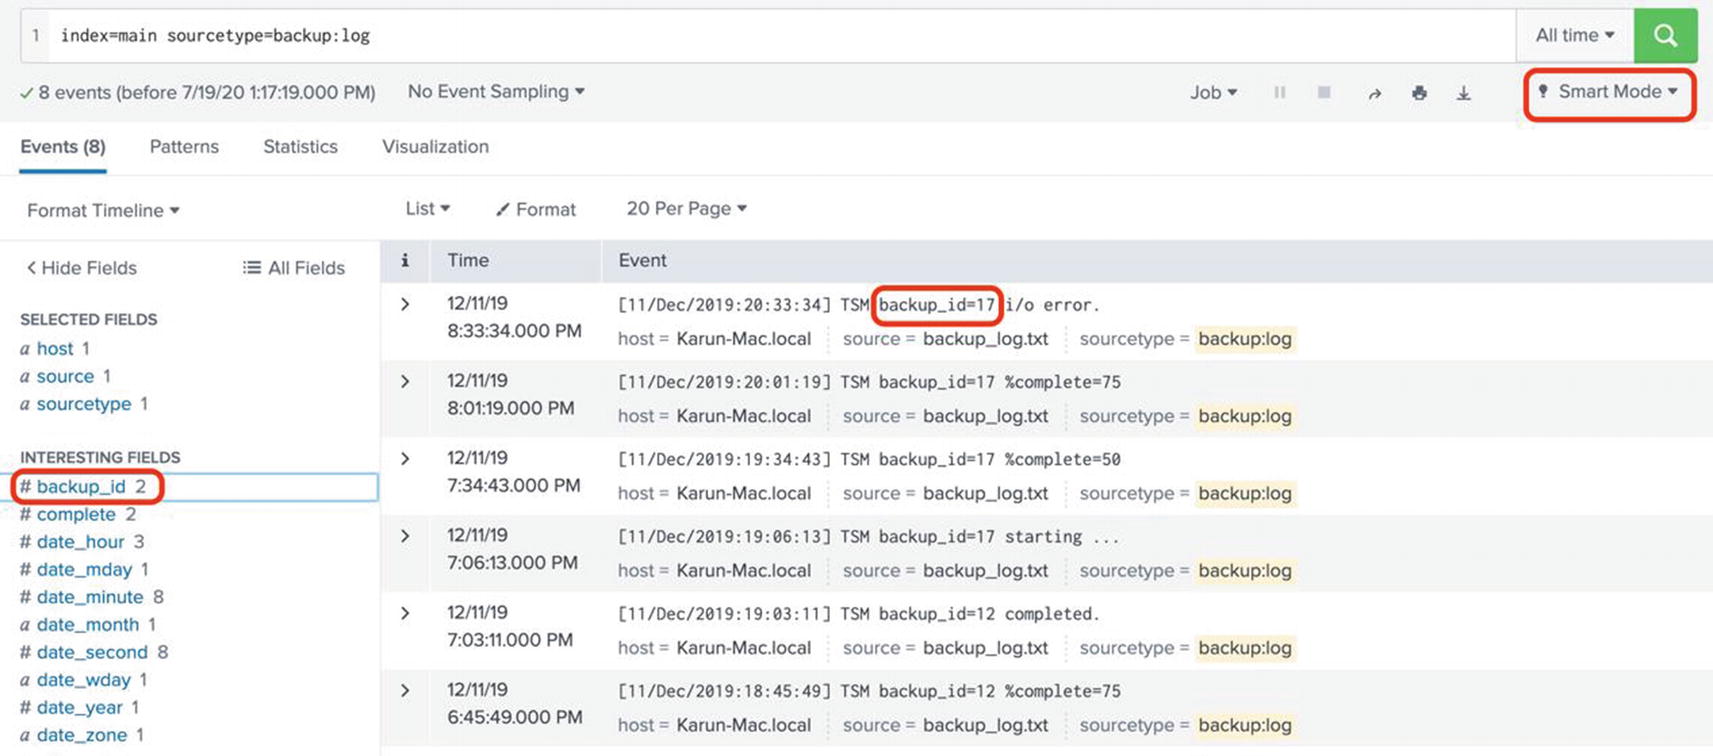
Splunk automatically extracts key-value pairs present in the data. Key-value pairs are data represented in the format key=value, for example, backup_id=20. When Splunk sees events with key-value pairs, it automatically extracts them and makes them available for searching. In addition, you can configure Splunk to automatically extract fields when the data is of a structured format such as JSON. Field discovery is enabled only when the search mode is smart or verbose. It is not enabled in fast mode. Consider the following events:
When these events are retrieved as the result of a search, Splunk automatically extracts the field backup_id since it is found in a valid key-value pair, backup_id=12 and backup_id=17. You can see the automatically extracted fields under interesting fields in the fields sidebar. See Figure 5-5.
Figure 5-5
Automatically extracted fields using field discovery
Note that a field appears under interesting fields only if it is present in at least 20% of the events retrieved. But the field would still be present in the events, and you can use them in your searches.
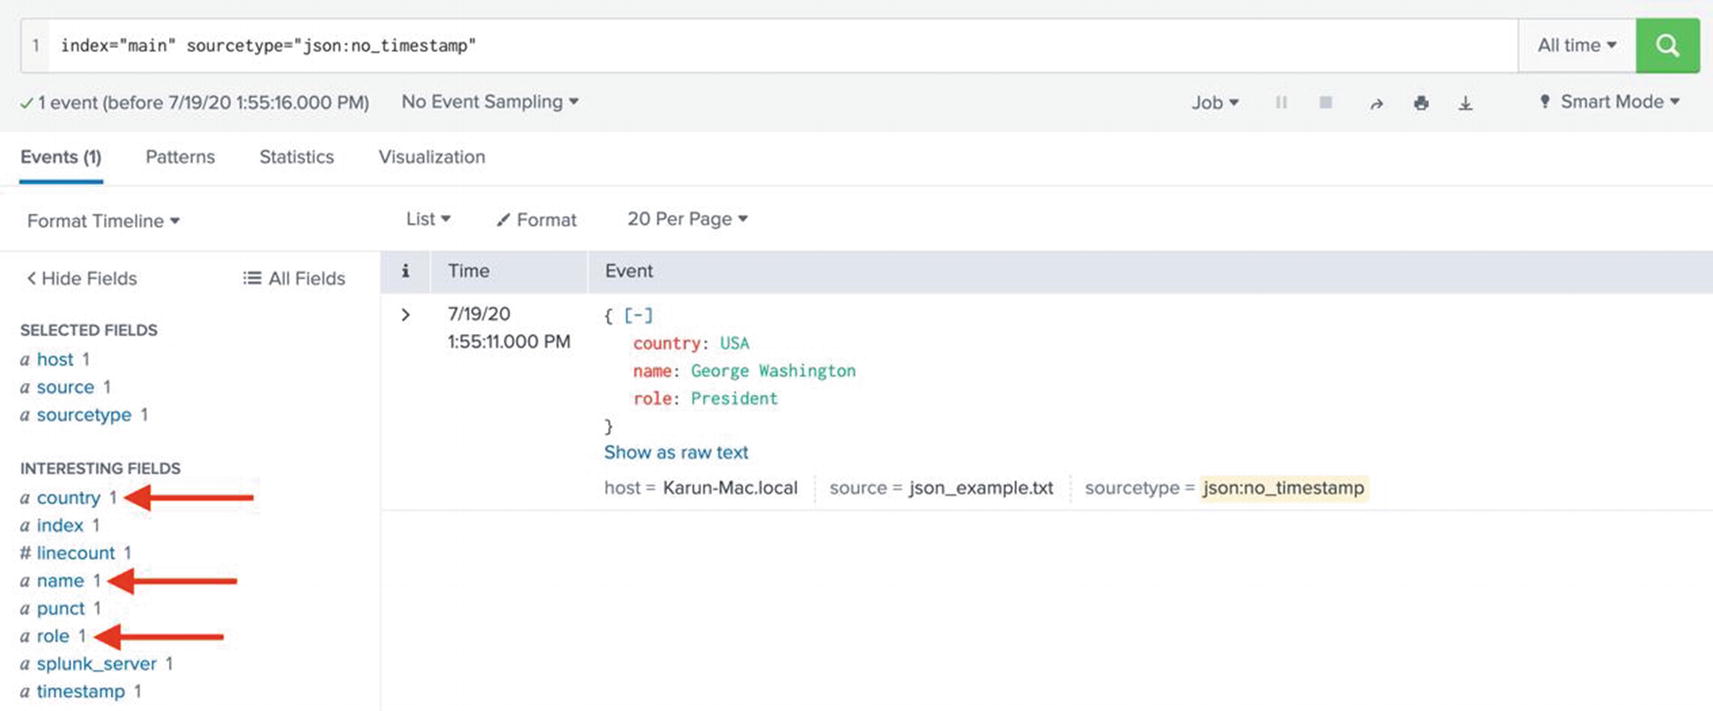
When the data is of a structured format such as JSON, Splunk can be configured to automatically extract fields. By default, JSON fields will be automatically discovered by Splunk. Consider the following JSON event:
After the data is ingested into Splunk, when the event is retrieved using a search, Splunk automatically extracts the JSON fields. See Figure 5-6.
Figure 5-6
Automatically extracted fields when data is of valid json format
You can also see that Splunk highlights the syntax while displaying json data.
Whereas automatically extracted fields greatly aid in making use of your data, you will inevitably run into situations where you have to manually extract fields. In the next section, we’ll learn about the various ways you can manually extract fields in Splunk.
Manually Extracting Fields
When the fields you need in your data are not automatically discovered and extracted by Splunk, you have to extract fields. This is also called custom field extraction. The custom field extractions must be applied to a host, source, or sourcetype. At first, manually extracting fields may seem like an intimidating task. In fact, in my experience, it is one of the most feared aspects of Splunk. The primary reason for this is the need to learn and understand regular expressions. If you want to extract fields from your data, you must learn to use regular expressions. While Splunk provides some aid in this area, such as field extractor wizard, ultimately learning to use regular expressions will become inevitable in your Splunk journey. The good news is that you only need to learn a portion of regular expressions to tackle majority of the field extraction scenarios. In this section, we’ll cover the various ways Splunk provides to manually extract fields.
Using Field Extractor Wizard
The easiest way to manually extract fields is to use the field extractor wizard. The field extractor wizard automatically generates regular expressions based on a sample of data you provide. If you want, you can update the regular expression that is generated by the wizard. This method is suitable if you are not comfortable writing your own regular expressions. The wizard can also use delimiters such as commas or spaces in your data to extract fields. This can be useful if your data is structured, such as a CSV file. Let us see field extractor in action. Consider the following set of events from Splunk tutorial data (sourcetype=secure):
Thu Dec 11 2019 00:15:06 mailsv1 sshd[4907]: Failed password for invalid user irc from 194.8.74.23 port 1956 ssh2
Thu Dec 11 2019 00:15:06 mailsv1 sshd[3014]: Failed password for invalid user operator from 194.8.74.23 port 1491 ssh2
These events show the failed login attempts for invalid users. Naturally, the username is an important piece of information, and it is worth extracting this as its own field. However, because it is not a key-value pair, Splunk does not automatically extract this field. In order to manually extract the username as a custom field, you can use the field extractor wizard. First, display the search results that include the usernames you want to extract as follows:
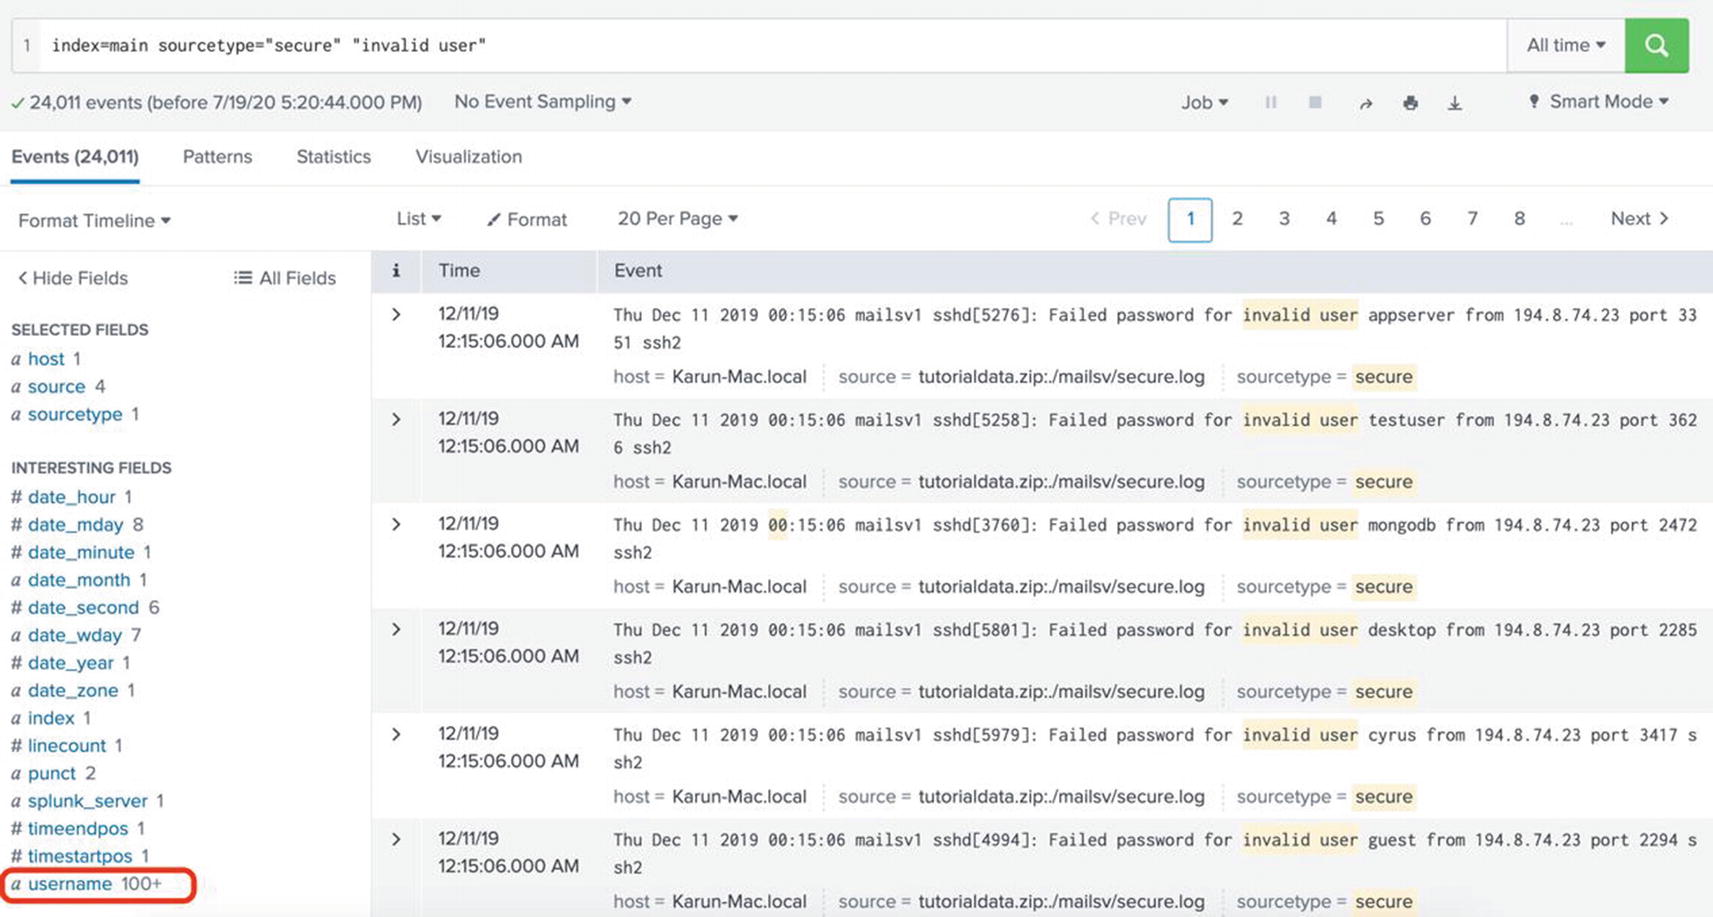
index=main sourcetype="secure" "invalid user"
The SPL query simply searches the main index with sourcetype secure and retrieves all events that have the string invalid user in them. Figure 5-7 shows the results. Notice that username is not one of the fields available.
Figure 5-7
Displaying the targeted results before invoking the field extractor wizard
Click the Extract New Fields hyperlink toward the bottom of the fields sidebar. This opens the field extractor wizard. Choose a sample event that has the field you want to extract (username) from the list of events and click Next. See Figure 5-8.
Figure 5-8
Selecting a sample event in the field extractor wizard
In the next screen, as shown in Figure 5-9, choose Regular Expression as the method to use. If your data is of structured data such as CSV, you can choose delimiters as the method. In our case, since the data is not structured, let’s go with regular expression. Click Next to proceed.
Figure 5-9
Selecting Regular Expression as the method to be used for field extraction
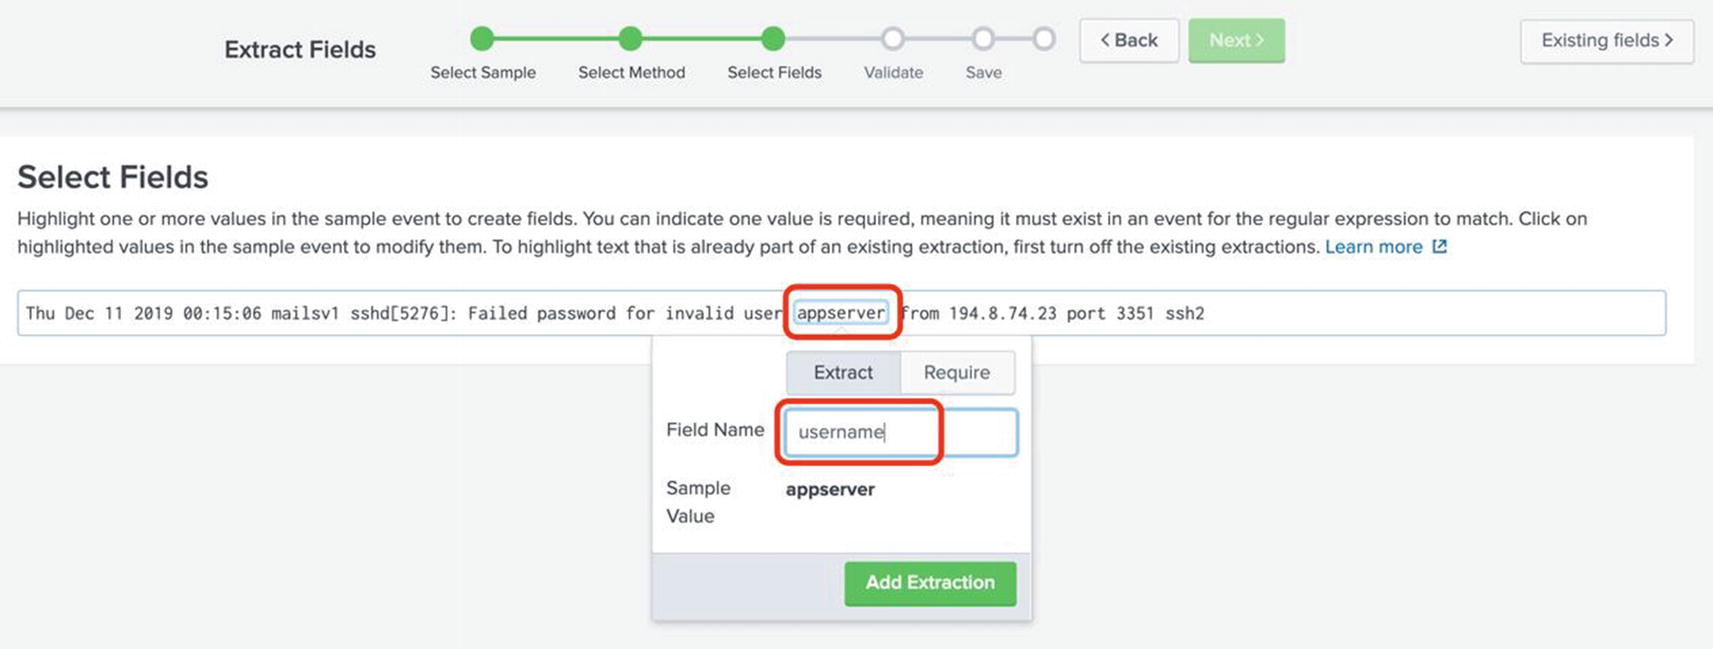
Now at the Select Fields screen, highlight the username (in this example, appserver). A pop-up is shown where you can enter a name for the field. As shown in Figure 5-10, enter username and click Add Extraction.
Figure 5-10
Selecting the field to extractor in the field extractor wizard
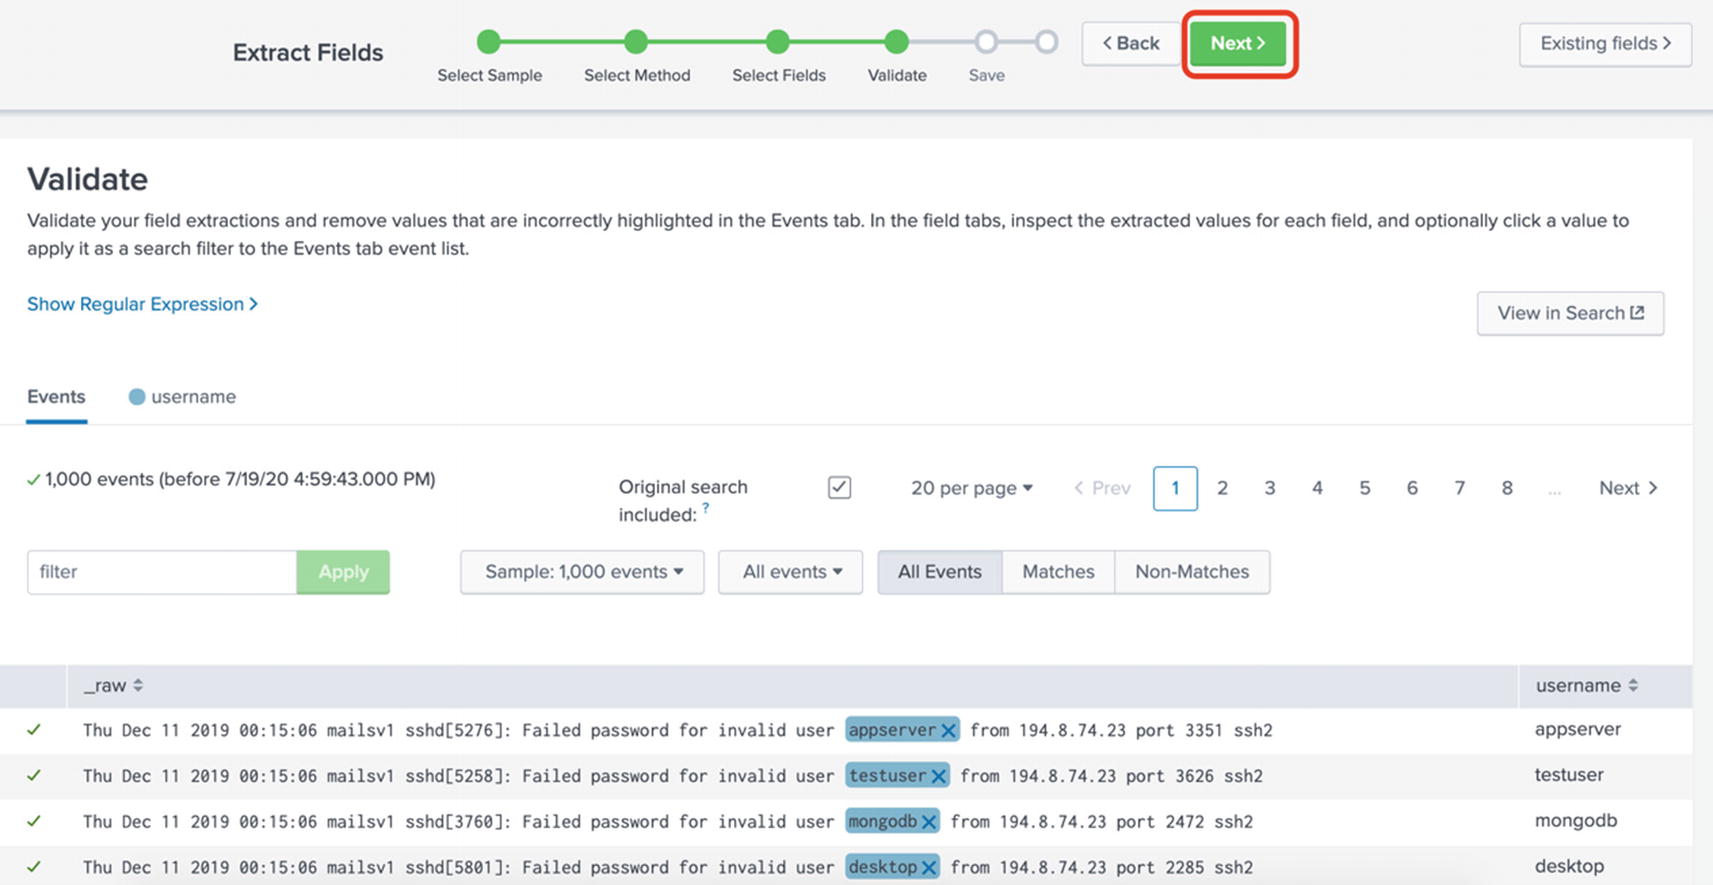
Now, Splunk goes to work and computes a regular expression that will best extract the field you selected. As shown in Figure 5-11, Splunk provides a preview of the extracted fields. If everything looks good at this screen, you can proceed by clicking Next. If you see any incorrect results, you can select additional events to the set of sample events. In our case, all the extracted fields look good. So, let’s proceed by clicking Next.
Figure 5-11
Previewing the results in the field extractor wizard
In the Validatescreen, you have the option to remove any incorrectly extracted fields. In our example, we don’t have any incorrectly extracted fields. In this screen, you also have the option to see the regular expression that Splunk generated for you. As shown in Figure 5-12, simply click Next.
Figure 5-12
Validating the results in the field extractor wizard
In the final save screen, you have the option to set the permissions for this field extraction. By leaving it as Owner as shown in Figure 5-13, this field extraction will remain private to you. If you want to share this field extraction with others, you have to choose App. For this example, let’s leave it as Owner and click Finish.
Figure 5-13
Setting permissions for the field extraction in the field extractor wizard
A Success message appears as shown in Figure 5-14. Your field extraction is complete.
Figure 5-14
Completing the field extractor wizard
Go back to the Search & Reporting app and rerun the following search:
index=main sourcetype="secure" "invalid user"
Now, you can see the username field on the field sidebar as shown in Figure 5-14.
Figure 5-15
Validating the extracted field in search interface
Now that the field is extracted, you can tailor your searches to make use of the field. For example, to find the top ten invalid usernames, run the following SPL:
index=main sourcetype="secure" "invalid user"
| top 5 username showperc=f
By using showperc=f, I chose not to show the percentage to keep the report simple. Splunk produces the following result:
username count
---------------------
administrator 1020
admin 938
operator 923
mailman 752
irc 644
Next, we’ll take a look at how to use the field extractions menu to extract custom fields.
Using Field Extractions Menu
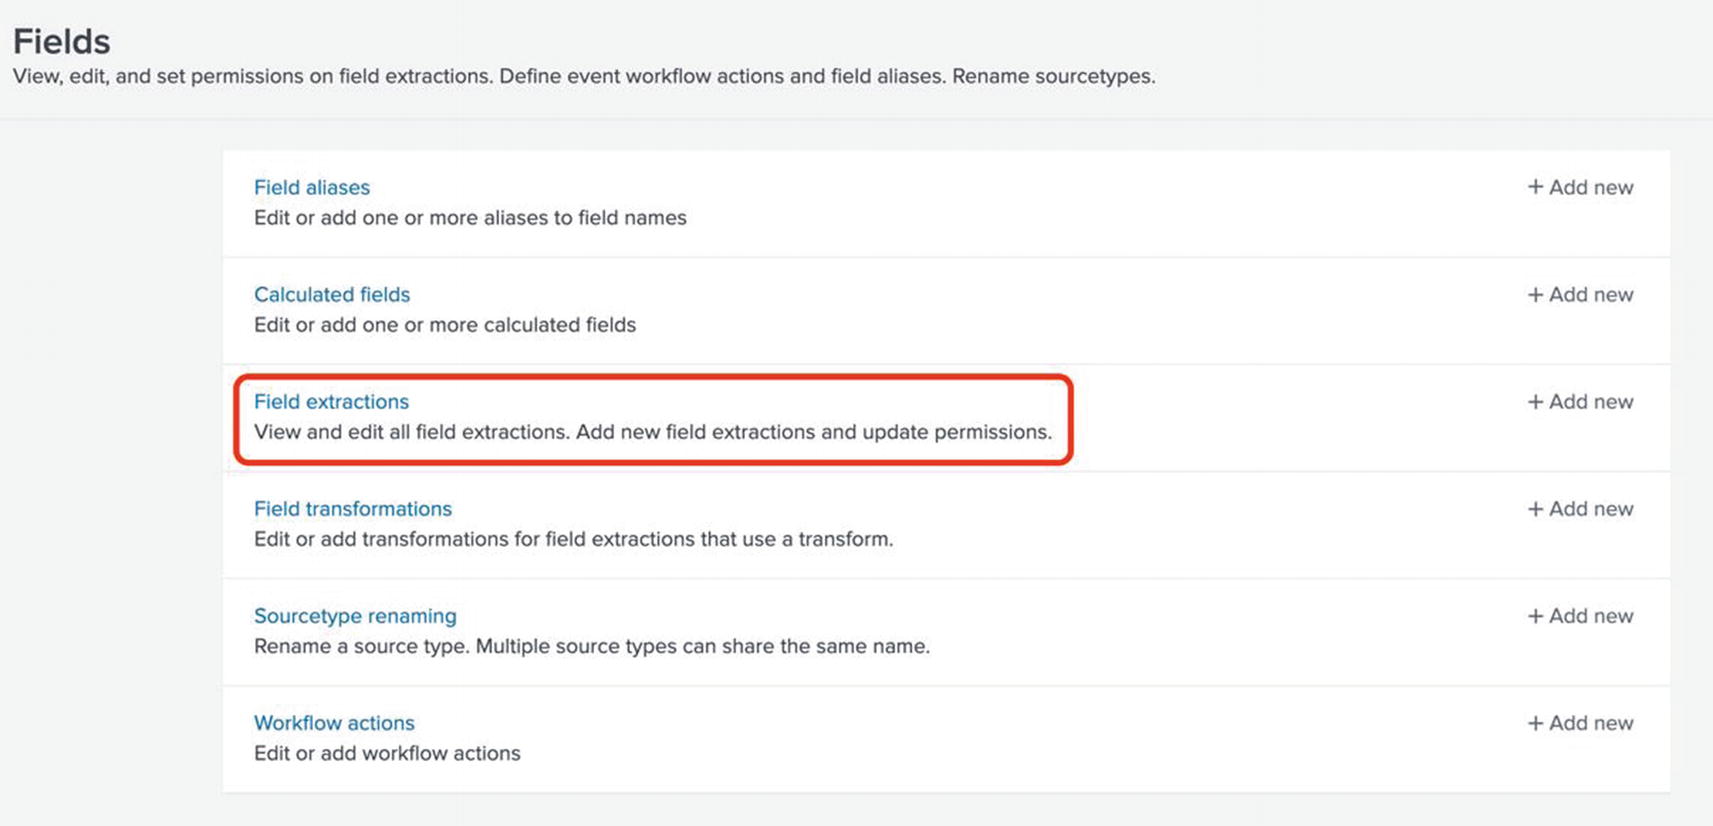
Whereas field extractor wizard is helpful for someone who is not comfortable with regular expressions, you will have more control over field extractions when you use regular expressions. One way you can extract custom fields is using field extractions menu under settings. You simply access the menu by navigating to Settings ➤ Fields ➤ Field Extractions as shown in Figures 5-16 and 5-17.
Figure 5-16
Accessing the Field Extractions menu
Figure 5-17
Field extractions menu
For illustration, consider the following events from the Splunk tutorial data:
Thu Dec 11 2019 00:15:06 mailsv1 sshd[5333]: Failed password for invalid user inet from 194.8.74.23 port 4564 ssh2
Thu Dec 11 2019 00:15:06 mailsv1 sshd[2605]: Failed password for invalid user itmadmin from 194.8.74.23 port 4692 ssh2
These events indicate failed login attempts. Note that the event has the user’s IP address. This can be a very good piece of information for troubleshooting. Since the IP address is not in a key-value pair format, Splunk will not automatically extract the IP address as a field. In order to extract this as a field, you can create a new field extraction using the field extractions menu. Launch the field extractions menu from Settings ➤ Fields ➤ Field extractions ➤ New Field Extraction.
Enter the following information in the form:
Destination app: The Splunk app in which you want to create this field extraction. For this example, you can leave this as Search.
Name: The name for this field extraction. This is not the name of the field itself. That is specified as part of the regular expression.
Sourcetype: This is the sourcetype on which this field extraction will be applied. A field extraction must be applied to a host, source, or sourcetype. For this example, type secure.
Type: You can extract the fields in two ways. With inline, you specify the regular expression right on this page in the next step. You can also use transform which is yet another knowledge object that you configure outside of this field extraction. Using transforms allows you to reuse a piece of regular expression in multiple field extractions. For this example, choose Inline.
Extraction/transform: This is the actual regular expression to use. Splunk uses PCRE (Perl Compatible Regular Expression). By using named extraction of regular expressions, Splunk can create fields that match a regular expression pattern. We are going to go through a primer on regular expression in the next section. For now, in order to retrieve the IP address as a field named userIP, simply enter the following regular expression:
(?<userIP>(d{1,3}.){3}d{1,3})
The regular expression captures the IP address pattern in a field named userIP. See Figure 5-18.
Figure 5-18
Adding a new field extraction using the Settings menu
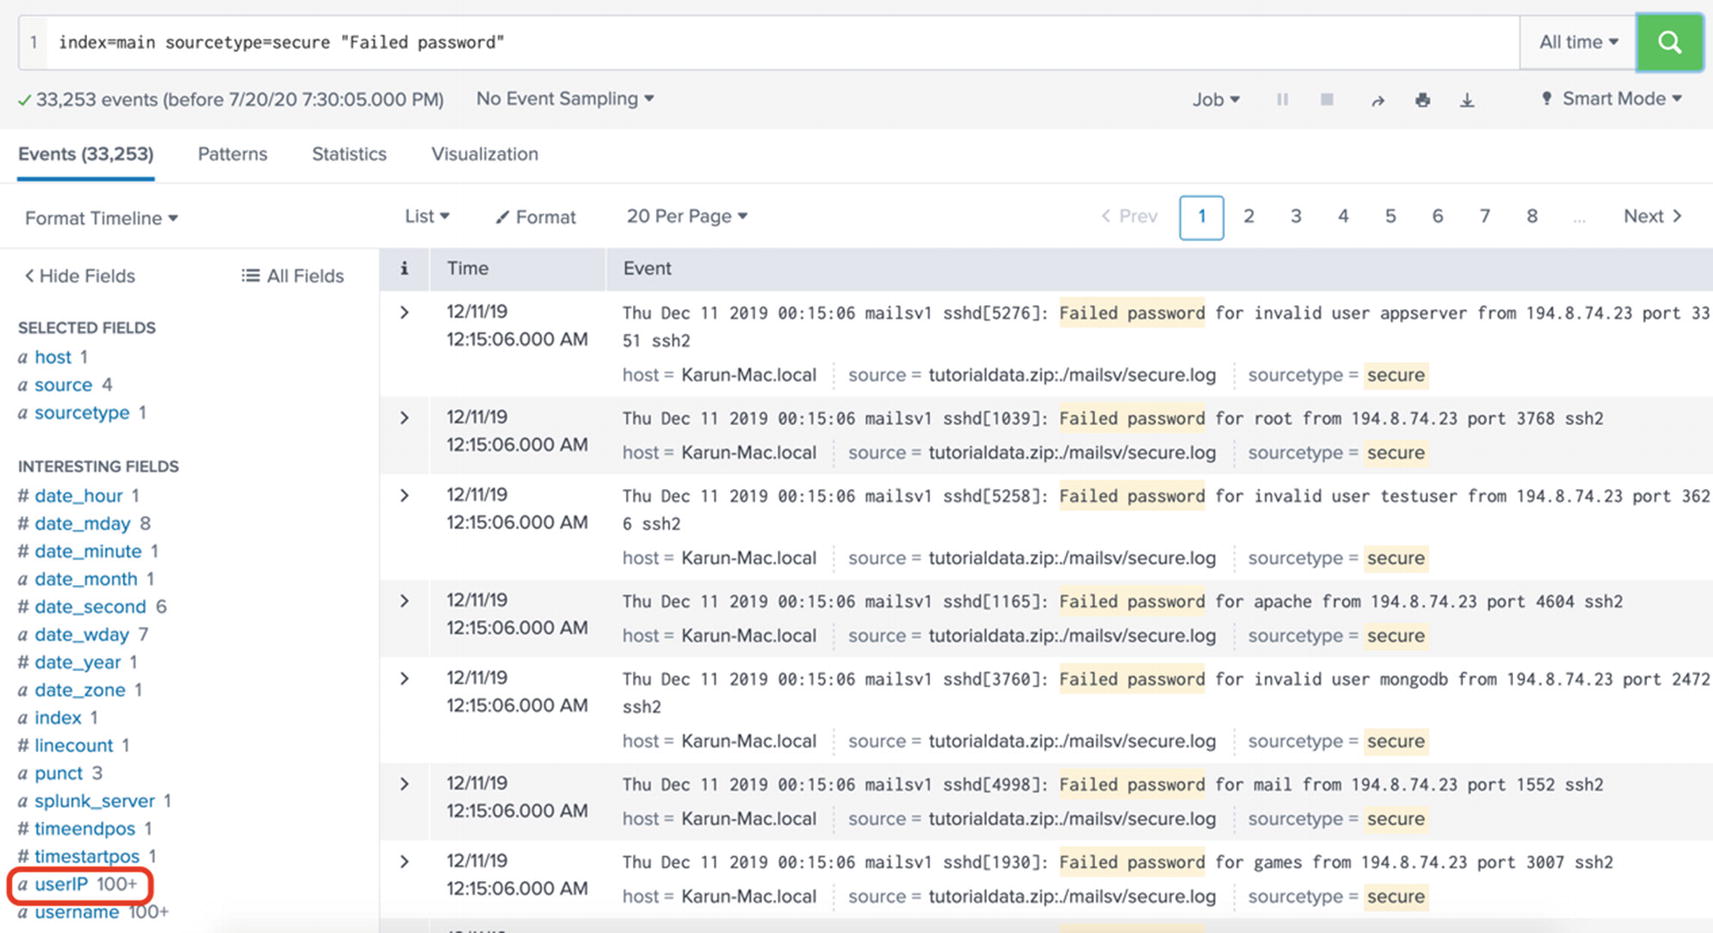
Click Save to save the field extraction. Now when you search for the data, you can see the userIP field in the field sidebar. See Figure 5-19.
Figure 5-19
Extracted field show up in the fields sidebar
Once you have the userIP extracted, you can easily tailor your searches using that field. For example, to create a report that shows the top five countries based on the number of requests, you can use the following SPL query:
index=main sourcetype=secure "Failed password"
| iplocation userIP
| top Country showperc=f
The SPL query uses iplocation command which translates the IP address to a geolocation. Splunk produces the following output:
Country count
----------------------
United States 8691
China 5121
United Kingdom 2773
Russia 2457
South Korea 2118
As you have probably observed, extracting fields requires the working knowledge of regular expressions. In the next section, let’s go through a quick primer on regular expressions.
A Primer on Regular Expressions
A regular expression is a sequence of characters that represent a pattern of text. There are many implementations of regular expressions available. Splunk utilizes PCRE (Perl Compatible Regular Expressions). Regular expressions are used in SPL commands like rex and regex and many configuration files like props.conf and transforms.conf. Most notably, regular expressions are heavily used in field extractions. Learning the full functionality of regular expressions is beyond the scope of this book. There are many books available that are dedicated to regular expressions. In this primer, we’ll cover the most important aspects of regular expressions that pertain to Splunk.
Note
Regular expression is also called regex.
A regular expression can contain literal characters and metacharacters. Literal characters represent the actual characters themselves. On the other hand, metacharacters have special meaning. The metacharacters are as follows:
[]^$.|?*+(){}
One could say that learning regular expression is largely learning about metacharacters and their meaning. For example, consider the following regular expression:
an.
In the regular expression, the characters a and n are literal characters. The . (period) is a metacharacter and has a special meaning. It represents any character except a new line character. So, the regular expression can match the following strings:
ant
and
Similarly, the metacharacter d represents a digit. Consider the following regular expression:
ddd-dd-dddd
The regular expression represents three digits followed immediately by a dash, followed immediately by two digits, followed immediately by a dash, followed immediately by four digits. They represent the format of a US social security number.
Table 5-3 shows the most common metacharacter patterns and their meanings.
Table 5-3
Regular expression cheat sheet
Metacharacter
Description
Example
Sample matching text
.
Match any character except new line character
s.n
Son
sun
d
Any digit
5dd
500
504
w
Any word character (letter, number, or underscore)
wwww
King
num1
D
Any nondigit
DD
Pi
$$
W
Any nonword character
WW
{}
()
?
Zero or one
cats?
Cat
cats
+
One or more
d+
9
358748
*
Zero or more
x*z
Xxxxz
z
Escape character
$*
$$$$
$
{…}
Number of repetitions
d{3}
458 (Exactly 3 times)
d{1,3}
10 (1 to 3 times)
d{2,}
12745 (2 or more times)
[…]
Character class
[aA]pe
Ape (a or A)
ape
[a-z]20
k20 (range a-z)
b20
[x-z4-6]
y5 (range x-z followed by range4-6)
z4
[^1-5]+
640 (character that is not in the range 1-5)
9
^
Beginning of the line
^Z
Zebra
Zen
$
End of the line
d$
Total 60
hi5
(?<var>…)
Named extraction
(?<ssn>d{3}-d{2}-d{4})
111-11-1111 (extracts the value in a variable named ssn)
(?:…)
Logical grouping
(?:search|find)
search (matches search or find)
find
Learning the metacharacters in the table will greatly improve your efficiency with field extraction. Note that there are many other advanced features of regular expressions that I did not cover. I personally use sites like https://regex101.com and https://www.rexegg.com/ to brush up my regular expression knowledge. We will use the regular expressions we have learned in the next section as we explore using the rex command to extract fields.
Using Rex Command
Rex extracts fields during search-time using the named extraction feature of regular expression. Usually, you use rex to try out the various regular expressions to use before setting up permanent field extraction using the Settings menu or using the configuration files. The basic syntax of rex command is as follows:
| rex <regular expression>
Let us learn to use rex using a few examples. Consider the following events:
2019-03-05 10:57:51.112 INFO org.apache.catalina.core.StandardEngine : Starting Servlet Engine: Apache Tomcat/7.0.52
2019-03-05 10:57:51.253 INFO o.s.web.context.ContextLoader : Root WebApplicationContext: initialization completed in 1358 ms
2019-03-05 10:57:51.698 WARN o.s.b.c.e.ServletRegistrationBean : Mapping servlet: 'dispatcherServlet' to
The events are from a hypothetical spring boot application log. Note that the severity of the log event is represented by the string right after the timestamp, such as INFO, WARN, and so on. Let’s say you want to create an alert that keeps track of the number of WARN messages and triggers the alert when the number of WARN messages goes above a certain threshold. In order to achieve this, you would first want to extract the severity as a field. Since the severity is not present in a key-value pair format, Splunk will not automatically extract this field.
First, come up with the regular expression that matches the string you want to extract. Then, you can use this regular expression in rex command to extract the value as a field. The regular expression can be written as follows:
d{3}s+(?<log_level>(?:ERROR|INFO|WARN|DEBUG))
The regular expression matches a three-digit number followed by one or more spaces, followed by a capture group. The capture group uses the literal strings with the conditional function of OR (the pipe character). The regular expression will match any of the strings ERROR, WARN, INFO, DEBUG, and TRACE. For example, in the following line , “112. INFO” will be matched, and the string “INFO” will be captured in the field log_level:
2019-03-05 10:57:51.112 INFO org.apache.catalina.core.StandardEngine : Starting Servlet Engine: Apache Tomcat/7.0.52
Using the regular expression, the rex command can be written as follows:
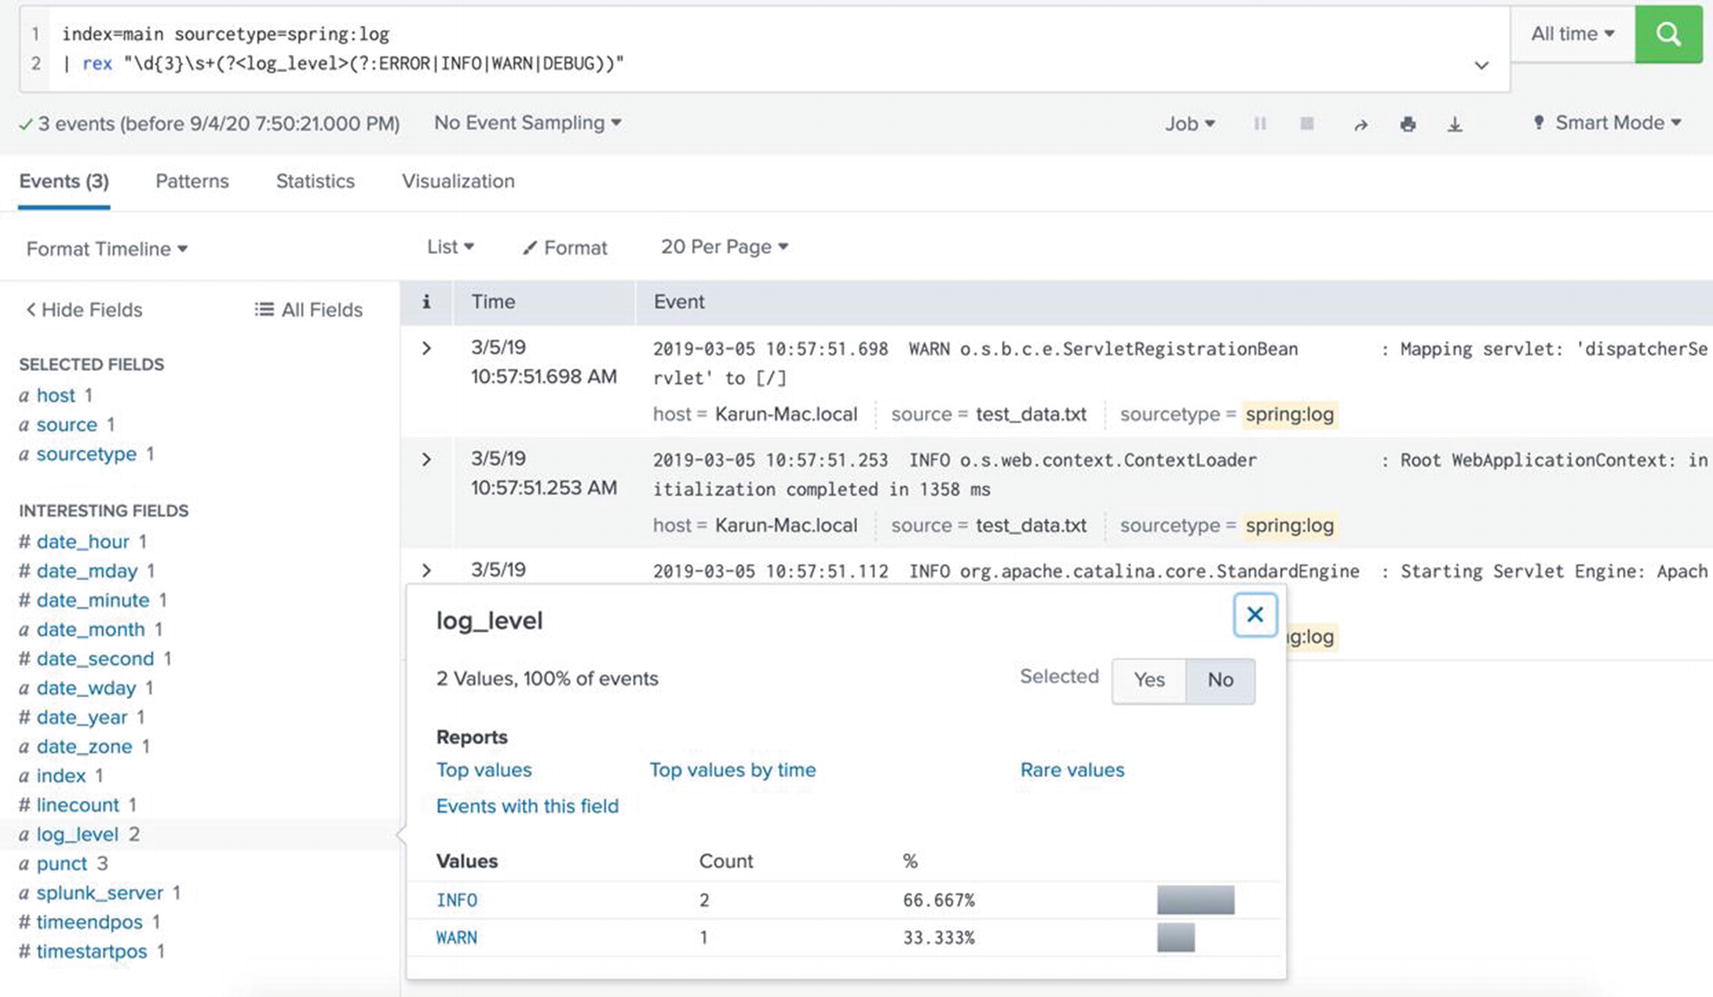
...| rex "d{3}s+(?<log_level>(?:ERROR|INFO|WARN|DEBUG))"
The entire argument to rex command must be enclosed in double quotes. See Figure 5-20 that shows the result of the rex command.
Figure 5-20
Using rex to extract fields
Once the log_level field is extracted, it is easy to create a timechart using the following SPL:
index="main" sourcetype="spring:log"
| rex "d{3}s+(?<log_level>(?:ERROR|INFO|WARN|DEBUG))"
| search log_level = "WARN"
| timechart count AS "Number_of_WARN_messages"
The result of the SPL can be saved as an alert to send an email or page to engage the support team. Creating and configuring alerts is beyond the scope of this book.
Let us consider another example. The following event shows the time taken to initialize the application in milliseconds:
2019-03-05 10:57:51.253 INFO o.s.web.context.ContextLoader : Root WebApplicationContext: initialization completed in 1358 ms
Let’s say you want to extract the time taken to initialize as a field. Once again, because the time taken is not in a key-value pair format, Splunk will not automatically extract. But with rex command, you can easily extract this by using a regular expression.
We see that the time taken is a sequence of numbers followed by space followed by the string ms. It is also preceded by the string “initialization completed in”. The rex command can be written as follows:
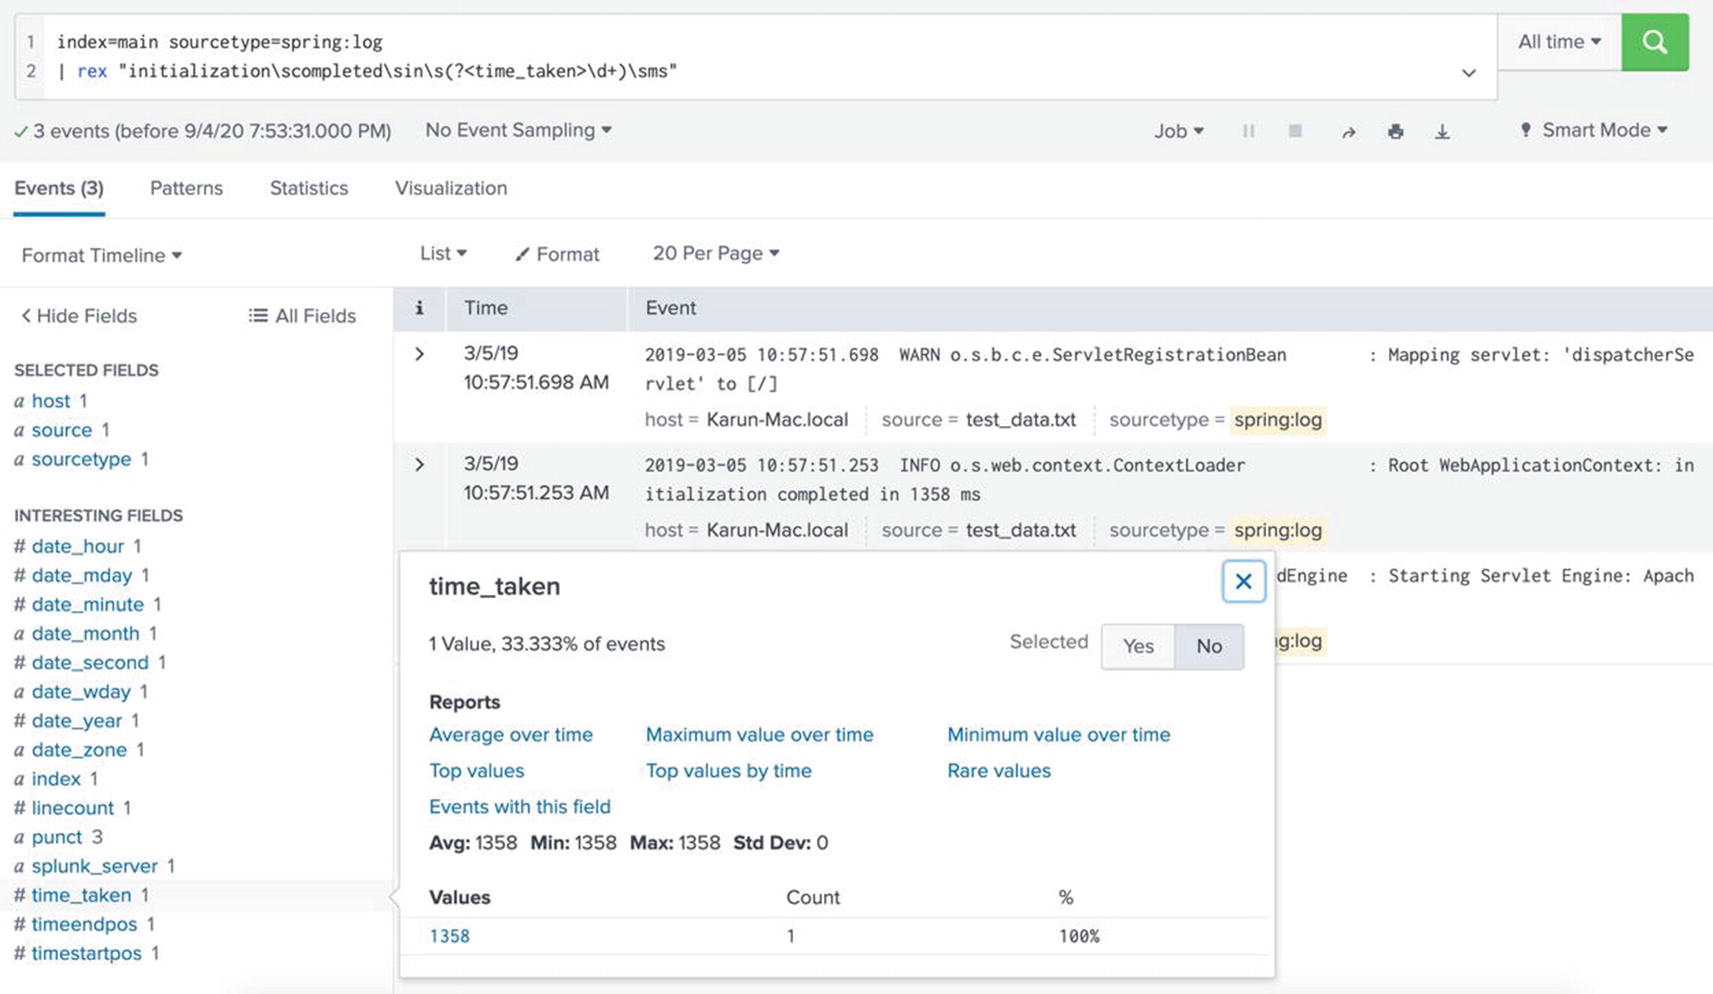
...| rex "initializationscompletedsins(?<time_taken>d+)sms"
The rex command extracts the value d+, which stands for one or more digits into the field time_taken. Note that the pattern must be followed by a space (s) and the string ms. See Figure 5-21 to see the result produced by rex.
Figure 5-21
Using rex to extract fields
Once you have the time taken extracted as a field, it is easy to tailor your searches. For example, to find the events where time taken is more than 5 seconds (5000 milliseconds), the following SPL can help:
index="main" sourcetype="spring:log"
| rex "initializationscompletedsins(?<time_taken>d+)sms"
| search time_taken > 5000
Now that you have learned how to extract fields, let’s take a look at some of the practical uses of fields.
Using Fields
Fields are an inseparable component of SPL. In this section, let’s review some of the practical ways you can make use of the fields.
Filtering
In order to filter your search results, you can use the search and where commands. When the search command is the first command in the query, before the first pipe, it is used to retrieve events from index. Note that the search command is implied at the beginning of any search, and hence you do not need to specify it at the beginning of your search criteria. When the search command is not the first command in the pipeline, it is used to filter the results of the previous command in the pipeline.
When employing the search command to filter data using fields, you can compare the field values using Boolean and comparison operators. For example, to retrieve events that have the value of the field bytes greater than 3072
...| search bytes > 3072
The where command evaluates an expression and retains an event if the result is true. Otherwise, it discards the events. For example:
...| where (bytes/1024) > 3
The SPL query retrieves events where kilobytes (bytes/1024) is greater than 3 and discards all other events. Note that events that don’t have the bytes field are also discarded. In addition to using an expression, where command can be used to compare two different fields. For example:
...| where heap_usage > 0.9 * max_heap
The SPL query retrieves evens where heap usage is more than 90% of the maximum heap. Both heap_usage and max_heap must be fields that exist in the event.
The expression used in the where clause can be any valid eval expression. For example, to retrieve the events where the IP address (ip field) falls within a CIDR (Classless Interdomain Routing) network, you can use the following where clause:
...| where cidrmatch("10.0.0.0/23",ip)
Another set of useful commands to filter is head and tail. The command head retrieves ten events from the top, and tail retrieves ten events from the bottom. You can specify the number of events you want to retrieve. For example:
index="main" sourcetype="spring:log"
| head 5
The SPL query retrieves five events from the top. Note that the event order is relative to the input order. In other words, head retrieves the latest events from the index.
To retrieve 20 events from the bottom (oldest events)
index="main" sourcetype="spring:log"
| tail 20
The events will be printed in reverse order with the oldest event printed first. You can also use head command with an eval expression. The events will be printed until the condition is true. For example, to retrieve events until the log_level changes from WARN, you would use the following SPL:
...| head (log_level="WARN")
The SPL query will retrieve first events until it reaches an event where log_level is NOT equal to WARN.
Sorting
You can use the sort command to sort the results by the specified fields. By default, sort orders result in ascending order. For example, to sort the results by the count field
index="main" sourcetype="access_combined_wcookie"
| stats count by action
| sort count
To sort in descending order, add the minus symbol as shown in the following:
...| sort -count
By default, sort limits the number of results returned to 10,000. To override this, specify 0 as shown in the following, which sets the number of results to unlimited:
...| sort 0 count
Note
Using sort 0 can have negative performance impact due to the amount of data.
You can use more than one field to sort. If multiple fields are specified, sorting happens in order. Consider the following example:
...| sort -field1,+field2
The SPL query first sorts field1 in descending order and then sorts field2 in ascending order. The symbol + is optional.
Splunk sorts strings in lexicographical order. Few points to note about lexicographical order are given in the following:
Numbers are sorted before letters.
Uppercase letters are sorted before lowercase letters.
Numbers are sorted by first digit of the number, for example, 1,10,198,204,65,9.
Deduping
In many occasions, you will want to remove duplicates from your data. The dedup can be used for those situations. By default, dedup command keeps only the first result of a unique value of the field specified. For example, to keep the first result of each unique host
...| dedup host
You can specify a count to be used for the number of results to keep. For example, to keep the first three results for each unique sourcetype value
...| dedup 3 sourcetype
You can also use multiple fields to dedup. For example, to keep the first two results for each unique combination of host and source values
...| dedup 2 host,source
Note that the results returned are usually the latest events in the index. You can override this by using the sortby option. For example, consider the following SPL:
The SPL query retains the top two categoryId after sorting the results by the number of items sold. Splunk produces the following result:
categoryId itemId count
-------------------------------
STRATEGY EST-13 197
STRATEGY EST-14 189
ARCADE EST-16 115
ARCADE EST-21 114
ACCESSORIES EST-7 91
ACCESSORIES EST-6 86
TEE EST-27 85
TEE EST-19 83
SHOOTER EST-15 69
SHOOTER EST-21 62
SIMULATION EST-14 60
SIMULATION EST-27 56
SPORTS EST-16 37
SPORTS EST-12 33
Key Takeaways
Your experience with Splunk will greatly depend on your ability to make use of fields from your machine data. You should try your best to get the fields automatically extracted by Splunk by ingesting structured files or by using key-value pairs. But when that is not possible, you should be comfortable enough to manually extract fields. Learning regular expression will greatly help in manually extracting fields. Here are the key takeaways from this chapter:
1.
Fields are searchable key-value pairs in the machine data that can be either automatically or manually extracted.
2.
Fields enable you to construct tailored searches, perform data transformation, and create informative charts.
3.
Fields can be created at index-time or search-time.
4.
Search-time field extraction is preferred. Index-time field extraction consumes more disk space.
5.
You can use field extractor wizard, Fields menu, rex command, or configuration files (props.conf, transforms.conf) to extract fields.
6.
rex command lets you extract fields on the fly by using SPL during search-time.
7.
Developing expertise in regular expressions greatly helps with extracting fields.
8.
Use the command dedup command to remove duplicates.
9.
Use the sort command to sort the results. You can use sort -field to sort the field in descending order.
10.
The commands sort and dedup are resource intensive, so use it with caution.
You have made tremendous progress in learning SPL. Until now, we’ve been using SPL against the indexed data. Splunk also provides a way to bring in external data to enrich your search results. It achieves this by employing lookups. In the next chapter, we’ll learn all about lookups.