
![]()
Tracing Requests
There will come a point where your web application doesn’t behave the way you expect. Some problems manifest themselves in an obvious way—such as unexpected HTML content—and you need to figure out what goes wrong. Other problems are more complex and insubstantial, and you may have to dig deep into the application just to figure out what’s happening, let alone apply a fix.
The Visual Studio debugger is useful for finding the first kind of problem, which is usually caused by the way that single requests are processed. The other kind—the more elusive problem—is often caused by interactions between requests, or deep configuration issues that cause problems only periodically. To find and resolve problems that span requests, you need to start building up a picture about the way that an application behaves over time. In this chapter, I’ll show you different techniques for gaining insight into an application. Table 8-1 summarizes this chapter.
Table 8-1. Chapter Summary
Problem |
Solution |
Listing |
|---|---|---|
Log details of requests. |
Respond to the LogRequest event. |
|
Combine logging information with additional details about the application and server. |
Use the request tracing feature. |
|
Generate additional information about requests. |
Install the Glimpse package. |
Preparing the Example Project
For this chapter I need a simple web application to inspect and monitor, so I am going to continue to use the Mobile project I created in Chapter 7 when I demonstrated how to detect and respond to device capabilities. No changes to the project are required.
Logging Requests
The simplest way to get insights into an application is to create a log of each request. In this section I explain how the ASP.NET request life cycle accommodates logging and show you how to capture logging information. Table 8-2 puts logging requests into context.
Table 8-2. Putting Request Logging in Context
Question |
Answer |
|---|---|
What is it? |
Request logging is the process of capturing information about each request that ASP.NET receives and processes. |
Why should I care? |
Logging is the first step in understanding how your application behaves across multiple requests, which provides important information when tracking down complex problems. |
How is it used by the MVC framework? |
The MVC framework does not use the logging features. |
Responding to the Logging Events
The ASP.NET request life cycle includes two events that are specifically related to the logging of requests: LogRequestand PostLogRequest. The first event is a signal to any logging functionality you have added to the application that the request has been processed and the content is about to be sent to the client. This is the perfect time to log details of the request and the way that it has been handled because there will be no further changes to the state of the request context objects. The PostLogRequest event is less useful, but it provides a signal that all of the handlers for the LogRequest event have been triggered.
![]() Tip The LogRequest and PostLogRequest events are triggered even when the normal flow of events is interrupted by an unhandled exception and the Error event. See Chapter 6 for details of the error event flow.
Tip The LogRequest and PostLogRequest events are triggered even when the normal flow of events is interrupted by an unhandled exception and the Error event. See Chapter 6 for details of the error event flow.
To demonstrate custom logging, I added a class file called LogModule.cs to the Infrastructure folder and used it to define the module shown in Listing 8-1.
Listing 8-1. The Contents of the LogModule.cs File
using System;
using System.Diagnostics;
using System.IO;
using System.Web;

namespace Mobile.Infrastructure {
    public class LogModule : IHttpModule {
        private static int sharedCounter = 0;
        private int requestCounter;

        private static object lockObject = new object();
        private Exception requestException = null;

        public void Init(HttpApplication app) {
            app.BeginRequest += (src, args) => {
                requestCounter = ++sharedCounter;
            };
            app.Error += (src, args) => {
                requestException = HttpContext.Current.Error;
            };
            app.LogRequest += (src, args) => WriteLogMessage(HttpContext.Current);
        }

        private void WriteLogMessage(HttpContext ctx) {
            StringWriter sr = new StringWriter();
            sr.WriteLine("--------------");
            sr.WriteLine("Request: {0} for {1}", requestCounter, ctx.Request.RawUrl);
            if (ctx.Handler != null) {
                sr.WriteLine("Handler: {0}", ctx.Handler.GetType());
            }
            sr.WriteLine("Status Code: {0}, Message: {1}", ctx.Response.StatusCode,
                ctx.Response.StatusDescription);
            sr.WriteLine("Elapsed Time: {0} ms",
                DateTime.Now.Subtract(ctx.Timestamp).Milliseconds);
            if (requestException != null) {
                sr.WriteLine("Error: {0}", requestException.GetType());
            }
            lock (lockObject) {
                Debug.Write(sr.ToString());
            }
        }

        public void Dispose() {
            // do nothing
        }
    }
}
This module provides brief summaries of the requests that are received by the application to the Visual Studio Output window. This is the kind of logging that I find useful when I suspect there are inadvertent interactions between requests (through poorly protected shared data, a topic I describe in Chapter 10) or when I think that some requests for the same URL are taking too long to complete (which is usually caused by queuing for access to a shared resource somewhere in the application—often an external resource such as a database).
The request summary contains information about the order in which the request was received, the amount of time it took to process, the name of the handler class used to generate the content, the status code and message that will be sent to the client, and whether an unhandled exception was encountered.
There is nothing especially complex about this module, but there are two aspects of this kind of logging that require caution. First, it is important to remember that ASP.NET can process multiple concurrent requests, which means that synchronization is required to protect access to shared resources. In the example, I use the lock keyword to ensure that only one instance of my module will call the System.Diagnostics.Debug.Write method. Without this, requests that overlapped would cause the output from the module to be interleaved and rendered unreadable.
Second, any logging will slow down the application, especially when synchronization is required. There is always an overhead associated with logging because there are additional classes to create and C# statements to execute, but once synchronization is required, the problem can become more profound and choke points can form in the application where multiple requests have to queue up to gain exclusive access to a resource (such as the Debug.Write method in the example).
These aspects of logging rarely cause serious issues during the development phase of a web application because only the developer is making requests and there are not enough of them to highlight throughput problems—but in load testing and production environments, logging code can cause serious problems. Always minimize the amount of synchronization required and remember to disable unnecessary modules before you test and deploy the application. If the problem you are looking for is caused by an interaction between requests, the additional work and synchronization associated with logging can slow down and re-sequence request processing just enough to hide the problem, creating the dreaded “cannot reproduce” bug summary.
Returning to my example module, Listing 8-2 shows the additions I made to the Web.config file to register it with ASP.NET.
Listing 8-2. Registering the Module in the Web.config File
<?xml version="1.0" encoding="utf-8"?>
<configuration>
  <appSettings>
    <add key="webpages:Version" value="3.0.0.0" />
    <add key="webpages:Enabled" value="false" />
     <add key="ClientValidationEnabled" value="true" />
    <add key="UnobtrusiveJavaScriptEnabled" value="true" />
  </appSettings>
  <system.web>
    <compilation debug="true" targetFramework="4.5.1" />
    <httpRuntime targetFramework="4.5.1" />
  </system.web>
  <system.webServer>
    <modules>
      <add name="Log" type="Mobile.Infrastructure.LogModule"/>
    </modules>
  </system.webServer>
</configuration>
Simply start the application to test the logging module. The Visual Studio Output window will show messages similar to the following, although the exact output will depend on files your browser has cached from previous requests:
--------------
Request: 1 for /
Handler: System.Web.Mvc.MvcHandler
Status Code: 200, Message: OK
Elapsed Time: 2 ms
--------------
Request: 2 for /Content/bootstrap.min.css
Status Code: 200, Message: OK
Elapsed Time: 3 ms
--------------
Request: 3 for /Content/bootstrap-theme.min.css
Status Code: 200, Message: OK
Elapsed Time: 2 ms
Tracing Requests
ASP.NET includes a little used but incredibly helpful request tracing feature that provides information about the requests that an application receives. The tracing feature pre-dates the MVC framework, and there are some features that don’t work outside of Web Forms applications, but there is still enough value in performing tracing that it should be a key part of your diagnostic toolkit. In the sections that follow, I’ll show you how to enable, use, and customize the tracing process. Table 8-3 puts tracing requests into context.
Table 8-3. Putting Request Tracing in Context
Enabling Request Tracing
Tracing is configured through the Web.config file, and in Listing 8-3 you can see the additions I made to set up request tracing.
Listing 8-3. Enabling Request Tracing in the Web.config File
<?xml version="1.0" encoding="utf-8"?>
<configuration>
  <appSettings>
    <add key="webpages:Version" value="3.0.0.0" />
    <add key="webpages:Enabled" value="false" />
     <add key="ClientValidationEnabled" value="true" />
    <add key="UnobtrusiveJavaScriptEnabled" value="true" />
  </appSettings>
  <system.web>
    <compilation debug="true" targetFramework="4.5.1" />
    <httpRuntime targetFramework="4.5.1" />
    <trace enabled="true" requestLimit="50" />
  </system.web>
  <system.webServer>
    <modules>
      <add name="Log" type="Mobile.Infrastructure.LogModule"/>
    </modules>
  </system.webServer>
</configuration>
The trace element is defined in the system.web section and controls the tracing feature. There are several attributes that can be used to fine-tune the way that tracing is performed, as described in Table 8-4. The configuration I have defined in the listing is a good starting point for most projects.
Table 8-4. The Attributes Defined by the trace Element
Name |
Description |
|---|---|
enabled |
When set to true, the request tracing feature is enabled. |
localOnly |
When set to true, the trace viewer (which I describe in the next section) is accessible only when requested from the local machine. IIS Express, which is used to run ASP.ET applications during development, accepts only local requests by default, so enabling this option has no effect until the application is deployed. |
mostRecent |
Trace information is discarded when the number of requests received by the application exceeds the value of the requestLimit attribute. Setting this attribute to true discards the oldest requests, while false (the default value) discards newer requests. |
requestLimit |
Specifies the number of request traces that will be stored for viewing. The default value is 10. |
writeToDiagnosticsTrace |
When set to true, trace messages are written to the System.Diagnostics.Trace class. See the “Adding Custom Trace Messages” and the “Using Adding Trace Messages to Glimpse” sections for details. |
![]() Tip The trace element defines additional attributes beyond the ones I described in the table, but they either work only with Web Forms applications or are not especially useful in an MVC framework application.
Tip The trace element defines additional attributes beyond the ones I described in the table, but they either work only with Web Forms applications or are not especially useful in an MVC framework application.
View Request Traces
The request trace information is available through the special /trace.axd URL. To see the way that tracing works, start the application, request the /Home/Browser and /Home/Index URLs (the only two supported by the example application), and then request /trace.axd. You will see a summary of the requests received by the application, as shown by Figure 8-1.
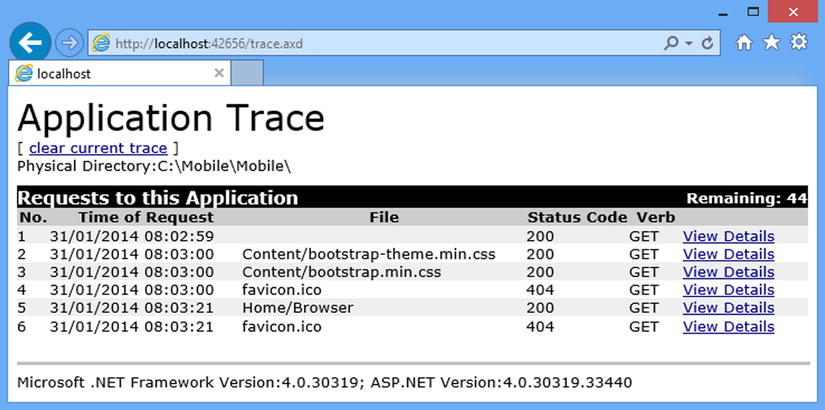
Figure 8-1. The summary of request traces
The list of requests that you see will, naturally, depend on which URLs you requested and which files your browser has cached. The summary shows the sequence in which requests have arrived, the URL that they requested (which is in the File column, a remnant from Web Forms), the request HTTP method, and the status code that was sent back to the client.
![]() Tip Notice that some of the requests shown in the trace summary are for favicon.ico, which is the browser’s attempt to obtain a favorite icon for the application. Wikipedia has a good summary of favorite icons and their use: http://en.wikipedia.org/wiki/Favicon.
Tip Notice that some of the requests shown in the trace summary are for favicon.ico, which is the browser’s attempt to obtain a favorite icon for the application. Wikipedia has a good summary of favorite icons and their use: http://en.wikipedia.org/wiki/Favicon.
You can inspect individual requests by clicking one of the View Details links. This displays the detailed trace data, as shown in Figure 8-2.
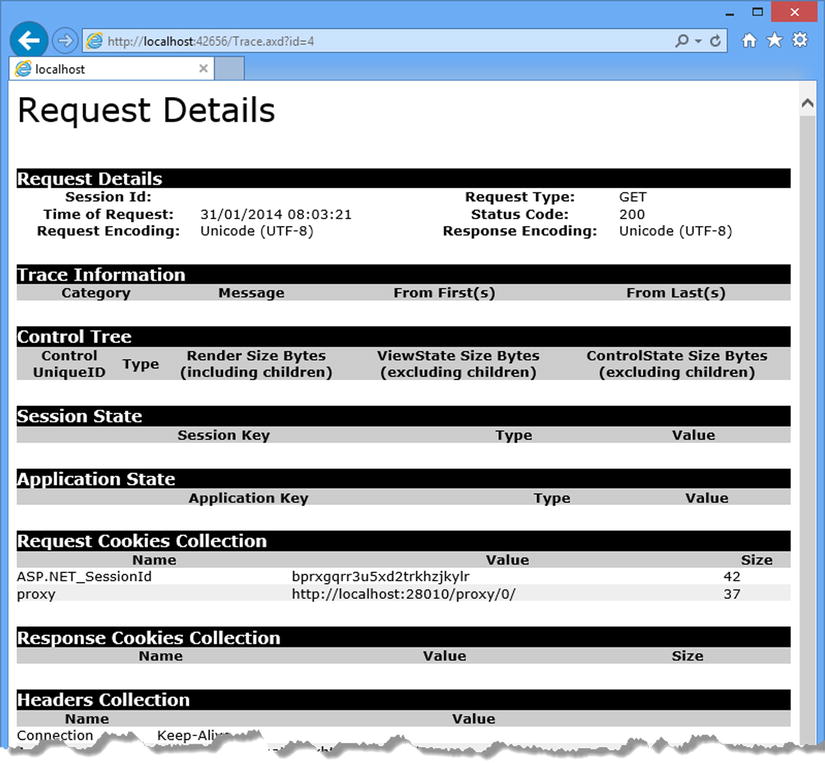
Figure 8-2. Detailed trace data
I have shown only part of the trace detail because there is so much information, covering every aspect of the request. Some sections, such as Session State and Application State, will be empty because they relate to features that I don’t describe until Part 3. But even so, you can see a complete set of the request headers, cookies, and details of form and query string data. There are some holdovers from Web Forms, such as the Control Tree section, that has no bearing on an MVC framework, but most of the data is pertinent and can be helpful in understanding how multiple requests relate to one another.
The default trace data can be useful, but it is generic to all applications and may not give you the insights that you are looking for. Fortunately, you can tailor the trace data by adding custom trace messages to your application, which is done through the HttpContext.Trace property, which returns a TraceContext object. The TraceContext class defines the methods shown in Table 8-5.
Table 8-5. The Methods Defined by the TraceContext Class
Name |
Description |
|---|---|
Warn(message, category) |
Writes the specified message as a warning (which is shown in red in the Trace Information section of the trace detail) |
Write(message, category) |
Writes the specified message to the Trace Information section |
The messages written using the Write and Warn methods are collected as part of the trace and displayed in the Trace Information section of the detailed request trace data. In Listing 8-4, you can see how I have used the TraceContext methods to simplify the LogModule class that I created in the previous section.
Listing 8-4. Using Request Tracing in the LogModule.cs File
using System.Web;

namespace Mobile.Infrastructure {
    public class LogModule : IHttpModule {
        private const string traceCategory = "LogModule";

        public void Init(HttpApplication app) {
            app.BeginRequest += (src, args) => {
                HttpContext.Current.Trace.Write(traceCategory, "BeginRequest");
            };

            app.EndRequest += (src, args) => {
                HttpContext.Current.Trace.Write(traceCategory, "EndRequest");
            };

            app.PostMapRequestHandler += (src, args) => {
                HttpContext.Current.Trace.Write(traceCategory,
                    string.Format("Handler: {0}",
                        HttpContext.Current.Handler));
            };

            app.Error += (src, args) => {
                HttpContext.Current.Trace.Warn(traceCategory, string.Format("Error: {0}",
                    HttpContext.Current.Error.GetType().Name));
            };
        }

        public void Dispose() {
            // do nothing
        }
    }
}
My module has become simpler because I don’t have to worry about working out relative timings or synchronizing access to shared data and resources—these tasks become the responsibility of the request tracing system. And, of course, generating trace messages isn’t just for modules; you can instrument any part of the application, including the controllers and views. In Listing 8-5, you can see how I have added tracing to the Home controller.
Listing 8-5. Adding Tracing in the HomeController.cs File
using System.Web.Mvc;
using Mobile.Models;

namespace Mobile.Controllers {

    public class HomeController : Controller {

        private Programmer[] progs = {
            new Programmer("Alice", "Smith", "Lead Developer", "Paris", "France", "C#"),
            new Programmer("Joe", "Dunston", "Developer", "London", "UK", "Java"),
            new Programmer("Peter", "Jones", "Developer", "Chicago", "USA", "C#"),
            new Programmer("Murray", "Woods", "Jnr Developer", "Boston", "USA", "C#")
        };

        public ActionResult Index() {
            HttpContext.Trace.Write("HomeController", "Index Method Started");
            HttpContext.Trace.Write("HomeController",
                string.Format("There are {0} programmers", progs.Length));
            ActionResult result = View(progs);
            HttpContext.Trace.Write("HomeController", "Index Method Completed");
            return result;
        }

        public ActionResult Browser() {
            return View();
        }
    }
}
My example application isn’t complex enough to need any real tracing, so I have added messages to report when the Index action method is invoked, the number of data items, and when the method has completed and only needs to return the result. (I have assigned the ActionResult returned from calling the View menu to a local variable so that I can insert a trace method between creating the result and returning it.)
It is also possible to add trace statements to views, although they make the views harder to read. As a consequence, I tend to limit my use of trace statements in views to just those I need to track down a complex layout problem (sadly, these are usually problems of the “duh” variety where I have mistyped a partial view name but can’t see the error despite looking at the problem for quite a while). In Listing 8-6, you can see how I added a trace statement that reports on each data item as it is rendered.
![]() Tip I have added the trace statement to the Programmers.cshtml partial view but not Programmer.Safari.cshtml. If you still have your browser configured to emulate the iPhone from the previous chapter, now is the time to return to using Internet Explorer or to disable Chrome device emulation.
Tip I have added the trace statement to the Programmers.cshtml partial view but not Programmer.Safari.cshtml. If you still have your browser configured to emulate the iPhone from the previous chapter, now is the time to return to using Internet Explorer or to disable Chrome device emulation.
Listing 8-6. Adding Trace Statements to the Programmers.cshtml File
@using Mobile.Models
@model Programmer[]

<table class="table table-striped">
    <tr>
        <th>First Name</th>
        <th class="hidden-xs">Last Name</th>
        <th class="hidden-xs">Title</th>
        <th>City</th>
        <th class="hidden-xs">Country</th>
        <th>Language</th>
    </tr>
    @foreach (Programmer prog in Model) {
        Context.Trace.Write("Programmers View",
              string.Format("Processing {0} {1}",
                prog.FirstName, prog.LastName));
        <tr>
            <td>@prog.FirstName</td>
            <td class="hidden-xs">@prog.LastName</td>
            <td class="hidden-xs">@prog.Title</td>
            <td>@prog.City</td>
            <td class="hidden-xs">@prog.Country</td>
            <td>@prog.Language</td>
        </tr>
    }
</table>
I don’t like putting C# statements in view files, which is another reason why I use trace statements sparingly in views.
![]() Tip I didn’t need to prefix the call to the Context.Trace.Write method with an @ character in the listing because the statement appears inside the foreach block.
Tip I didn’t need to prefix the call to the Context.Trace.Write method with an @ character in the listing because the statement appears inside the foreach block.
To see the custom trace messages, start the application, request the /Home/Index URL, and then request /trace.axd. Select the request for /Home/Index, and you will see the trace messages in the Trace Informationsection of the output, as shown in Figure 8-3.
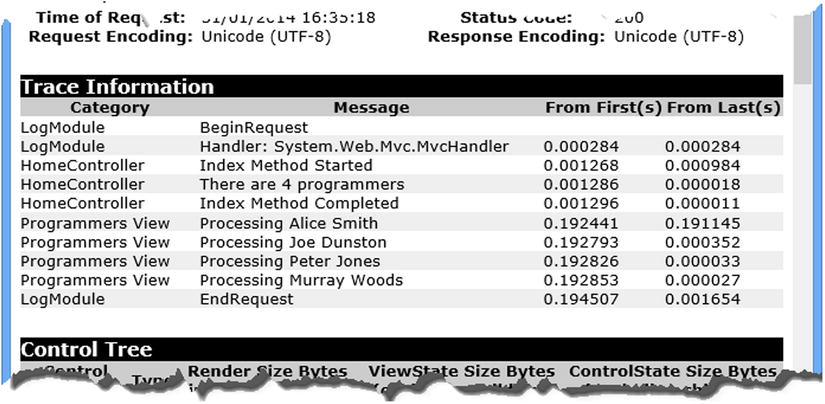
Figure 8-3. Adding custom trace messages
The category information shows the flow of the request through the ASP.NET platform and the MVC framework, and individual messages provide detailed insights. The two columns of numbers provide timing information, which is always helpful in finding performance bottlenecks. The From First column shows the elapsed time since the first trace message, and the From Last column shows the elapsed time since the previous trace message. All times are expressed in seconds, and using the data in the figure, I can see that the elapsed time from the BeginRequest to the EndRequest method was 0.19 seconds and that most of that time passed from the point at which the action method returned its result, and I can see when the view rendering began.
![]() Tip The timing information in the figure was for the first request after I started the application. There is a lot of startup preparation that is performed only when the first request is received, including preparing the routing system, generating a list of its controller classes, and compiling the view files into C# classes. This work isn’t done for subsequent requests, which is why the elapsed time for the second request to the same URL took only 0.004 seconds on my development PC.
Tip The timing information in the figure was for the first request after I started the application. There is a lot of startup preparation that is performed only when the first request is received, including preparing the routing system, generating a list of its controller classes, and compiling the view files into C# classes. This work isn’t done for subsequent requests, which is why the elapsed time for the second request to the same URL took only 0.004 seconds on my development PC.
I use the custom tracing and logging approaches when I need to find a specific problem, but I use a tool called Glimpse when I don’t know where to start looking or when I need to look at the overall behavior of the application. Glimpseis an open source diagnostics package that builds on the ASP.NET logging and tracing features and adds a lot of useful insight into how requests are handled within an application. In the sections that follow, I’ll show you how to install and use Glimpse and explain why I find it so useful. Table 8-6 puts Glimpse into context.
Table 8-6. Putting Glimpse in Context
Question |
Answer |
|---|---|
What is it? |
Glimpse is an open source diagnostic tool that captures detailed information about requests. |
Why should I care? |
Glimpse provides a level of detail that is beyond what the built-in tracing feature provides and is extensible to other software components and other parts of the ASP.NET technology stack. |
How is it used by the MVC framework? |
The MVC framework does not rely on Glimpse, which is a third-party tool unrelated to Microsoft. |
The simplest way to install Glimpse is using NuGet. Enter the following command into the Visual Studio Package Manager Console:
Install-Package Glimpse.MVC5When you hit Enter, NuGet will download and install the Glimpse packages that support MVC framework applications. The package I have installed is for MVC5, but there are also packages for earlier MVC releases.
Once the installation is complete, start the application and navigate to the /Glimpse.axd URL. You will see the Glimpse configuration page, as shown in Figure 8-4.
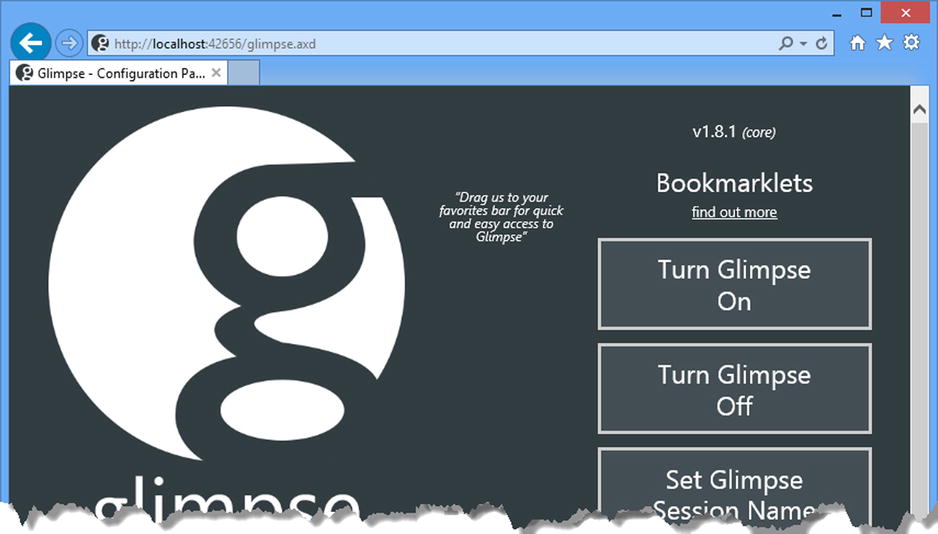
Figure 8-4. Configuring Glimpse
![]() Tip Glimpse has a large catalog of extensions and packages that can be used to extend monitoring to other software components, including Entity Framework, and other parts of the ASP.NET technology stack, such as SignalR. See http://getglimpse.com for details.
Tip Glimpse has a large catalog of extensions and packages that can be used to extend monitoring to other software components, including Entity Framework, and other parts of the ASP.NET technology stack, such as SignalR. See http://getglimpse.com for details.
Click the Turn Glimpse On button to enable Glimpse diagnostics. The /glimpse.axd page is also used to configure Glimpse, but the default configuration is suitable for most projects, and I don’t need to make any configuration changes for this chapter.
Using Glimpse
Using Glimpse is as simple as requesting a URL from your application. Glimpse inserts a toolbar at the bottom of the screen that summarizes how the request has been handled, as shown in Figure 8-5.
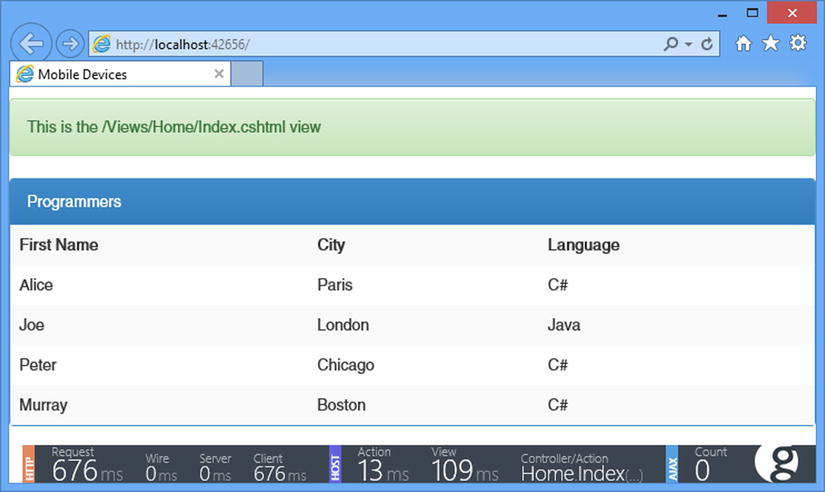
Figure 8-5. The Glimpse toolbar
It can be hard to make out the details of the toolbar from Figure 8-5, so I have increased the scale and broken the bar into sections in Figure 8-6 so you can see the details.
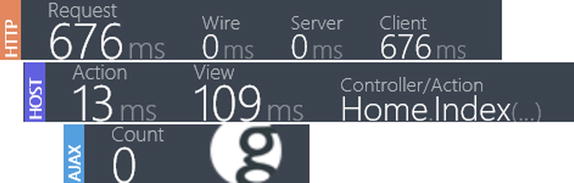
Figure 8-6. A closer look at the Glimpse toolbar
The summary is broken down into three sections. The HTTP section reports on the total amount of time elapsed from the moment that the request was started until the moment when the response was rendered and displayed to the user. The HOST section provides information about how long the action targeted by the request took to execute and how much time it took for the view be rendered. The final section, AJAX, summarizes the Ajax requests made by the content received from the server.
You can get more detailed information by moving the mouse over a section. Figure 8-7 shows the details of the HOST section, which is the one that you will most often be interested in when working with the ASP.NET platform.
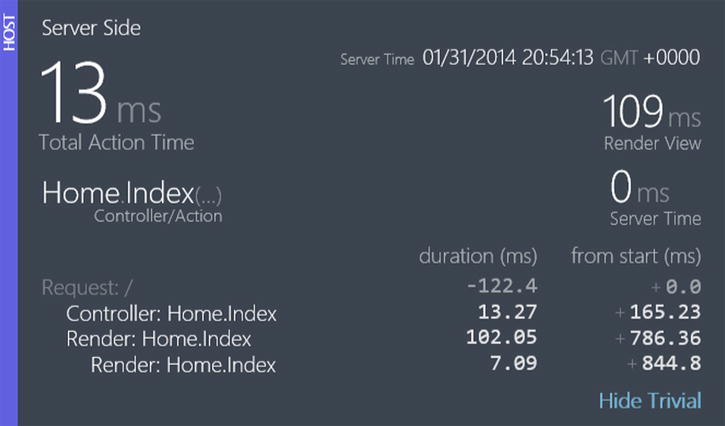
Figure 8-7. A more detailed view of the HOST section
Glimpse provides a lot more detail about requests when you click the G icon at the right edge of the toolbar. This opens a tabbed window that details every aspect of the request and how it was handled by the applications. There are tabs that detail the request, the configuration and environment of the server, state data (which I describe in Chapter 10), the routes that matched the request and much more. One of the most useful tabs is called Timeline, and it provides performance information about the way that the request was processed, as illustrated by Figure 8-8.
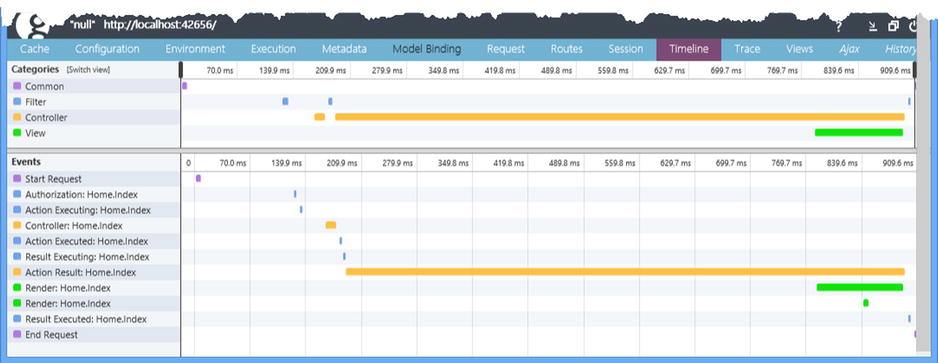
Figure 8-8. The Glimpse Timeline tab
The Timeline tab shows the amount of time the request spent in the ASP.NET platform and the amount of time the MVC framework spent executing controllers, filters, and views. There is also an end-to-end view that shows the flow of the request through the different components of the application, which can help identify those actions or views that are taking too long to complete. I am only touching on the surface of the information provided by Glimpse, but you can see that there is a lot of detail available, and I recommend that you take the time to explore it fully.
Adding Trace Messages to Glimpse
One of the tabs in the Glimpse detail view is Trace, but it doesn’t capture the messages written through the HttpContext.Trace object unless you set writeToDiagnosticsTrace to true on the trace element in the Web.config file, as shown in Listing 8-7.
Listing 8-7. Forwarding Trace Messages So They Can Be Read by Glimpse
<?xml version="1.0" encoding="utf-8"?>
<configuration>
  <configSections>
    <section name="glimpse" type="Glimpse.Core.Configuration.Section, Glimpse.Core" />
  </configSections>

  <appSettings>
    <add key="webpages:Version" value="3.0.0.0" />
    <add key="webpages:Enabled" value="false" />
     <add key="ClientValidationEnabled" value="true" />
    <add key="UnobtrusiveJavaScriptEnabled" value="true" />
  </appSettings>
  <system.web>
    <compilation debug="true" targetFramework="4.5.1" />
    <httpRuntime targetFramework="4.5.1" />
    <trace enabled="true" requestLimit="50" writeToDiagnosticsTrace="true"/>
    <httpModules>
      <add name="Glimpse" type="Glimpse.AspNet.HttpModule, Glimpse.AspNet" />
    </httpModules>
    <httpHandlers>
      <add path="glimpse.axd" verb="GET" type="Glimpse.AspNet.HttpHandler,
           Glimpse.AspNet" />
    </httpHandlers>
  </system.web>

  <system.webServer>
    <modules>
      <add name="Log" type="Mobile.Infrastructure.LogModule" />
      <add name="Glimpse" type="Glimpse.AspNet.HttpModule, Glimpse.AspNet"
          preCondition="integratedMode" />
    </modules>
    <validation validateIntegratedModeConfiguration="false" />
    <handlers>
      <add name="Glimpse" path="glimpse.axd" verb="GET"
       type="Glimpse.AspNet.HttpHandler, Glimpse.AspNet" preCondition="integratedMode" />
    </handlers>
  </system.webServer>

  <glimpse defaultRuntimePolicy="On" endpointBaseUri="∼/Glimpse.axd"></glimpse>
</configuration>
The additions to the Web.config file were added when Glimpse was installed. If you restart the application, open the Glimpse tabbed window, and move to the Trace tab, you will see the trace messages from the module, as shown in Figure 8-9.
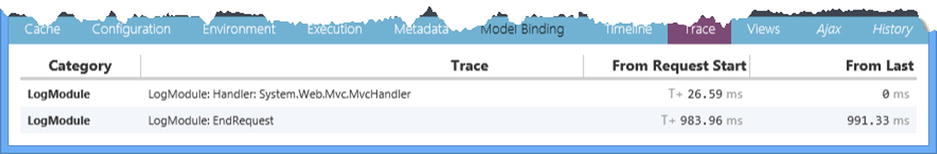
Figure 8-9. Trace information displayed by Glimpse
Summary
In this chapter I showed you the facilities that ASP.NET provides for logging and tracing requests. I showed you how to handle the LogRequest method in the request life cycle and explained the use of the TraceContext class, instances of which are available through the HttpContext.Trace property. I demonstrated the built-in ASP.NET support for viewing trace information and finished the chapter by introducing Glimpse, which is an excellent open source diagnostics tool. In Part 3, I show you how ASP.NET builds on the foundation of handling features that described in this part of the book to provide useful services to web application developers.