Just as athletes can’t win without a sophisticated mixture of strategy, form, attitude, tactics, and speed, performance engineering requires a good collection of metrics and tools to deliver the desired business results.
—Todd DeCapua
Introduction
Performance Tests are another aspect of software testing. We can say that performance tests are not about “if things work” but rather “how things work,” and that positions them as a unique test bundle compared to the other test methods.
What is the basic idea of performance testing
How measure() function works and how to define a baseline
The different metrics you can use starting from Xcode 11
How to configure your tests
How to write a-sync performance testing
Where Xcode saves your test baseline information so you can adjust it to your CI/CD environment
The Basic Idea of Performance Test
Unlike other tests such as Unit or Integration tests, Performance Tests are a little “catchy.” They have several unique characteristics, which make them less predictable.
For example, running performance tests on an old device probably produces different results than running them on a new one.
Also, on one run, you can have a certain result, which may be different than the second or the third run. Not to mention other factors such as machine state, CPU load, free memory, caching, and more.
Each tested code runs several times to prevent any one-time result that may affect our test results. At the end of the test run, the final results will be based on the average of all executions.
Because the average result might be different from tests to test, it is not enough to satisfy our needs. We still need to set some baseline to make sure the change is not too big and it’s within the reasonable spectrum.
The last issue is also a major one – the baseline is linked to a specific device based on its UUID. The reason is obvious – not only that each device has different hardware, but it also has different settings and installed software.
So, the unpredictable nature of performance tests makes it a unique creature in our testing suite, and we should use it for specific use cases or flows that may cause us performance issues in future changes.
The Basic Measuring Function
In the preceding test, we have a class named ImageProcessor with a function called generateImage(). We know that the function generateImage() is doing some heavy task, and we want to execute this code as part of the measure function.
The Measure() function is part of XCTestCase, and it’s the basic performance method we have. It has one single parameter, which is a closure. What measure() function does is executing the closure ten times and calculating the average time in the end.

Running our first performance test
We see some interesting information after our first run. First, we see the average time, 1.127 seconds. We also see a message saying there is no baseline time. This leads to our third insight – you can see that our test actually passed.
Unlike other tests, performance tests don’t use assertion. Instead, we define a baseline for our metric to make sure our result stays below it.
Define the Baseline

Performance Result Settings window
In this popup, you can see additional information about your run and an option to set a baseline easily by just pressing a button.
On the lower part of the popup, you can see your executions over time.
It’s not rare for the first execution to be much longer than the others. It has to do with things like caching or internal behaviors of the Swift language. This is part of the reason we run this test several times to get a score that is closed to a real-life state.
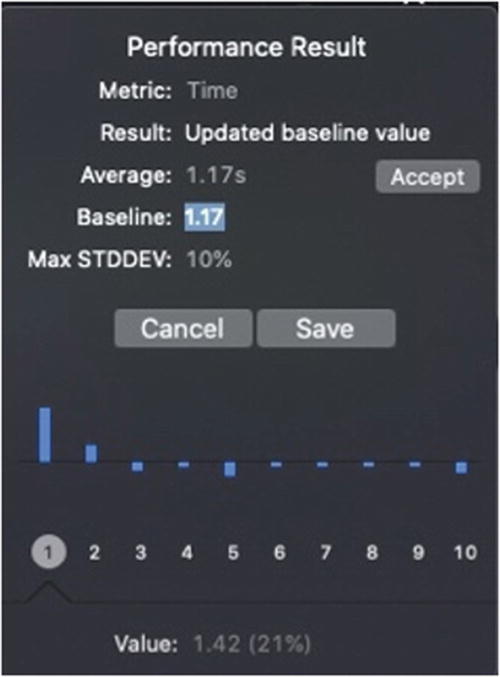
Performance test baseline edit
Tapping the “Accept” button sets the current average result as our baseline for the next test.
You can also edit the baseline manually just by tapping it and type the new value.
To confirm the change, just press on “Save”.
What the “Baseline” Means for Our Test?
Performance tests are based on two important values – Baseline and Max STDDEV.
The Baseline value is the bar your test needs to reach. If your execution code runs 10%+ slower than the baseline, your test will fail.
Another value being calculated is the standard deviation, the STDDEV. If the deviation of your runs is more than 10%, a value that can be changed easily, your test will fail as well.
Why Is the Deviation Important?
It may be an indication of a problem in your code. Basically, you need to expect heavily loaded code to perform similarly in multiple runs. If this is not the case, it means your code executes in an unexpected manner and maybe be affected by external values or states.
A big deviation means that there are some executions that are slow, much slower than the average score you get. It also means that our average score is not relevant and our users experience poor performance even though our test might be below the baseline.
If your test fails because of high deviation, don’t increase the bar for no reason. You should investigate the behavior of your code before making any changes.
measure(metrics:) Function
Up until Xcode 11, the only metric you could measure is execution time.
XCTClockMetric – This is the execution time metric similar to what we’ve learned in the previous section.
XCTCPUMetric – This metric gives you information about the CPU activity during the run.
XCTMemoryMetric – Measure allocated during the test.
XCTStorageMetric – Record bytes written to disk.
XCTOSSignpostMetric – Measure execution time for a specific part of your code, defined externally in your code using os_signpost functions.
The most basic metric developers use is the time/clock metric, but there are many cases why you would want to check other metrics as well.

Setting baselines to all metrics
This is plenty of information! Let’s try to dig in and understand what it means.
Analyzing the Metrics
Clock Monotonic Time
This measurement is part of the XCTClockMetric, and it measures the exact duration of your execution block. At this point, I want to explain what exactly Monotonic Time means.
We measure the time before the execution and the time after the execution. Obviously, the elapsed time between them is the duration of the execution, right?
Well, not exactly. Doing that would be wrong.
There are two different clocks in almost every modern operating system – the Wall Clock and Monotonic Clock.
The Wall Clock is the clock that is presented to the user (and the application). This is the time that we get when we use the Date() function to get the current time. Wall Clock time is affected by NTP (Network Time Protocol) and can be synchronized during the application running. Therefore, not only the elapsed time might not be accurate; it can even be negative.
Monotonic Clock, on the other hand, cannot be affected by any external influence. Monotonic Clock is not aiming to give the current time since it doesn’t have a “starting point.” What it does is to give you a stable duration measurement, and this is why we use it in performance tests.
CPU Cycles, CPU Time, and CPU Instructions
OK, so we have a clock time, why do we need a “CPU Time”? And what is it anyway?
So, first, CPU Time doesn’t represent the total execution time, but only the time the CPU was busy executing your instructions. For example, the total execution duration also includes any I/O operations or even network requests (although it’s not recommended to include network time in your performance tests).
So, if you want to eliminate any external factors and focus on your processing time, CPU Time under XCTCPUMetric is the way to go.
So, what are CPU Instructions Retired and CPU cycles?
CPU Cycles is the metric that shows you how much your CPU worked hard during the block execution, and CPU Instructions metric contains the number of the actual instructions completed – in general, a low number of instructions for the same task, points of better efficiency, and power consumption.
Checking Your Writing Activity with XCTStorageMetric
XCTStorageMetric is another interesting aspect of the performance tests. Instead of measuring time, it measures your writing to disk activity. This might not sound like an interesting metric, but when concluding it with the clock metric, it’s a great metric to help you optimize your code.
Writing to disk is considered to be a heavy task much more than writing to memory. It is best practice to avoid it if possible. A big increase in this metric can explain poor results in the clock metric and can be an indication of unnecessary writing activity.
More Configuration with XCTMeasureOptions
Using performance metrics is pretty straightforward. In fact, they are so useful and effective that you don’t really need any configuration for them. But, still, there is an option that can help you tune your performance tests better to get more accurate results.
The way of doing that is bypassing an object of type XCTMeasureOptions. XCTMeasureOptions was added along with the performance test metrics, and it has two properties that you are able to configure.
iterationCount
The first property you can update is the iterationCount . This property defines the number of times your test runs. The default is 5, but you should be aware that XCTest always adds another iteration and ignores it (it actually ignores the first one).
Why would we want to change the number of iterations? There could be two reasons – the first one is heavy and time-consuming performance tests that you want to run no more than one or two times. The second option might be the opposite – very small performance tests that you need to run many times to get accurate results as possible.
In 95% of the cases, you don’t need to change the default value. Also, if you run your test without passing an XCTMeasureOptions object, the number of iterations will be ten times and not five as described earlier in this chapter.
invocationOptions
Performance tests are great, but they still have one major drawback, and that’s controlling the start and the end of the measured part of your code.
I’ll explain – we know that performance tests run multiple times, and they all should start from the same state. In fact, they are exactly like any other tests – you need to have some setup code before you start and do a cleanup when you finish.
The problem is that you need to execute the setup and cleanup code inside the measured block, which means that all the metrics cover these parts of your block as well.
The invocationOptions property lets you define how your measurements are taken. It’s an optionSet that has two options – manuallyStart and manuallyStop.
If invocationOptions contains manuallyStart, it means that measurements are taken when you call the function self.startMeasure() in your execution code. If manuallyStop is included in invocationOptions, it means the Xcode stops the measurement when on self.stopMeasure().
Looking at the code, you can see we can easily insert some setup and cleanup code inside our execution closure and define exactly what part we want to measure.
Measuring App Launch
One great way you can make use of performance tests is to measure your app launch.
App launch time is extremely important to your app user experience and, in many cases, is the root of ongoing frustrations among users.
It is pretty amazing that in two rows we can measure our app launch time.
This test also contains baseline just like all the other performance tests, and since it’s already written for you, it’s recommended for you to include it in your test bundle.
Asynchronous Performance Tests
So, we can see how easy it is to measure the performance of a specific function/method by just wrapping it inside the measuring closure. But what if we want to measure an a-sync function?
In general, it is much simpler to measure synced functions, but it is still possible to also test a-sync function using the XCTestExpectation tool we’ve learned in previous chapters.
If you don’t remember how to use XCTestExpectation, go back to the unit test chapters and go over this part.
Open measuring closure while setting the automaticallyStart to yes.
Create the XCTestExpectations inside the closure. Now, this step is important. Creating the expectation object outside the closure will raise an exception.
Wait for the expectation to be fulfilled inside the closure, just like the expectation’s creation itself.
Remember that executions run one after the other, so the wait() function halts the run until the expectation is fulfilled before it continues to the next one.
Also, you need to be careful about the waiting timeout duration – if it’s too low, say, lower than the baseline, the test can fail even though it ran better than the baseline.
The Baseline Under the Hood
Unlike other tests, performance tests rely on the specs of the machine that runs them.
So, you can conclude that different machines give you different results; therefore, the baseline has to be corresponding to the host machine.
And this is something you need to understand, especially if you run your tests on a continuous integration environment – Xcode saves the baseline values for any combination of the host machine (your Mac) and device (including simulators).
Although iOS simulators are not emulators, meaning there shouldn’t be any CPU difference, they can still give you different results.
For example, you might turn off/on different features for different devices in your code. Also, the device resolution can have an impact on the simulator performance (again, this is up to the host machine as well).
Where Xcode Saves the Baseline?
This is an important question, especially if you work in a big corporate, and your app integration process is running on different machines.
True to Xcode 12, the baseline values are saved inside your Xcode project file.
Xcode project file (*.xcodeproj) is a package, meaning it’s actually a folder that displayed like a typical file.
To reveal the package content, right-click the package (xcodeproj) and select “Show Package Contents”.
Navigate to xcshareddata/xcbaselines/.
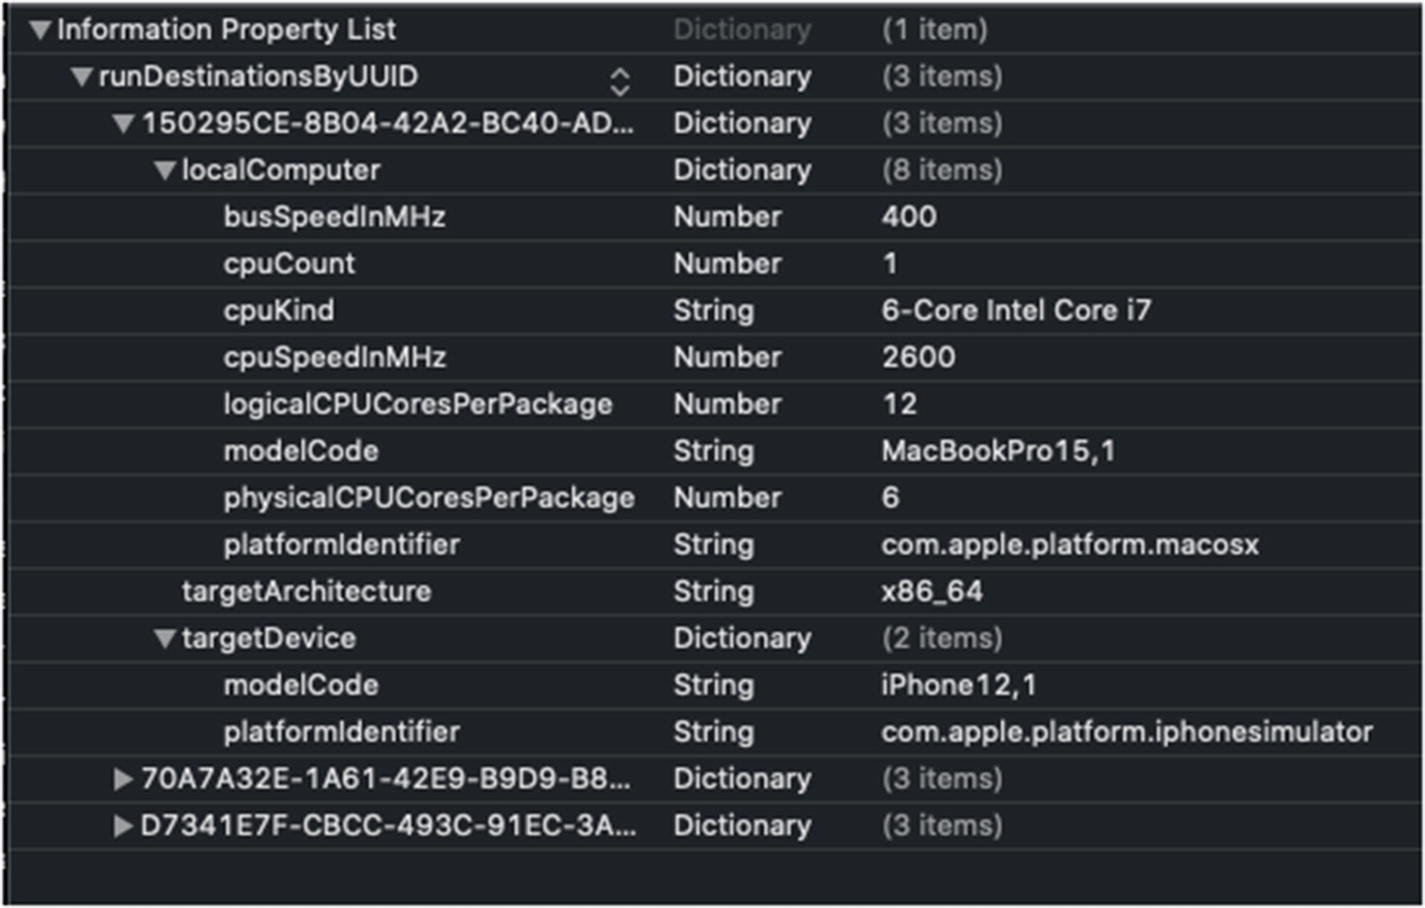
Info.plist file, containing the host machine details along with the target device information
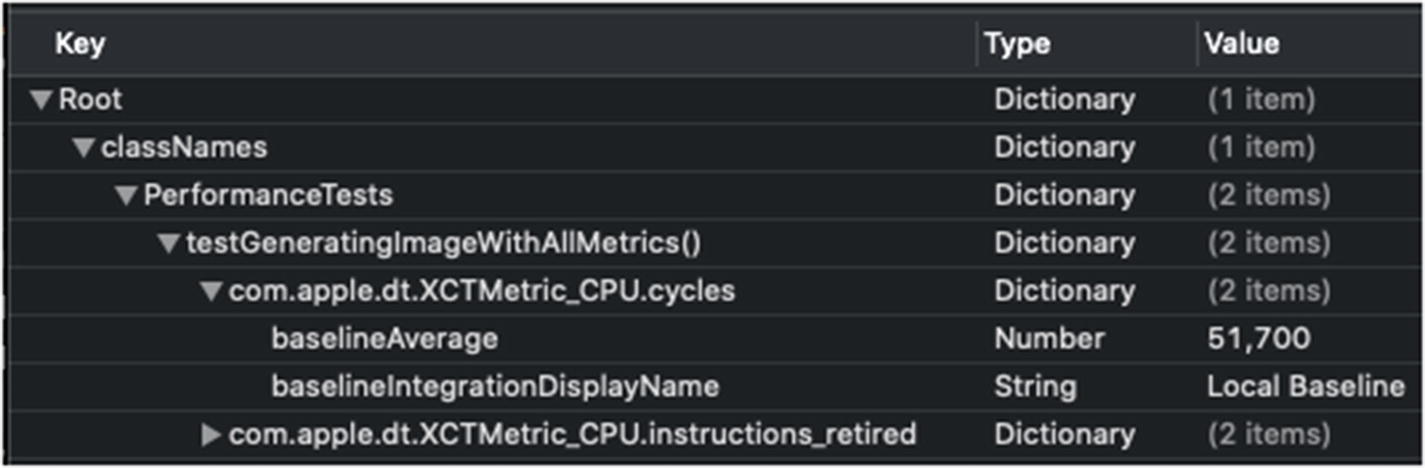
List of test methods and their baselines for each metric
How Xcode Pulls the Baseline from These Files
If you take a look again at Figure 8-5, you can see that Xcode doesn’t save the serial number of the machine, but rather its specs. This means that if you run your tests on a different machine but with the same specs, Xcode will pull the corresponding baselines for this test.
Why is this important? Because this is the way you can set the baselines for your CI environment – by adjusting the “combo” settings to match your remote machine.
Summary
You don’t have to write performance tests for every method in your project. More than that, there are projects that performance tests are useless.
Performance is all about the big numbers – if you have heavily loaded functions or pieces of code, this tool is a great way to optimize them and verify you don’t have any regressions. Not only testing performance on small, unimportant function is useless; it’s also a mistake that can make the maintenance of your test difficult.
We are heading to the next chapter – a technique that can help you define the “expected result” easily.