
8.2. Debugging
Unlike testing, debugging is an activity that starts after the code is ready and compiled to run. Debugging starts with monitoring and logging at runtime to troubleshooting as the problems emerge in a program's behavior.
The simplest and the most important starting point for debugging is the logging of operations. You can start to understand and troubleshoot problematic behavior only after you know what is going on.
8.2.1. Logging
Flex and BlazeDS applications have the advantage and flexibility of logging the operations both on the client and on the server side. In this section, I will cover client side logging first and then explain server-side logging.
8.2.1.1. Client-Side Logging
You can log all client-side interactions to a file locally on your computer. The Flash debug player has two primary ways of logging:
Trace method — The global trace method writes log messages to a file. Log messages are written as strings.
Logging API — This provides an abstraction on top of the global trace method, allowing greater control and definition of custom log targets for client-side log messages.
By default, the global trace method's output is written to a file called flashlog.txt, which resides in the Macromedia/Flash Player/Logs folder. This Macromedia folder, along with its subfolders, resides in a location that depends on your operating system. Platform-wise the location will be like so:
Windows — C:Documents and Settings<username>
OS X — /Users/<username>/Library/Preferences
Linux — /home/<username> (The folder itself is named .macromedia)
The output of the global trace method depends on your custom configuration, which is defined in a file called mm.cfg, which lies at the same location as the Macromedia preferences folder. You can configure error and trace output logging in the configuration file, as follows:
ErrorReportingEnable=1
TraceOutputFileEnable=1
Apart from logging your messages with explicit trace method calls, you can also direct all Flex-generated debug messages to flashlog.txt by including <mx:TraceTarget loglevel="2"/> in your code.
The standard client-side logger writes to a file on the local computer, but you may want to write the log file to a different destination, say the server. In such a case, you can leverage the Logging API and create a custom log target for the purpose.
The logging API defines three entities that work together to facilitate logging. The first of these three is a Logger, which implements the ILogger interface. The Logger captures log messages on the basis of two parameters:
Category — The identifier for a class or a subsystem.
Level — The attribute that specifies the message type. Values like Error, Debug, Warning, and Info make up the different levels.
The second entity in the logging framework is a LogTarget. The LogTarget gets the messages from a Logger and processes them. The default target, TraceTarget, writes all trace messages to the debugger console or the designated local file. The third entity is the destination itself where the log messages are written to.
In order to create a custom logging facility so that messages are written to the server, create a new LogTarget that captures the log messages and sends them down to the server. You can send the messages to the server using any of the remote service facilities such as web services, remote objects, or the HTTP service. Here, I will only illustrate the custom LogTarget, whose code is:
use namespace mx_internal;

public class ServerLogTarget extends LineFormattedTarget {
private var server : ClientLogService;
public function ServerLogTarget() {
super();
super.fieldSeparator = "##";
super.includeTime = true;
super.includeDate = true;
super.includeCategory = true;
super.includeLevel = true;
super.level = LogEventLevel.ALL;
//server = get an instance of the service that would send messages to the server }
public override function logEvent(event : LogEvent) : void {
var category : String = ILogger(event.target).category;
if (category.indexOf("mx.") != 0) {
super.logEvent(event);
}
}
mx_internal override function internalLog(message:String) :void {
if (server != null) {
//Call service method and pass the message to it so that it can write it to the
server }
}
}I choose to extend LineFormattedTarget, but you could also write one from the ground up. The internalLog method is where the messages are sent to the server by calling a service method that takes on the responsibility of writing messages to a server. The default internalLog method is overridden, and in order to do that successfully, you need to use the mx_internal namespace.
Next, let's look at the server-side logging facility that BlazeDS offers.
8.2.1.2. Server-Side Logging
The BlazeDS logging facility resembles a standard Java logging infrastructure such as log4j. The logging configuration is specified in services-config.xml and could look like this:
<logging>
    <target class="flex.messaging.log.ServerLogTarget" level="All">
        <properties>
            <prefix>[BlazeDS]</prefix>
            <includeDate>false</includeDate>
            <includeTime>false</includeTime>
            <includeLevel>false</includeLevel>
            <includeCategory>false</includeCategory>
        </properties>
        <filters>
            <pattern>Endpoint.*</pattern>
            <pattern>Service.*</pattern>
            <pattern>Configuration</pattern>
</filters>
</target>
</logging>You will notice that the following can be specified:
Logging level — This acts as the filter level at which the messages are logged.
String prefix — In the preceding example, it's BlazeDS, but you could specify any other prefix. It will be appended to every message that BlazeDS writes.
Date and time — The date and time of the log messages can be recorded.
Level — The level of information can be specified. If, for example, you chose to record "ALL" messages, you might want to know which messages are of what level type.
Category — This is the category that the message pertains to. This is a way of logically partitioning the log messages based on the class or subsystem that generates each one.
In the sample logging configuration, ServerLogTarget is the logging target. This means all that log messages are directed to the same destination as the Servlet logging facility. You could also choose to log messages to the console by specifying ConsoleTarget as the target.
You could write a custom log target to write the log messages to the Firebug console, a database target, or any other that you prefer.
Log files are the place you go to understand problems in your system. However, after preliminary investigation, you often need to analyze the application's behavior at runtime. Also, you may want to monitor application runtime details for reasons for problems beyond errors. You may want to monitor the amount of memory usage or the amount of CPU cycles used up by the application. This is when the profiler is a great tool to seek help from.
8.2.2. Profiling
Flash Builder comes with a built-in profiler, called Flex Profiler, which provides detailed views into a program runtime behavior. Alternatively, an open source debugger, called DeMonster Debugger, can be used. Sometimes it makes sense to use both in conjunction with each other.
In this section, you will learn about the Flex profiler first. The Flex profiler is an agent that connects with the Flex application it's profiling using a local socket connection. It uses the concept of sampling to collect data from your application at a certain frequency or sampling rate. This has two important side effects:
Not every operation is recorded, especially not to an accuracy level that exceeds the sampling rate.
The agent's connection and collection introduce new operations and impact performance, even if minimally.
The profiler collects and aggregates method runtime statistics, including the time it took to run a particular method, and on object creation and garbage collection.
The recorded and aggregated metrics are available for you to analyze using multiple views, which can be classified under two categories:
Performance Profile Views
Allocation Trace Views
8.2.2.1. Live Objects
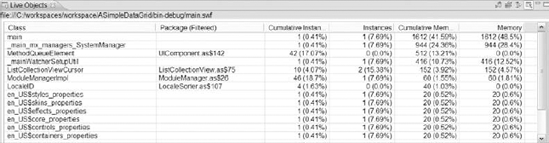
Live Objects view displays information on the classes in the current application, showing which objects are instantiated and how much memory they are taking up.
A Live view shows the following attributes in a tabular format:
Class — The name of the class
Package — The package name in which the class resides
Cumulative Instances — The number of object instances of a class that were created since application started
Instances — The number of object instances of a class that are currently in memory
Cumulative memory — The total amount of memory used up by all instances since the application started
Memory — The total amount of memory currently used up by all object instances
The Live Objects view is updated in real time during the interactions with the application. Look at Figure 8-9 to see what the Live Objects view looks like.
Figure 8.9. Figure 8-9
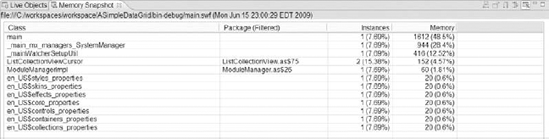
8.2.2.2. Memory Snapshot
The memory snapshot view is a static point in time view. This means that, unlike the Live Objects view, the Memory Snapshot view is not a view of updating data. You can take a memory snapshot at any point during interaction with an application. The Memory Snapshot view shows the following attributes in a tabular format:
Class — The name of the class
Package — The name of the package in which the class resides
Instances — The number of object instances at the time the memory snapshot was recorded
Memory — The amount of memory used at the time the memory snapshot was recorded
Look at Figure 8-10 to see what the memory snapshot view looks like.
Figure 8.10. Figure 8-10
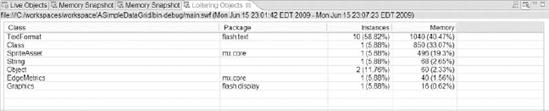
8.2.2.3. Loitering Objects
A few objects may remain in memory between two memory snapshots. These objects are visible in the loitering objects view. The loitering objects view shows the following attributes in a tabular view:
Class — The name of the class
Package — The name of the package in which the class resides
Instances — The number of instances created between two memory snapshots
Memory — The amount of memory allocated during the snapshot interval
Look at Figure 8-11 to see what the loitering objects view looks like.
Figure 8.11. Figure 8-11
8.2.2.4. Allocation Trace
The allocation trace view provides statistics for all objects created and memory used by method calls between two snapshot views. The allocation trace view shows the following attributes in a tabular view:
Method — The name of the method.
Package — The package in which the class resides.
Cumulative Instances — The total number of objects instances by a method and all the methods it calls in turn.
Self Instances — The total number of objects instances creates by the method itself. This does not count the objects created by the methods that this method calls.
Cumulative memory — The total memory used by all object instances created by a method and all methods called in turn.
Self memory — The total memory used by all object instances created by the method alone. The objects created by the methods called from this method are not counted.
Look at Figure 8-12 to see what the allocation trace view looks like.
Figure 8.12. Figure 8-12

8.2.2.5. Object References
Object references, which appear when you click on the class name in the Live Object or Memory Snapshot view, shows the referenced objects. The following attributes are shown:
Instance — The class of the object that holds a reference to the particular object
Property — The property of the object that holds a reference to the particular object
ID — The reference ID of the object that holds a reference to the particular object
Look at Figure 8-13 to see what the object references view looks like.
Figure 8.13. Figure 8-13

8.2.2.6. Object Statistics
The object statistics show the caller and callee of a group of objects. This view is accessed by double-clicking on the class name in the allocation trace view. There are three parts of the Object Statistics view:
Summary view — Summary statistics contains the same data as the corresponding row in the allocation trace view.
Self Instances — This contains information only on the objects instantiated by the particular method call and not the subsequent chain of method calls. The following pieces of information are shown:
Class — The name of the class
Package — The name of the package in which the class resides
Self Instances — The number of object instances directly instantiated by the method itself
Self Memory — The amount of memory consumed directly by the object instances created by the method itself
Callee Instances — This provides information on object instances created by method calls from within a method. The following pieces of information are shown:
Class — The name of the class
Package — The name of the package in which the class resides
Cumulative instances — The total number of instances created in the method and in the subsequent calls
Cumulative memory — The total amount of memory consumed in the method and in the subsequent calls
8.2.2.7. Performance Profile
This view provides information on how the methods performed during a particular time interval. This view is accessed by double-clicking on the performance snapshot in the profile view. The following information is shown:
Method — The name of the method
Package — The name of the package in which the class that contains the method resides
Calls — The number of the times the method was called
Cumulative time — The total time taken during the method call and all its subsequent calls from within the method
Self time — The total time taken during the method call alone
Average cumulative time — The average time taken during the calls to the method and its subsequent calls from inside the method
Average self time — The average time taken during the calls to the method
You can also click on the method name to see the specific statistics. In addition, the memory graph also shows the memory usage pattern.
All the discussion so far on profiling has only taken Flex Profiler into consideration. You could also use DeMonster Debugger. Besides this, for the BlazeDS part of the code, you could use the Eclipse Java Profiler and leverage Find Bugs, http://findbugs.sourceforge.net/, to debug the Java application at runtime.
This chapter was an aggregation of numerous strategies and approaches to testing and debugging and, while it cannot claim complete coverage, it certainly is a place where you have learned a lot about getting your Flex applications ready for release.