
Business intelligence concepts
Doing business intelligence with Excel 2010 and Excel Services
Building dashboards, KPIs, and scorecards using PerformancePoint
Integrating SQL Server Reporting Services R2 with SharePoint 2010
Reporting on SharePoint Data using Access 2010 and Access Service
Business intelligence (BI) is an umbrella term that refers to technologies, applications, and a number of exercises an organization may use to deploy shared business processes across multiple business units. Business Intelligence empowers users with the right insights and enables them to make better, faster, and more relevant decisions when they collaborate.
The focus of this chapter is on bringing SharePoint developers up to speed with the BI features of SharePoint Server 2010 through a series of step-by-step examples. This chapter also includes demonstrations of some of the new features shipped in the current wave of products with SharePoint Server 2010, Office Product 2010, and SQL Server 2008 R2.
Statistics in our industry state that the majority of people in organizations do not have proper access either to data or to the tools that they require to make effective business decisions. Think about it for a moment. With all the advancements happening so fast in the business intelligence sector, isn't this horrible?
When you look at the problem from different angles, it's obvious that part the problem lies in how we have been doing business intelligence over the past decade. This issue can be divided into three categories:
Complexity in adoption
Lack of must-have functionalities
Hardware and software specifications
Until recently, the greatest challenge in many organizations was the fact that accessing data for the purpose of analysis was something historically restricted to certain groups of people using very specialized tools. With only a handful of staff members able to make use of the BI solutions, business users would come with ad hoc inquires for information resulting in highly qualified BI experts becoming a bunch of report writers, rather than people who look after the BI solutions and fulfill the ongoing corporate BI needs.
Furthermore, it was difficult to give the company leaders the ability to gauge the state of their business at a glance, so they could make agile decisions to keep the business moving forward. In many cases, delivering timely and accurate reports to key decision makers that summarized strategic and operational data has been done in unbelievably inefficient ways, such as through emails and file shares that could easily provide the out-of-date data.
This left the door open for developers and third-party vendors to build custom applications that delivered reports to key decision makers efficiently, which in turn translated into more costs and more hardwired dependencies. Let's not forget that the most compelling reason to do BI is to support decision making. So, the question is: Why must customers pay extra for something that should have been included in the technology to begin with?
From the hardware perspective, building a decent BI solution required assembling the right hardware, compression algorithms, and networking components that constitute the solution. The challenge for many organizations extending the reach of their BI solutions to broader sets of users was the storage and the computing power that was required to host decent BI solutions and make them available to the masses.
Business intelligence is not only for answering the questions that users may have in mind. The more important part of BI is to help users ask the right questions, and also to guide them through an often resource-intensive process to get the insights they need. The types of questions may not necessarily be anticipated or preaggregated into the BI solutions, so the hardware, software, and bandwidth specifications for hosting those solutions must be powerful enough to respond to such on-demand queries in a reasonably fast manner.
All these issues created quite a number of hurdles for the IT industry over the past decade. In the next section, you will look at the history of Microsoft BI, the integration of BI into SharePoint products and technologies, and how Microsoft has managed to address a major portion, if not all, of these issues.
Like many other BI vendors at the time, Microsoft started its significant BI investment with the same limitations in adoption, lacking must-have functionalities and requirements for strong computing power. The problem was that most Microsoft BI solutions were strongly tied to SQL Server technology and SQL Enterprise Manager was the primary interface to interact with those solutions. Again, unless you knew how to work with SQL Server and to do BI, the chances that you were just a bystander in the whole BI world were very high!
Soon, Microsoft realized that the value of its BI platform would not become apparent until a paradigm shift occurred in its approach to doing traditional BI. Looking for a way to excel, Microsoft developed a new vision, which looked at things very differently than had been done before.
The new vision was based on taking BI to the masses, using it to connect people to each other and to connect people to data. The key area of focus was to take the BI out of the realm of specialty and niche tools and turning it into something that's mainstream. There were two primary justifications for the new vision. First, it would hide the difficulties of the underlying platform from the general public. Second, it would make the adoption of the platform much easier. Obviously, the more people that use a platform, the more valuable it becomes and the faster it grows.
Following the overall vision of "BI for everyone" and starting with SharePoint Portal Server 2003, Microsoft fostered this notion of integrating some aspects of their BI offering into their Information Portal technology. Theoretically, because SharePoint brings people together to work and make decisions collaboratively, it could have been the right starting point. However, this integration never extended beyond a couple of web parts natively rendering BI artifacts that are stored outside SharePoint content databases, in products such as Microsoft SQL Server Reporting Services 2000 and Microsoft Business Scorecard Manager 2005.
Okay, so what is wrong with storing BI artifacts outside SharePoint content databases? There are three obvious issues with this separation. First, you need to deal with a minimum of two separate products and repository frameworks to implement a single BI solution, which means more administrative effort. Second, users have to go through more than a hop to get to the backend datasource. For the environments without Kerberos delegation in place, this model can cause authentication issues — also known as double hops. The double-hop (one hop from the client browser to the SharePoint server and another hop to the BI server) problem is not a bug. It's an intentional security design to restrict identities from acting on behalf of other identities. Third, since the SQL Server based BI products and SharePoint Portal Server 2003 were using different security models, it was difficult to map SharePoint roles and permission-levels directly to the roles and permissions understandable by the BI product. In other words, it was difficult to apply a unified authorization model across the products.
In the spring of 2006, Microsoft acquired analytics vendor ProClarity, and soon Business Scorecard Manager 2005 and ProClarityAnalytics products were merged and formed a new product named Microsoft PerformancePoint Server 2007.
Later on, with the release of Microsoft Office SharePoint Server 2007, Microsoft's BI offering turned into something that was way more than just a couple of integration hooks, as is the case with SharePoint Portal Server 2003. In Microsoft Office SharePoint Server 2007 (MOSS 2007),
Microsoft made major improvements in four different areas: the Report Center template, full integration with SQL Server Reporting Services (SQL Server 2005 SP2), new Excel Services, and a Business Data Catalog for integration with line-of-business (LOB) applications.
Fortunately, Microsoft didn't stop there; they released more features that could change the way people used to build dashboard-style applications. Customers could use PerformancePoint Scorecard Builder 2007 and put together their own dashboards and publish them to the PerformancePoint monitoring server. Once the dashboards are published, customers could then use the Dashboard Viewer web part to integrate the dashboard into SharePoint pages. Again, the integration is just a web part that calls into PerformancePoint Server 2007 functioning as a standalone server. Both products were sold separately and they had different management environments and operations.
Even though the attempts Microsoft made to bring the best of both the SharePoint and BI worlds together in MOSS 2007 was great, it was still not enough to call it a full-fledged integration. In other words, the journey was not over yet! The next section is a sneak peek at some of the highlights of new BI features Microsoft has added to SharePoint Server 2010.
The team that was building SharePoint Server 2010 made significant changes based on the customer feedback and the lessons learned in MOSS 2007. Starting with SharePoint Server 2010 Server, PerformancePoint is designed as a service application on top of the SharePoint 2010 Server platform. What is important about the new design is that PerformancePoint and SharePoint are no longer two separate products. Instead, both are finally offered as an integrated product on the Enterprise CAL. The biggest advantage of this move is that PerformancePoint contents are all stored and secured within SharePoint libraries, and they can benefit from the new features and enhancements made to the core SharePoint platform. PerformancePoint itself got many new features and enhancements.
There are many improvements in Excel Services 2010. Microsoft started with limited PivotTable and Excel Services integration in SharePoint 2007 and then expanded beyond that very dramatically in the newest version of SharePoint products and technologies. SharePoint Server 2010 can integrate with a specialized version of SQL Server Analysis Services (SSAS) engine, which allows business analysts to benefit from more sophisticated and high-performing interactive queries using PowerPivot.
In a nutshell, PowerPivot is a collaborative effort across several teams in Microsoft to make Excel, SharePoint, and SQL Server R2 work together to allow all users to discover and manage the right information, all done through the familiar environments such as an Excel client or a web browser.
On the API side, the enhanced Excel Services programmability model allows developers to interact with published Excel workbooks in several ways, such as through Enhanced Web Service APIs, the JavaScript object model, or the REST API. Last, but certainly not least, Excel workbooks work both in the enterprise and in the cloud across many popular browsers such as Internet Explorer, Firefox, and Safari on Mac.
Reporting Services integration with SharePoint Server 2010 is much tighter and cleaner than before. Reporting Services 2008 R2 not only supports native and connected mode (previously known as SharePoint integrated mode), but it also supports a new lightweight integration mode named local mode. In this mode, customers need to install SharePoint Server 2010 and the SQL Server 2008 R2 Reporting Services add-in, but no Reporting Services server is required. Local mode is a valuable out of-the-box feature that allows the viewing of SSRS reports with no SSRS server. Reporting Services has seen a number of improvements as well, which are discussed later in this chapter.
Access Services 2010 is probably one of the biggest service areas for customers, because now they can model their databases in the Access client application, publish everything to SharePoint, and keep the client and server models in sync. In Access 2007, customers could only move the tables up to SharePoint, but the rest of application was still living in an ACCDB inside the Access client application. In Access 2010, you can move the entire application to SharePoint and map it to a SharePoint team site. All the tables and data become standard SharePoint lists, and the forms are converted to standard ASPX pages stored in SharePoint document libraries. Finally, data macros become workflows, and reports inside the application are turned into .rdl files and are associated with the Reporting Services report execution engine.
Recall from the previous section that one of the barriers to extending the reach of BI to everyone was the required computer power. With the current wave of Microsoft products, many of the desktop and large-server scalability issues are addressed. On the sever side, 64-bit-only products allow customers to take advantage of greater addressable memory range, modern CPU architectures, and multicore technologies, which in turn translates into tremendous computer power and faster BI solutions. On the client side, in-memory cache and compression algorithms allow BI analysts to load millions of rows of data into a PowerPivot workbook and do BI faster than ever.
The rest of this chapter discusses some of these new features in more detail.
As much as a BI developer may get confused when he or she first hears commonly used terms in SharePoint, such as "site" and "site collection," there are some BI terms that may sound a bit vague to a SharePoint developer with no BI background. Many BI techniques share terminology, and some terms are used interchangeably. In the interest of clarity, some of these terms are defined up front in this section and then referenced later on.
If you are a SharePoint developer, you are most likely very familiar with flat, table-style data structures, because lists in SharePoint mimic the exact same data storage format. Relational database management systems (RDBMSs), such as the SQL Server database engine, also use tables for storing data. Although storing data in tables has its own advantages, browsing through rows and columns rarely leads to useful analysis, especially when someone is looking for patterns and relationships that lie hidden in huge piles of data and information.
For instance, if you were analyzing Internet sales information of Adventure Works over the past few years, you would be more interested in the sums of sales per product, per country, and per quarter than in an analysis of the individual sales. Aggregating data at this level, although possible with most RDBMS engines, isn't the most optimized process.
Online Analytical Processing (OLAP) is a technology that tends to remove any granularity in the underlying data and focuses on enhanced data storage, faster data retrieval, and more intuitive navigational capabilities in large databases. Typically, OLAP's information comes from a database, referred to as a data warehouse. Compared to a relational database, a data warehouse requires much tighter design work up front for supporting analysis and data aggregation, such as summed totals and counts.
Because the storage unit used in OLAP is multidimensional, it's called a cube instead of a table. The interesting aspect of OLAP is its ability to store aggregated data hierarchically, and give users the ability to drill down or up aggregates by dimensional traits. Dimensions are a set of attributes representing an area of interest. For example, if you are looking at sales figures generally, you would be interested in geography, time, and product sales, as shown in Figure 13-1.

Dimensions give contextual information to the numerical figures, or measures, that you are aggregating on; for example, Internet sales amount, Internet gross profit, and Internet gross profit margin. OLAP calls each of these a measure. Because the measures are always preaggregated and anticipated by the cube, OLAP makes navigation through the data almost instantaneous.
If you want to look at a particular region that had a good quarter of sales, OLAP's navigational feature allows you to expand the quarterly view to see each month or day of the quarter. At the same time, you can also drill down into the region itself to find the cities with major increases in sales.
There are two more terms that need to be called out here:
Multidimensional Expressions (MDX): MDX is the query language that lets you query cubes and return data.
Datasource: A datasource is a stored set of information, such as tabular databases, OLAP cubes, Excel spreadsheets, SharePoint lists, or any other data object that contains the actual data.
Your database source for examples provided in this chapter is the AdventureWorks database for SQL Server 2008 R2. You can download this sample database from CodePlex at http://msftdbprodsamples.codeplex.com. It's worth mentioning that the installation instructions are also available on CodePlex.
If the installation goes smoothly, you should be able to start SQL Server Management Studio, connect to the Database Engine, and see the new Adventure Works databases in your SQL Server 2008 R2 instance.
Unfortunately, the installation package does not automatically deploy the Analysis Services database, so you need to deploy it manually.
Note
Before you can start the instructions below, ensure that the SSAS service account has permission to the SQL Server instance where the AdventureWorksDW2008R2 sample database exists. Additionally, ensure that the SSAS service account has permission to access the databases and is at least a member of the db_datareader role for the AdventureWorksDW2008R2 database.
To deploy this database, you need to perform the following steps:
Start Business Intelligence Development Studio.
Click File

Next, in the Solution Explorer double-click the
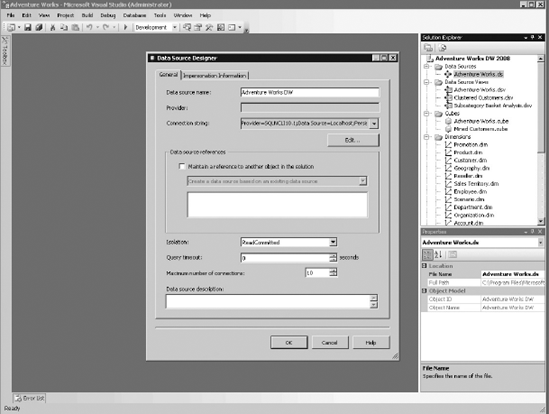
Adventure Works.dsdatasource. This will open the Data Source Designer Dialog box, as shown in Figure 13-2.Click the Edit button, and in the Connection Manager, supply your SQL Server Database Engine connection information. Click the Test Connection button. If the test succeeds, click OK and OK to save the changes.
Right-click the solution in Solution Explorer, choose Properties. On the Adventure Works DW 2008 Property Pages dialog, change the Server property to your SSAS server name and database name.
In the Solution Explorer right-click on the solution, and click Deploy Solution.
At this point, you should be able to start SQL Server Management Studio, if it's not already open, connect to the Analysis Services, and see the new Adventure Works databases.
In SharePoint Server 2010, there are many different ways to manage and display BI assets. One of them is to use a site template called Business Intelligence Center, which is the enhanced version of the Report Center in MOSS 2007. This site template encompasses many of the BI capabilities that Microsoft has introduced in SharePoint Server 2010.
Although using Business Intelligence Center is not the only way to access SharePoint's BI features, this site template can provide a central location for teams and departments within your organization to store, retrieve, and modify shared reports.
To begin creating and using the Business Intelligence Center to its full capacity, you must first enable a few site collection scoped features. To enable these features, perform the following steps:
Click Site Actions menu
In the Site Collection Administration list, click the Site collection features link.
Activate the SharePoint Server Publishing Infrastructure feature. PerformancePoint Services uses this feature to perform dashboard publishing.
Activate the SharePoint Server Enterprise Site Collection Features feature. This feature enables Excel Services, Visio Services, and Access Services, included in the SharePoint Server Enterprise License.
Activate PerformancePoint Services Site Collection Features feature. This feature adds PerformancePoint content types and a Business Intelligence Center site template.
To properly examine the capabilities of the Business Intelligence Center in SharePoint Server 2010, create a new site with this template by clicking Site Actions
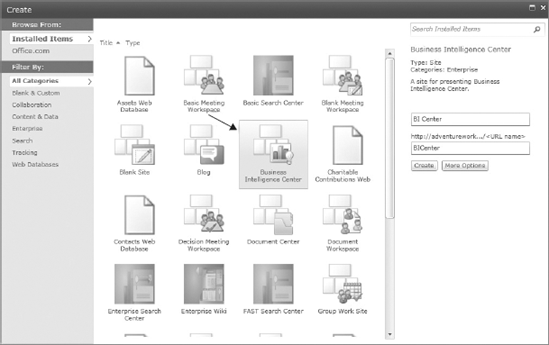
Next, fill out the title and the URL and press the Create button. Your new site should look like Figure 13-4.
Just like any other template, the Business Intelligence Center includes several features that can help you organize dashboards, reports, and the connections to external datasources in one centralized and standardized place.
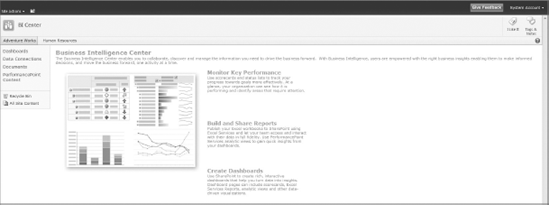
One obvious difference between Business Intelligence Center in this release and Report Center in the previous version of SharePoint is that lots of guidance and samples have been produced and placed into various pages of the site to assist users to start off with their BI implementation inside SharePoint as quickly as possible. And all samples just work!
Most of the BI functionalities available in this template are contained in two document libraries and one list as follows:
Dashboards Document Library: A library that contains exported PerformancePoint dashboards organized in folders
Data Connections Document Library (DCL): A library that contains ODC (Office Data connection) files, UDC (Universal Data Connection) files and PerformancePoint data connections
PerformancePoint Content List: A list that contains PerformancePoint content and OOB views for organizing content.
There are two things about the new site that warrant more attention.
First, the BI Center automatically activates a site (not site collection) scoped feature named PerformancePoint Services Site Features. This feature adds the list and document library templates that are used in the Business Intelligence Center.
Second, PerformancePoint content storage has completely changed compared to the previous version. In SharePoint Server 2010, all PerformancePoint elements are stored, secured and managed in SharePoint lists and document libraries, not on the PerformancePoint server. This one, right here, is a huge game changer!
Note
Like other templates in SharePoint, the BI Center template can be further customized to meet your business requirement needs. The BI Center template already has all the content types, and list and document library definitions for your BI solutions, and is a great starting point.
Excel has always been one of the most widely used data analysis tools, with which users take corporate data and bring it into workbooks and, for the purposes of analysis, combine it with other datasources that users can't track back to learn where they came from, such as XML data coming from a web service or data feed. Microsoft introduced a new server technology in MOSS 2007, named Excel Services, which has become an increasingly popular choice for sharing and collaborating on the data kept inside the Excel workbooks.
The primary driving force behind this technology was to make Excel and Excel Services the analysis tools of choice for users doing BI. This was done by changing Excel from being just a client-side application into an application that works both in the client and on the server. The server-side application model allows users to reuse the logic and content of their Excel workbooks in the browser, while easily protecting the IP behind them. Additionally, maintaining a single server-side version of the workbook gives everyone the right numbers and one version of the truth!
Excel 2010 picks up where Excel 2007 left off. There are two forms of Excel in SharePoint Server 2010: Excel Web App and Excel Services. Excel Web App is an extension of the Excel rich client that allows users to view and edit workbooks in the browser. Excel Services 2010 is the enhanced version of the same service that was offered back in MOSS 2007. Figure 13-5 illustrates what Microsoft has shipped in Excel Services 2010.
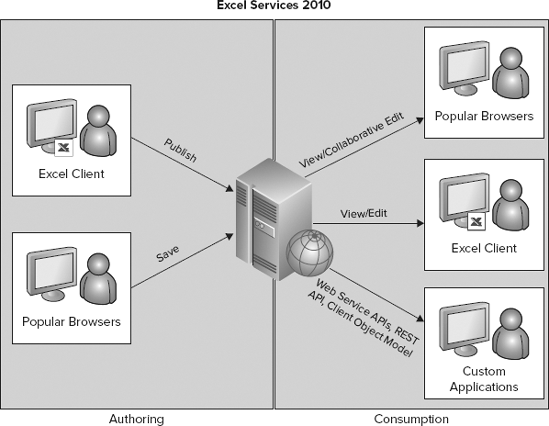
In the new architecture, an information worker uses the Office Excel 2010 rich client to author the Excel workbook and publish it to Excel Services 2010. Alternatively, he or she can save the workbook to a document library in Excel Services right on the server, where it is managed and secured by the site collections administrator. Once the workbook is published, it can be consumed and edited in three different ways:
Directly through the browser.
By downloading the workbook into the Excel rich client for further analysis as either a snapshot or an Excel workbook.
In custom applications through User Defined Functions (UDFs), the Web Services API, the Client object model, or the REST API.
What is important about Figure 13-5 is that the user experience in Excel Services 2010 is a major subset of the full Excel 2010 client on the desktop. For instance, with Excel Services 2010, users can:
Collaborate on the whole or just parts of a workbook while performing distinct operations such as in-cell editing, sorting, filtering, pivoting, and entering parameters
Work with connected or standalone external datasources in the workbook
What if analysis — a use of underlying datasources in real time to model different data scenarios
Build dashboard-style applications by using the web part connection framework between web parts on the same page or across pages
The functionalities that Excel Services 2010 offers are handled in three tiers of a SharePoint Server farm topology: Database Server, Application Server, and Web Frontend, as shown in Figure 13-6.
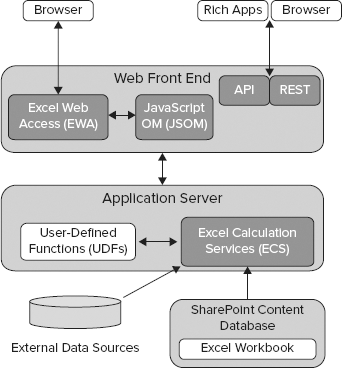
Because the Excel Services architecture is built on the SharePoint farm topology, it can be scaled up or out using configurable load-balancing scenarios and several other options to support large numbers of workbooks and concurrent requests. All these settings can be configured in Central Administration Site
Essentially, Excel Services is nothing without a workbook. An Excel workbook is a self-contained unit of an application that contains data, logic on the top of the data (aka a model), visualization and external assets such as those that connect up to the external datasources. A workbook is typically authored in the Excel client application and deployed to Excel Services, where it is stored and secured inside SharePoint content database.
Next is the Application Server layer, which stands in the middle. A key component of Excel Services installed on the Application Server is Excel Calculation Services (ECS). This service application is responsible for loading the workbook, managing cache for concurrent access, and bringing data from external datasources. If a workbook contains custom logic implemented in UDFs, Excel Calculation Services combines that logic with the logic that was already placed in the workbook when it was authored.
The overall architecture of Excel Services limits interactions with the Application Server layer to being performed only through the Web Frontend layer, where three data access methods are exposed: the Excel Web Access (EWA) web part, the Web Services API, and the REST API.
EWA renders an Excel workbook in the browser with a high degree of fidelity with the Excel client. EWA is not new; it has been around since MOSS 2007, but what is new in Excel Services 2010 is a real JavaScript object model (JSOM) used to automate EWA. JSOM is typically JavaScript code that a developer inserts on a Web Part page that contains the EWA using a Content Editor web part or directly referenced in a custom ASPX page itself. JSOM is used to drive EWA and manipulate the rendered workbook inside. For example, you can use ISOM to capture the click event on a cell.
On the other hand, the Web Services API provides an interface to enable applications to access the workbooks through SOAP calls, while the REST API provides access to all aspects of a workbook, such as the visuals, the model, and the data, through simple URLs. All these middle-tier data access methods will be covered in more detail later in this chapter.
As with any other BI solution, when you start off with an Excel application, the first thing you may want to do is to go after data. In this section, you will create an Office Data Connection (.odc) file and store it in the Data Connections library of the Business Intelligence Center you created earlier in this chapter.
In order to connect to SQL Server Analysis Services and pull in some data, follow these steps:
Begin by opening Office Excel 2010.
From the Data tab in the Ribbon, click From Other Sources button.
For this particular example, select From Analysis Services.
Specify the Analysis Services instance you wish to connect to, and click Next.
Select the database and the cube you wish to connect to. For this example, you want to connect to the AdventureWorksDW2008R2 database and the AdventureWorks cube.
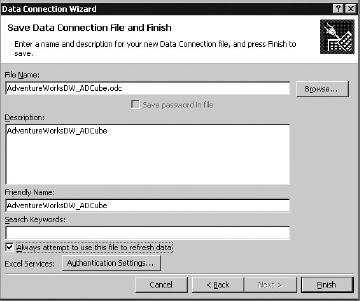
Change the file name and friendly name to
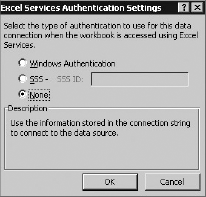
AdventureWorksDW_ADCube.odcandAdventureWorksDW_ADCube, respectively. Also, make sure that you select Always attempt to use this file to refresh data, as shown in Figure 13-7.Click Authentication Settings, and select None as the method of authentication, as shown in Figure 13-8. This selection forces Excel Services to use the unattended service account to authenticate to SSAS. The unattended service account will be covered in detail in the next section.
Click Finish. When Excel 2010 displays the Import Data dialog box, select Only Create Connection, and then click OK.
Browse to
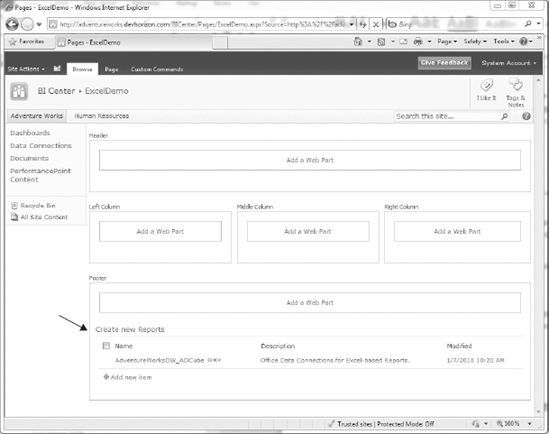
C:Users[Current User]DocumentsMy Data Sources, and upload theAdventureWorksDW_ADCube.odcfile to the Data Connections Library in the Business Intelligence Center site you created earlier in this chapter.Edit the property of the file and change the Content Type to Office Data Connection file.
Next, create a new Web Part page called ExcelDemo and insert the Data Connections library in the Footer Web Part zone, as shown in Figure 13-9.
Creating the .odc files this way is a best practice because of two reasons. First, users don't need to know how to create the .odc files. Instead, they are created by IT and are made available to users. Second, this approach enables the users to access the data that they need quickly by clicking on the Office Data Connection file, which will open the Excel 2010 client, automatically send their credentials to the server, and authenticate them to the Analysis Services server. As a person who manages this connection string, if you ever want to adjust things or change them around, there is only one place you need to go to. Once the new settings are applied, they will be propagated into the workbooks in future connection requests.
As you saw in the previous section, there are three authentication options that Excel Services uses to authenticate to SSAS: Windows Authentication, SSS, and None.
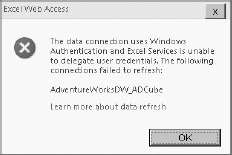
The only case in which you would use Windows authentication is when SSAS accepts Windows authentication, and you want to let the identity of the workbook viewer delegate to the Analysis Services instance. This authentication method is known as Per-User identity and only Kerberos enables it. If you select Windows Authentication without implementing Kerberos, after the workbook is published to SharePoint, users will get the error shown in Figure 13-10 when viewing the workbook in the browser.
There are scenarios in which you want to have a single account act as a proxy for all your users when accessing the backend datasource. This account is referred to as an unattended service account, and it is widely used in the new service application infrastructure in SharePoint 2010.
Note
Note that "unattended service account" and "application pool identity" are not the same type of account. The unattended service account is a service application setting such as in Excel Services, Visio Services, Business Connectivity Services, and PerformancePoint Services. The unattended service account is stored in the service application's database and has nothing to do with IIS.
In MOSS 2007, the single sign-on (SSO) feature somehow implements the concept of the unattended service account, but not in a practical way. Unfortunately, the SSO feature introduced some serious limitations with non-Windows identity providers and anonymous users, so it was replaced with the Secure Store Service (SSS) in SharePoint Server 2010. The SSS works with all types of authentication providers, and it's not limited to Windows identities. It provides access to external datasources under the security context of a predefined set of credentials stored in the Service Application's database.
In Excel Services, each workbook can have its own unattended service account or they all can share a global unattended service account. If the workbook connection's authentication type is set to SSS, you need to reference a target application ID that stores the unattended service account credentials required for authenticating to SQL Server Analysis Services. This account may or may not be used by other BI applications that need to talk to the same backend datasource. Whether to use a single or different unattended service accounts really boils down to your business requirements, but keep one thing in mind: the more accounts you create, the more administrative effort is required to manage them.
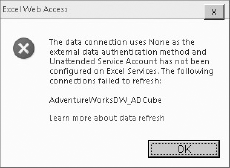
If the workbook connection's authentication type is set to None, the global unattended service account is used. This account, along with many other Excel Services settings, can be configured in the Excel Services service application. Failure to define this account will cause the error in Figure 13-11 to be thrown.
The process of creating the unattended service account is fairly straightforward. Before you start creating this account, you need to ensure that you are either the farm administrator or the service application administrator for the instance of the Secure Store Service.
In order to create this account, perform the following steps:
Browse to the Central Administration Site.
From the Application Management category, click Manage service applications.
From the list of existing service applications, click Secure Store Service application.
From the Ribbon, click the New button.
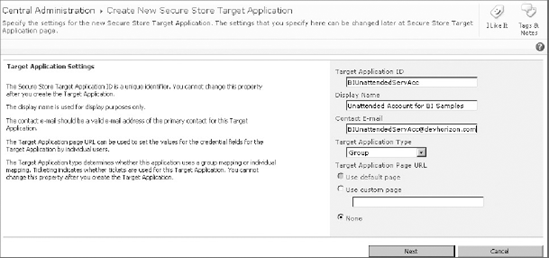
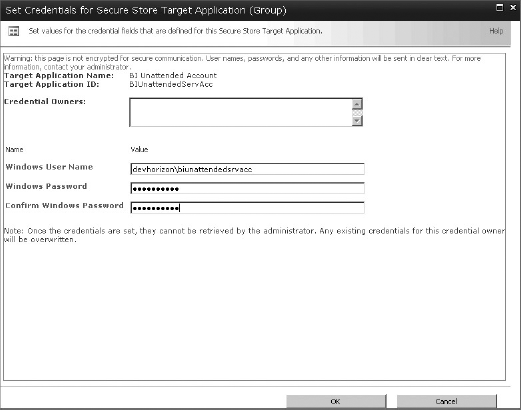
Figure 13-12 shows the settings for the new target application. In the Target Application ID box, type a name to identify this target application. In the Display Name box, type a friendly name that's shown in the user interface. In the Contact Email box, type the email address of the primary contact for this target application. Change the Target Application Type to Group for mapping all the members of one or more groups to a single set of credentials that can be authenticated to the SQL Server Analysis Services instance, and then click Next.
Since the target application type is Group, you can leave the default values in this page untouched and move on to the next step, by clicking Next.
In the Specify the membership settings page, in the Target Application Administrators field, specify all users who have access to manage the target application settings. Again, since the target application type is Group, in the Members field, specify a group or users to map to a set of credentials for this target application.
Click OK.
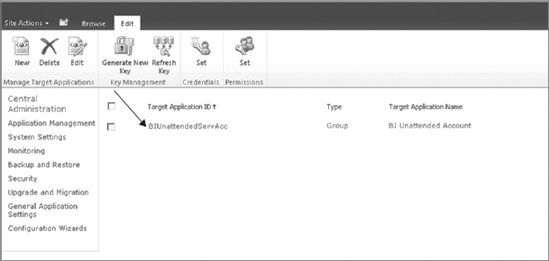
At this point, you should be able to see the new target application along with other target applications in the Manage Target Applications page, as shown in Figure 13-13.
After creating the target application, you should set credentials for it. To set credentials for the target application you've just created, follow these steps:
Select the target application you have just created, and then, in the menu, click Set credentials.
Fill out the fields for setting credentials (see Figure 13-14), and click OK. This is the account that is used to authenticate to SSAS, so you need to ensure that this account can authenticate to SSAS and is at least a member of the db_datareader role for the AdventureWorksDW2008R2 database.
You are almost there! The last step is to introduce the new target application to Excel Services. To do so, follow these steps:
Browse to the Central Administration Site.
From the Application Management category, choose Manage service applications.
From the list of existing service applications, click Excel Services.
From the Managed Excel Services page, click Global Settings.
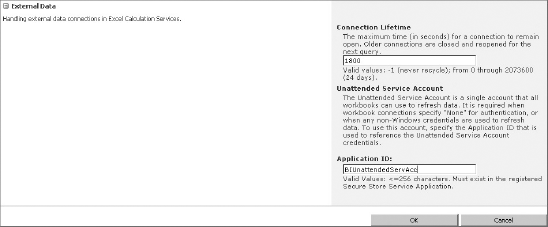
Browse all the way down to External Data section, and specify the new target application id (string text) in the Application ID textbox, as shown in Figure 13-15.
Click OK when you are done.
AdventureWorks is a company that knows Business Intelligence gives them an edge over their competitors because when they make business decisions, those decisions are based on the latest and most up-to-date analysis of relevant business data Therefore, the BI team at AdventureWorks has created an OLAP cube to keep track of the Internet sales and has made it available to the business analysts to use for analysis.
The goal of this section is to perform a quick analysis of the data kept in that cube. The section starts out with a step-by-step procedure to create a simple PivotTable report and moves into some of the newest Excel 2010 features used for easier visualization and better insights into the key data values.
This section assumes that you already completed the following two tasks:
Created a site from the Business Intelligence Center template and named it BI Center (see the "Business Intelligence Center" section).
Properly set up an Office Data Connection to access the AdventureWorksDW2008R2 and the AdventureWorks cube and uploaded the
.odcfile to the Data Connections library (see the "Office Data Connection" section).
Almost every spreadsheet application currently on the market ships with a feature that allows sorting and summarizing large tables of data independent of the original data layout kept in the spreadsheet itself. This feature has different names in products such as Microsoft Excel, OpenOffice.org Calc, Quantrix, and Google Docs, but the concept remains the same in all these products.
In Microsoft Excel, this capability is called a PivotTable. Essentially, a PivotTable is a powerful data summarization and cross-tabulation object that allows you to do free-form layout of your business data. For instance, when you use Microsoft Excel for cube browsing, you can import the cube's data into Excel and represent it as PivotChart or PivotTable report, connected to the same cube.
The following steps will help you create a new Excel workbook containing an OLAP PivotTable report based on data in the Analysis Services cube.
Browse to the ExcelDemo Web Part page in the BI Center, and click the
AdventureWorksDW_ADCube.odcOffice Data Connection file to open Excel.At this point, you should see the PivotTable field list, and an empty PivotTable report is placed in the current worksheet at =$A$1.
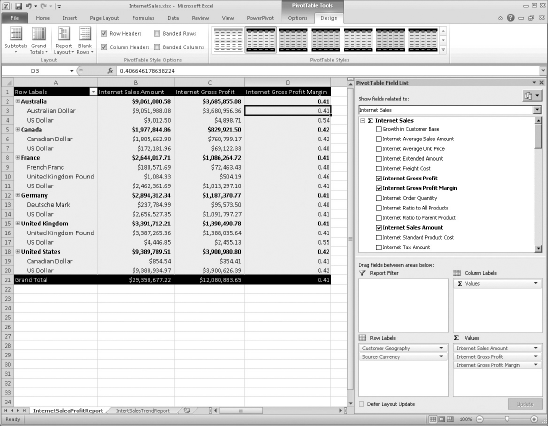
To add some measures to the PivotTable, change Show Fields related to Internet Sales, and select the following three fields as measures:
Internet Gross Profit
Internet Gross Profit Margin
Internet Sales Amount
Now, you need to add two dimensions to the PivotTable. Select Customer Geography and Source Currency Name from the PivotTable Tools tab, select the Design tab, and under PivotTable styles choose an appropriate style. Your workbook should look like Figure 13-16.
With the Internet Sales PivotTable inserted, make the report complete by adding a PivotChart to the worksheet. This chart will give focus to the sales data and make it easy to understand.
To add a PivotChart based on the data in the Internet Sales PivotTable, you need to perform two easy steps as follows:
From the PivotTable Tools Contextual menu, click Options, and then the PivotChart button to insert a PivotChart.
Select Clustered Column chart type, and press OK.
Note
PivotCharts are new in Excel 2010, and they are like normal Excel charts with one major difference. In PivotCharts, you can drill down into the hierarchies to identify the items you want to view, and this affects both the PivotChart and the associated PivotTable. In Excel 2007, you could only link charts to PivotTables and only navigate them through the PivotTable.
In the PivotChart you just inserted, click the Source Currency drop-down list and find US Dollar and Canadian Dollar, then click OK.
Click the Customer Geography drop-down and select Canada and United States. Your PivotTable should look like Figure 13-17.
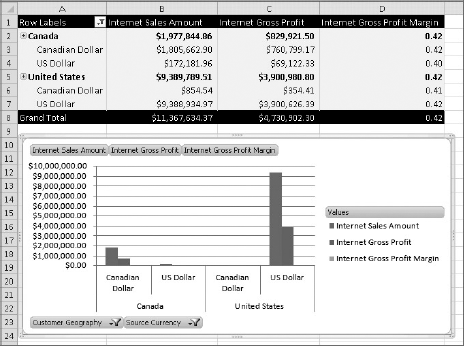
Two things need to be highlighted here. First, notice that when you apply filters to the PivotChart, a search box appears that allows you to look for a specific item in the hierarchy and find it, rather than having to browse all the way down or up in the hierarchy to find it. This is particularly important, because if a field contains lots of items, it's fairly difficult to find what you are looking for. Second, when you change the filters on the PivotTable, this affects the PivotTable and vice versa!
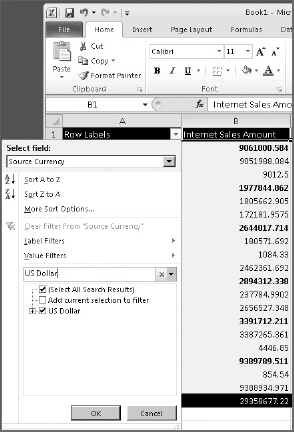
In an Excel PivotTable, you can filter a column or row label by using the Label Filter or Value Filter options. In the Internet Sales PivotTable example, you can select the PivotTable to report on backend data only when Source Currency is equal to US Dollar, as shown in Figure 13-18.
To filter Source Category on US Dollars only, follow these steps:
In the PivotTable, click the arrow on right of the Row Labels heading.
In the Select field drop-down, select Source Currency.
In the search box type US Dollar.
In the list of currencies, make sure that US Dollar is selected, and then click OK.
The PivotTable now shows results for work done on the selected currency, and you can focus your analysis on that data.
In Excel 2007, if you wanted to filter a PivotTable or PivotChart, you had to add it to the Report Filter section. Additionally, if you wanted to select multiple items in a filter, Excel would have shown you the tag "Multiple Items" without telling you which items you had selected. In Excel 2010, Visual Slicers are introduced to address issues of this kind. In nutshell, Slicers allow you to filter the data on PivotTables and PivotCharts with just a single click, which is much easier than before.
There are three characteristics about Slicers that make them a great navigation paradigm in Excel 2010. First, Slicers are rendered as buttons, making the filtering operations relatively easy. Second, you can select more than one item by holding the shift key and clicking on each item or by dragging mouse over a range. Third, the filters that produce no result from the backend datasource are grayed out, which is yet another good indicator when interacting with PivotTables and PivotCharts.
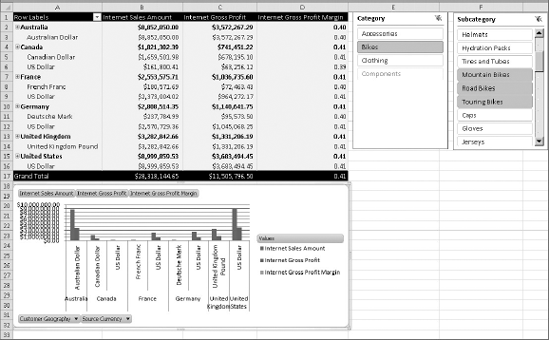
The following steps will help you add Category and Subcategory Slicers to the Internet Sales PivotTable.
In the PivotTable Tools, select Options tab.
In the Sort & Filter category, click Insert Slicer
Select Internet Sales from the drop-down, and then select Product
Resize and position the stacked version of both Slicers on the right side of the PivotTable. Also, using the Options menu, increase the columns in the Subcategory Slicer to 4.
Now, click on Bikes on the Category Slicer and notice how the related fields and the actual data are affected in the Subcategory Slicer PivotChart, and the PivotTable itself, as shown in Figure 13-19.
Another addition to Excel 2010 is the ability to add Sparklines to a set of data being reported on. A Sparkline is a powerful graphic that brings meaning and context to what it describes. Simply put, think of a Sparkline as a mini-chart without any fluff, such as tick marks, labels, axis lines, or a legend.
Excel 2010 ships with three distinct types of Sparklines:
Line
Columns
Win/Loss
If you have worked with and loved the conditional formatting data bars introduced in Excel 2007, then you will find Sparklines even easier to use.
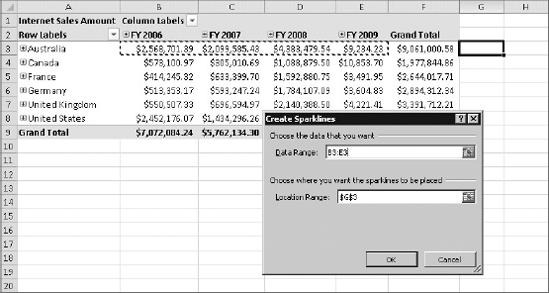
The following steps will help you add Sparklines to the Internet Sales report to highlight trends in the Internet sales report and identify Line values with special formatting.
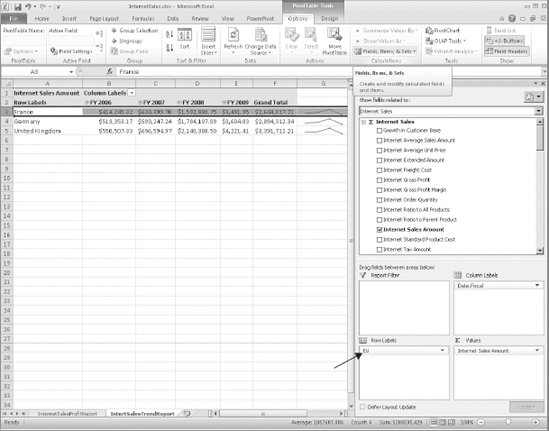
Create a new sheet and name it InternetSalesTrendReport.
From the Insert tab, click PivotTable and add a new PivotTable to the existing sheet at =$A$1.
In the Create PivotTable dialog box, select Use an external data source and select AdventureWorksDW_ADCube from the Connections in this workbook section.
In the PivotTable Field List task pane, choose Internet Sales in the Show fields related to drop-down, and add a measure of Internet Sales Amount.
Now, select the
CustomerGeographyandDate.Fiscalas the attributes on which the Internet Sales Amount measure should be analyzed.Place the cursor at cell =$G$3.
From the Insert tab, under the Sparklines group, click on Line Sparkline.
With the Create Sparkline dialog box open, select the cells from B3:E3, as shown in Figure 13-20.
From the Design tab, update the formatting of the inserted Sparkline to highlight the min and max points.
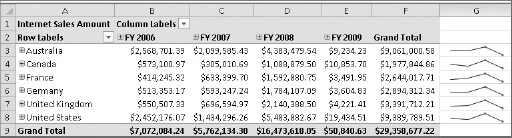
The Sparkline object is like any other object placed in a cell, such as a formula, so it can be selected and dragged from cell G3 to G8 to insert the same line chart bound to other rows of the PivotTable, as shown in Figure 13-21.
In Excel 2007, if you wanted to perform certain types of calculations against a PivotTable for rows and columns, you would have to do this either outside of the PivotTable in your own function or turn them into a cube formula.
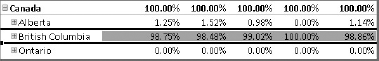
In Excel 2010, Microsoft has introduced a new feature named Show Value, which allows you change the way you view values, by selecting from a list of predefined calculations, as shown in Figure 13-22.
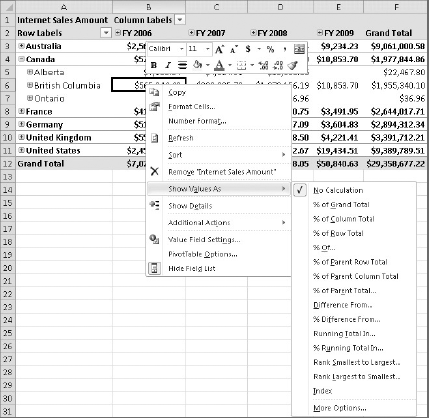
The following steps will help you calculate and display regional Internet sales as a percentage of the country sales.
Expand Canada node to show all the available regions.
Right-click on the value in any of the fiscal years, and from the context menu select % of Parent Total.
From the Base Field drop-down, select Country.
Click OK.
By looking at the PivotTable, you can quickly find out that in Canada for all year ends from 2002 to 2005, British Columbia has had the biggest percentage of sales among all provinces, as shown in Figure 13-23.
When working with OLAP PivotTables, there are scenarios where you want to work with the same logical group of items from the underlying data across multiple reports. For instance, most of the report layouts needed by Adventure Works need to show information about European countries. The problem is that this grouping doesn't exist in the cube, so you always end up applying the same filter to get reports for such countries over and over again.
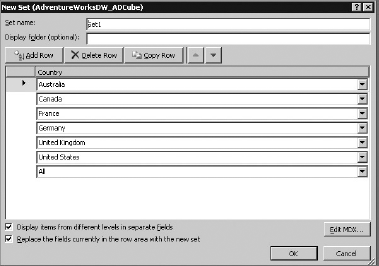
A new feature in Excel 2010 that helps resolve issues of this kind is the ability to define Named Sets. This new feature allows you put common sets of items together and reuse them. This grouping can be done based on row items, column items, or your own MDX queries.
The following steps will help you add a Named Set to the Internet Sales PivotTable.
From the PivotTable Tools, click Options in the Ribbon.
Select Fields, Items, & Sets, and then select Create Set Based on Row Items.
Now, the Named Set creation UI will pop up, as shown in Figure 13-24. Note that Subtotals and Grand totals contain an All member. The UI contains all the tuple that currently define the row labels of the PivotTable.
Delete the countries that are not European.
Change the new Set name to something easier to remember in the future, such as "EU."
Click OK. Notice that the grouping has been created (without applying any filter), and the new Named Set is placed on the corresponding axis (Row Label), as shown in Figure 13-25.
At this point, you have a reusable Named Set containing three European countries. The new Named Set is attached to the workbook and moves with it, so if anyone opens the workbook, they can reuse this set in their own PivotTable and focus on the rest of their analysis. Of course, the example used in this section was relatively simple, but the idea of reusability is pretty much the same, no matter how complex your Named Set becomes.
Although Named Sets may sound just like simple groupings of items, in reality they offer way more than that. You can do things with Named Sets that otherwise wouldn't be possible at all, such as combining items from multiple hierarchies.
In previous versions of Excel, you could create Named Sets with some limited functionalities, but there was no graphical user interface, and this could be only done through the Excel object model and by writing your own MDX queries. The Named Sets defined programmatically that way consisted only of items from a single hierarchy, and they could never be dynamic in nature.
In Excel 2010, you can make Named Sets based on your own custom MDX and use them in PivotTables to dynamically change their dimensionality. These types of Named Sets are called
Dynamic Sets. Dynamic Sets were first introduced in Analysis Services 2008, but unfortunately Excel 2007 couldn't fully benefit from them. For example, the Top 50 Selling Countries is one of the great examples in which Dynamic Sets can help a lot. Another example is when you want to see European countries when you're filtering on Source Currency by Euro and show North American countries when you're filtering by American dollar.
Like Dynamic Sets, Analysis Services has had writeback capability for a while, but it was not implemented in Excel out-of-the-box. In previous version of Excel, if you ever clicked on a cell in a PivotTable to edit its content, you would get an error message saying that PivotTables cannot be edited.
In Excel 2010, the ability to write back against a cube and change the underlying data is referred to as what-if analysis. This particular feature becomes extremely helpful when you use Excel and your existing data to plan something in future. In a nutshell, what-if analysis is all about clarifying what-if type questions you might have in your mind when looking at a PivotTable.
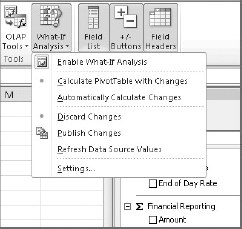
In order to use what-if analysis, you need to enable it from the PivotTable Tools
Once the what-if analysis is enabled, you can edit any values and enter the value of your choice. At the end, you can atomically calculate the selected change or have the cube calculate it for you and commit the information back to the cube, as shown in Figure 13-26.
Now that you have a workbook created in Excel 2010, it's time to make this workbook available in SharePoint and examine the capabilities of Excel Services 2010. This process is known as publishing a workbook to Excel Services.
There are many configuration settings that can be applied to both the Excel Services application and the site that hosts your published workbook. Although diving into all these configuration settings is definitely out of the scope of this chapter, the rest of this section discusses some of these settings that can get you up and running.
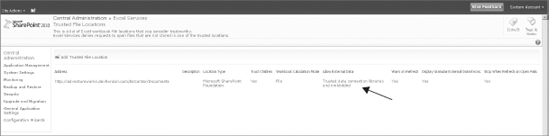
A major consideration in deploying to Excel Services, and quite frankly the one you will want to plan carefully, is the file locations and connection document libraries that are considered trustworthy. The following steps walk you through defining these locations:
Browse to the Central Administration Site.
From the Application Management category, choose Manage service applications.
From the list of existing service applications, click Excel Services.
From the Manage Excel Services page, select Trusted File Locations.
If the location that you plan to publish your workbook is not in the list of trusted locations, click Add Trusted File Location and define that location.
Make sure you enable the workbook to make external connections by setting the Allow Data setting External to Trusted data connection libraries only or Trusted data connection libraries and embedded.
Click OK to go back to the Excel Services Trusted File Location page. At this point, the list of trusted file locations should look like Figure 13-27.
Browse back to the Manage Excel Services page, and this time around, select Trusted Data Connection Libraries.
From the Excel Services Trusted Data Connection Libraries page, specify the data connection library from which Excel workbooks opened in Excel Services are allowed to access the Office Data Connection files.
Note
Note that because service applications can be associated with multiple web applications, you should define multiple trusted locations for each web application that hosts your Excel workbooks. The same thing is true if you have assigned multiple Excel Services Service applications to one web application. You need to define the trusted locations for each service application.
With the trusted locations properly configured, the next step is to publish the Internet Sales workbook to SharePoint and view it using Excel Services.
The following steps will help you publish the workbook:
From Excel 2010 Ribbon, click File to open the Backstage.
Switch to the Share tab.
From the Share billboard, click the Publish to Excel Services option, and then click Publish to Excel Services.
Click the Excel Services Options button that appears below Open in Excel Services option.
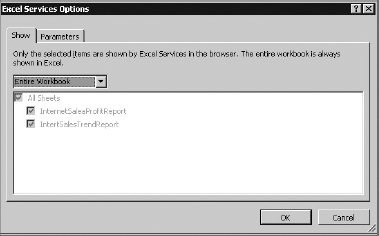
The Internet Sales workbook contains two worksheets, so you can decide if you want to publish the entire workbook or just portions of the workbook based on named cells, or parameters, defined within workbook. In this particular example, you will choose Entire Workbook, as shown in Figure 13-28.
Enter the path of the BI Center site you created earlier in this chapter, and click Save.
In Internet Explorer, navigate to the URL you specified in Step 6.
Click the link to
InternetSales.xlsxto view it in the browser, as shown in Figure 13-29.
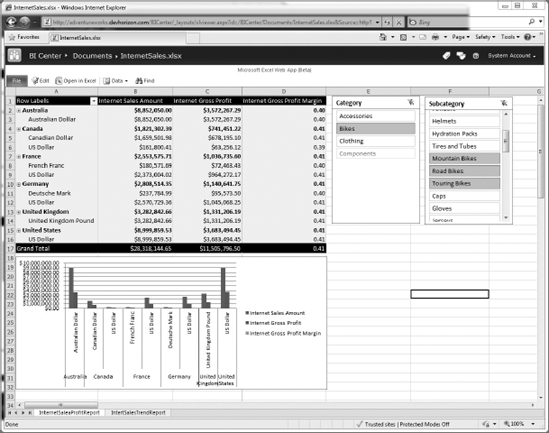
Once a workbook is published to SharePoint, Excel Services performs loading and calculations included within the workbook on the server, which means that whatever logic is behind the workbook is no longer directly accessible to the end users.
Next, the Excel Web App tries to open the workbook in view mode. Unlike the previous version, in Excel Services 2010 if the workbook contains unsupported features, it is still rendered, but some of the functionalities may not work properly.
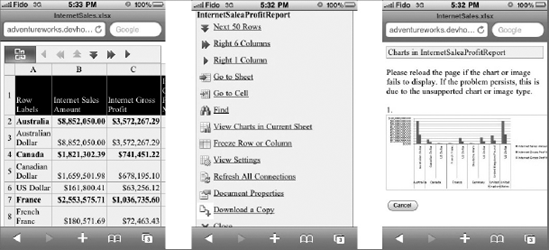
As a final remark, the Excel Web App works in IE, Firefox, and Safari. Figure 13-30 shows InternetSales.xlsx opened in Safari browser in iPhone 3G.
One of the drawbacks of publishing an Excel workbook to Excel Services 2007 is that the published Excel workbook is not editable. This means that users cannot mock around with the data contained in the workbook and then save the changes back to the Excel workbook. Although, the Open In Excel and Open Snapshot In Excel options allow users to take the workbook offline and take further actions, most users prefer to be able to do online editing.
In Excel Services 2010, you can edit a workbook using Excel Web App. Edit mode offers only a subset of the Excel 2010 functionalities, but there is a fairly impressive set of operations that you can perform when editing the workbook online.
Edit mode also supports joint sessions, where more than one user can edit the document at the same time. This is done through a separate session for each user in Excel Web App. The Excel Web App keeps alerting everyone about the changes that have been made to the workbook by others.
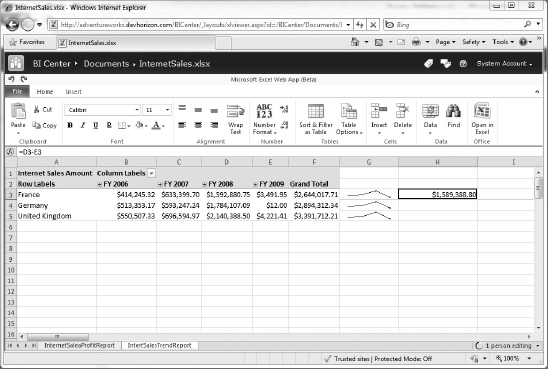
Figure 13-31 shows an editable version of the Internet Sales workbook and a simple calculation at =$G$3.
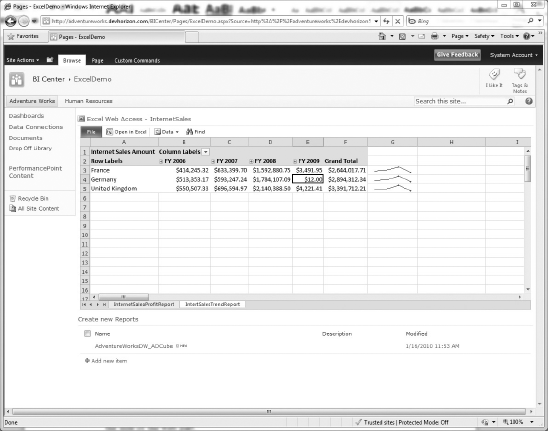
Another way to render and manipulate a published Excel workbook is through the Excel Web Access web part, also known as EWA. Figure 13-32 shows the entire Excel workbook displayed in a single EWA.
Unlike its predecessor, EWA has no dependency on client-side scripts or any ActiveX control to function properly. You can navigate through the sheets within the published workbook just as you would when using the Excel client. In addition to the entire workbook, a section of the workbook can be hosted and rendered in a EWA web part. This is done based on named parameters within the workbook, which should be created when authoring it.
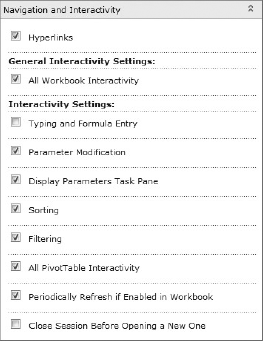
In Excel Services 2007, if you wanted to allow interaction with the workbook through the EWA, you had to list parameters on the left side in the Parameter pane. In the EWA web part's properties, you can control how much users can interact with the hosted workbook and for what features, as shown in Figure 13-33.
One thing needs to be highlighted here. Interactivity in EWA web parts is not the same as editing in Excel Web App. In the Excel Web App, the changes users make to the workbook are written back to the original workbook. When interacting with EWA, users can see changes in calculations and visualization objects, but the original workbook remains intact.
You can expose your Excel model in the Web Access web part and turn on the interactivity feature so that users can interact with the workbook without a need for listing parameters on the left side in the Parameter pane. Also, you have the option to specify whether changes made to the workbook need to be committed back or, in the case of a model, not committed back to the workbook.
Last, but certainly not least, EWA supports the Web Part Connection framework and can send data to or receive data from other web parts to create really powerful dashboards and mash-up scenarios.
Especially in today's tough economic times, dashboard-style applications that can present historical and real-time data to the decision makers in the form of metrics, reports, and data visualizations are becoming more and more popular. PerformancePoint Services is Microsoft's dashboard delivery tool, which now is part of the SharePoint Server 2010 Enterprise platform. But, why do you need PerformancePoint? Can't you build dashboards using SharePoint?
Yes, you certainly can! There are a lot of components in the SharePoint ecosystem that you can use to build out dashboard-style applications. SharePoint, right out of the box, offers some lightweight tools for hosting and displaying data, such as Web Part pages, status lists, and the Chart web part. You can combine these types of content with Visio diagrams, InfoPath forms, Reporting Services reports, or Excel workbooks to build dashboards. However, such dashboards may not present a level of sophistication people would like to see on their computer's screen every morning they come to work!
The good news is that PerformancePoint Services works with all these types of technologies to help you aggregate content and data to assemble richer and more interactive dashboards that suit any business requirements. The following sections discuss the out-of-the-box features in PerformancePoint Services and the techniques that you can use to create a PerformancePoint dashboard.
When it comes to business decision-making processes, sometimes there are terms with blurry lines between them, which makes things a bit difficult to understand. One example is the title of this section, dashboard versus scorecard, which is a very common point of confusion! We can look into clarifying this confusion from different angles.
Conceptually, a dashboard is a collection of real-time information that is used for evaluating performance and making sure that operational goals are met. However, a scorecard stays at a higher level than a dashboard and is more focused on monitoring the performance associated with organizational strategic objectives. So, the key difference here is short-term goals versus long-term success. In reality, making a distinction between a scorecard and a dashboard is absolutely unnecessary, as both are used to accomplish one thing: making sure that the business is on the right track to reach established goals in the future.
In the context of PerformancePoint Services, things are much simpler and less formal. A PerformancePoint dashboard is simply an .ASPX page that renders a bunch of heads-up displays, including a scorecard. Let's think about it this way for now!
The functionalities that PerformancePoint Services offer are handled in three tiers of a SharePoint Server farm topology: Database Server, Application Server, and Web Frontend, as shown in Figure 13-34.
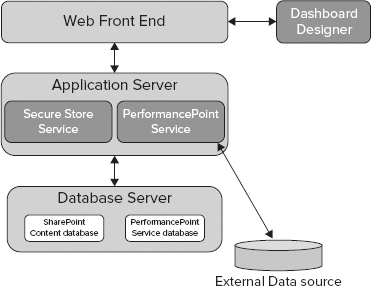
The Web Frontend server hosts the Dashboard Designer application, PerformancePoint web parts, PerformancePoint web services, and the service application proxy that is required to communicate with the PerformancePoint Services application installed on the application server. Like all other service application proxies, the PerformancePoint proxy talks to the PerformancePoint Services application using claims, so the environments with no Kerberos implementation are not affected by the double-hop security issue.
In the middle tier, there are two service applications that make the integration happen:
Secure Store Service: This service application stores the password for the PerformancePoint Services unattended account. The unattended service account will be covered in the next section.
PerformancePoint Services: This service application stores the settings needed for the instance. If you have ever worked with PerformancePoint 2007 and MOSS 2007 before, you probably recall that you had to go through many configuration settings to get the PerformancePoint dashboards to work. Thankfully, configuring PerformancePoint Services 2010 is much simpler than before, and it requires no changes in the SharePoint web application's web.config file anymore.
In the database layer, most of the configurations required for PerformancePoint service applications are stored in the PerformancePoint service database.
Note
At the time of writing this book, PerformancePoint still doesn't support web applications with claims-based authentication, and that's because of how the click-once Dashboard Designer is structured. This limitation may be changed with the release of SharePoint Server 2010 SP1.
One of the challenging configuration steps in the previous version was to properly set up the authentication to the backend datasource. The problem was that the authentication option couldn't be defined per datasource; instead, PerformancePoint would use the application pool identity of the SharePoint Web application. From the security practice perspective, this was not recommended because users potentially could use PerformancePoint to access to the data that they shouldn't have access to at all, such as SharePoint content databases.
PerformancePoint Services 2010 implements per datasource authentication and has some new features that control how authentication to the datasource itself is configured. One of these new features is the unattended service account for PerformancePoint.
The unattended service account concept in PerformancePoint services 2010 is very similar to Excel Services' unattended account with two differences. As explained earlier in this chapter, in Excel Services you create the target application in the Secure Store Service application and then reference its Application ID in the Excel Services service application's settings. Thus, both the username and password are stored in the Secure Store Services application.
In PerformancePoint Services, however, you create the unattended account directly in the PerformancePoint Services application settings. In this case, the password is stored in Secure Store Service and the actual username is stored in the PerformancePoint Services database. If you look at a PerformancePoint target application, you will find that it only contains the password field and not the username field.
An unattended account can be created using the following steps:
Browse to the Central Administration Site.
From the Application Management category, choose Manage service applications.
From the list of existing service applications, click PerformancePoint Service Application.
Click the PerformancePoint Service Application Settings link.
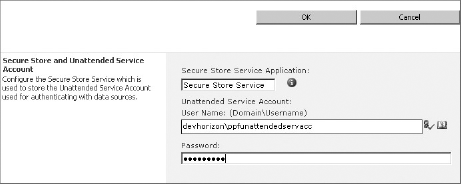
Specify the unattended service account for PerformancePoint (see Figure 13-35), and click OK.
Browse to the Secure Store Service application's settings page and verify that the unattended account has been created.
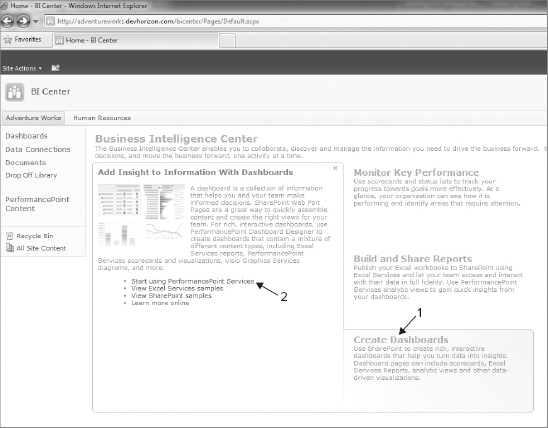
In Internet Explorer, navigate to the Business Intelligence Center site you created at the beginning of this chapter.
Click the Create Dashboards link, and then click Start using PerformancePoint Service link, as shown in Figure 13-36.
From the PerformancePoint Services page, click the big button that says Run Dashboard Designer. This will download and install the PerformancePoint Dashboard Designer to your workstation.
Once the executable file is downloaded and installed on your computer, the PerformancePoint Dashboard Designer appears. In the Data Connections folder, the Excel data connection file that you created earlier in this chapter is a good indication that the dashboard designer is live and connected to the BI Center site.
One thing that you may notice is that the Dashboard Designer is installed on the client machine using a web-based deployment technology called ClickOnce. A major advantage of this deployment model is that it frees the IT department from managing and distributing the application. All that's required is for the Dashboard Designer team to provide proper access permission to the BI Center site.
Once the Dashboard Designer is installed, you have an empty workspace. A workspace is a primary container for all of the elements that you can use to build your dashboard, and it keeps its content synched with the site from which it was launched.
Essentially, the workspace becomes an XML file (.ddwx) that encapsulates all the metadata required to describe a PerformancePoint dashboard. In the workspace, you can build new elements or you can import existing elements from a published dashboard such as scorecards, KPIs, reports, filters, indicators, and dashboards.
Now that you have created a PerformancePoint workspace, you are ready to create your first dashboard, which displays historical and real-time information as an asymmetrical report and compares it to an established goal. And, with that, it's time to build the actual dashboard from the ground up.
As with any other BI solution, the first thing that you will want to do is to go after data. In order to create the datasource used for this dashboard, follow these steps:
Right-click the Data Connections folder in the Workspace Browser, and then select New
From the Select a Data Source Template menu, choose the Analysis Services template to create a datasource that connects to Microsoft SQL Server Analysis Services, and click OK.
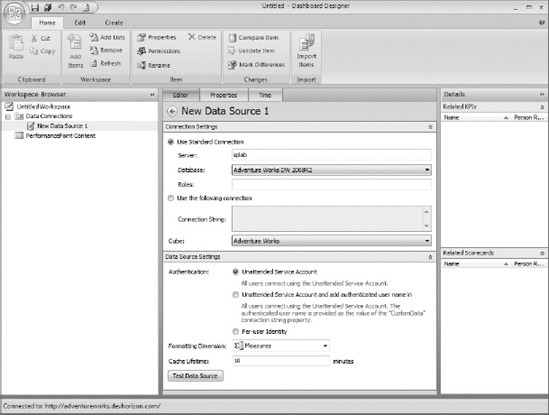
In the Connection Settings, specify the Analysis Services instance you wish to connect to. In the next field, select the database and the cube you wish to connect to. For this example, you want to connect to the Adventure Works DW 2008R2 database and the Adventure Works cube, as shown in Figure 13-37.
Click Test Data Source to make sure that your connection settings are correct.
Switch to the Properties tab and change the Name to AdventureWorksDW_ADCube_PerfPoint.
Save the new datasource by right-clicking it in the Workspace Browser, and then selecting Save.
At this point, you have successfully created the dashboard's main datasource and it's been uploaded already to the Data Connections document library by the Dashboard Designer.
As you saw in Figure 13-36, there are three different authentication types available for the datasource you are building.
The unattended service account option has been discussed already, and by now you should know what it does, but the other two options deserve more attention:
Unattended Service Account and add authenticated user name in connection string: If you select this option, supply the SharePoint authenticated provider and username (Forms, SAML, windows, etc.) as a string in the CustomData field in Analysis Services. You can then create a role (or set of roles) and write MDX queries using the CustomData string to dynamically restrict access to the cube data. The main challenge of this solution is that you need to modify the cube data to include the users of the system and their relationships to the data; this can be somewhat difficult to maintain.
Per-user Identity: There are cases that may not require you to create the unattended service account at all. Picture this: Your backend datasource supports Windows authentication, and user identities must be delegated all the way down to the backend datasource when they access the PerformancePoint dashboards. In PerformancePoint, this authentication type is known as per-user identity, and only Kerberos enables it.
Note
No matter what authentication type you choose for PerformancePoint Services, always make sure that it has proper access to the backend datasource that will be required. For more information, see my blog post at www.devhorizon.com/go/16.
Recall from the previous section that your goal for building the Internet Sales dashboard is to compare Internet sales information with an established goal, and then measure and monitor the success of the online business per country.
But what is success anyway? How is it implemented in a dashboard? Success (or the goal) in a certain area of the business is defined by someone in your organization who knows the business inside and out. In PerformancePoint, a primary metric used to implement and measure this success is something referred to as a key performance indicator (KPI). Once a KPI is defined and implemented, it can be used to monitor the organization's progress in a specific area, such as gross profit margin per product category earned from Internet sales.
In order to create a new KPI to track gross profit margin for Internet sales, you need to follow these steps:
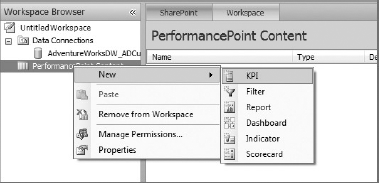
Right-click the PerformancePoint Content folder and select New
In the Select a KPI Template dialog, select Blank KPI, and then click OK.
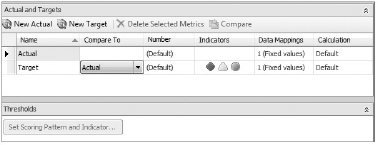
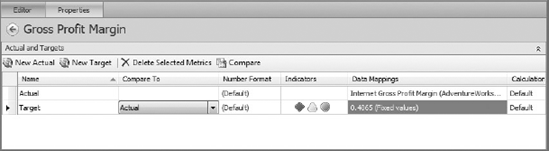
Figure 13-39 shows the new KPI. Here, you can define your actual and Target values. You can also continue adding new actuals or targets to the current KPI. For example, if your organization has defined a minimum goal and stretched goal, you may want to bring them into the KPI by defining two Target values.
The current value for Actual is set to 1, which doesn't represent anything. Click the 1 (Fixed values) link in the Data Mappings column for Actual, and then in the Fixed Values Data Source Mapping dialog, click the Change Source button.
Note
In Analysis Services, you can build KPIs that have four values: Actual, Target, Status, and Trend. In PerformancePoint KPIs, you only have two values: Actual and Target. One interesting aspect about Actual and Target values in PerformancePoint is that they do not need to come from the same datasource. For example, you can define a KPI that gets the Actual Value from the cube and then have the Target value loaded from a SharePoint list. This makes PerformancePoint KPIs very flexible.
Select the AdventureWorksDW_ADCube_PerfPoint data connection, and click OK.
From the Select a measure drop-down, select Internet Gross Profit Margin.
Click OK to close the dialog.
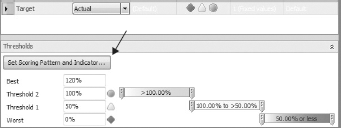
Select the Target row, and click the Set Scoring Pattern and Indicator button in the Thresholds area, as shown in Figure 13-40.
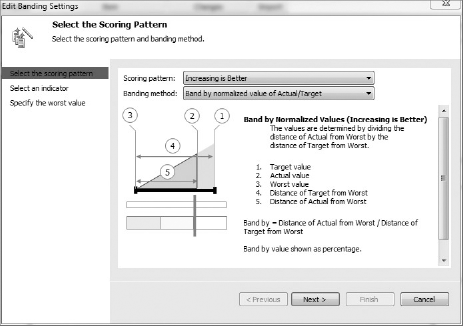
In the first step of the Edit Binding Settings dialog (see Figure 13-41), you need to identify how the Actual value compares to a target. From the Scoring pattern, select the Increasing is Better option. Most of the time, you would use a normalized value where you take the Actual value and divide it by the Target value, so select the first option (Band by normalized value of Actual/Target) from the Banding method drop-down, and then click Next.
In the Select an Indicator step, select an indicator to use for the target that clearly shows whether the goal is met. You can choose from a collection of indicator templates available in PerformancePoint Dashboard Designer. Once you are done, click Next.
In the last step of the wizard, leave the worst value intact and click Finish. Now, you can see how Target values from 0% to beyond 100% are categorized by different colors. You can type in the ultimate values for each threshold or you can use the slider of each color to adjust the size of the percentage ranges.
You need to change the fixed value of the Target, which represents 100% gross profit margin. While 100% is an ideal percentage, you may want to adjust this value to something that's more realistic and makes more sense in your business, for example 40.65 % of the actual value. Click the 1 (Fixed Values) link and change the value from 1 to 0.4065.
Note
The Adventure Works 2008 R2 cube does not have measures that can be used for the Target values of the sample KPI in this section. You need to use Fixed Values instead. Typically, Fixed Values are great when the measure doesn't change very often.
Click OK.
Change the name of the KPI to Gross Profit Margin, by right-clicking it in the Workspace Browser and clicking Rename.
Save the KPI by right-clicking it in the Workspace Browser, and then selecting Save.
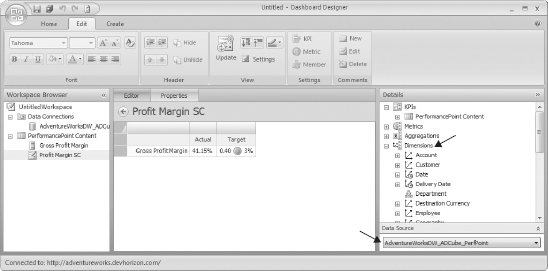
At this point, your new KPI should look like Figure 13-42. Notice on the Details pane that you have all available information about the KPI, such as related datasources.
With the dashboard's datasource and KPI complete, you have all the elements that you need to build the scorecard. This scorecard will contain the Gross Profit Margin KPI, and shows all sales across all years and is broken down by product category.
Right-click the PerformancePoint Content folder, and then click New
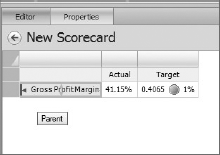
From the Select a Scorecard Template dialog, select Standard Category. From the Template pane, select Blank Scorecard, and click Next.
Drag Gross Profit Margin KPI (Details KPIs
Click the Update button in the Edit tab.
From the Data Source drop-down, select AdventureWorksDW_ADCube_PerfPoint to make all the dimensions in the cube available for the scorecard, as shown in Figure 13-43.
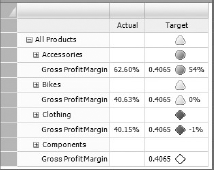
From the list of available dimensions, find and expand Product dimension.
Expand Product dimension and select Categories member.
Drag Categories to the left-hand side of the Gross Profit Margin cell, as shown in Figure 13-44.
From Select Members dialog, select All Products.
Click the Update button in the Edit tab. Notice how the KPI is nested in each category, as shown in Figure 13-45.
Save the scorecard by right-clicking it in the Workspace Browser and then selecting Save.
In this section, you create a report that connects to the scorecard you created in the previous section and display Internet sales for all years grouped by product category.
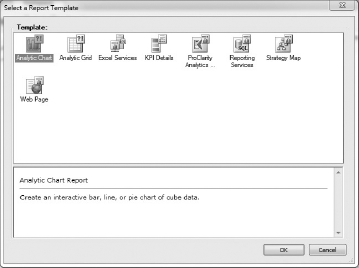
Right-click the PerformancePoint Content folder, and then click New
From the Select a Report Template dialog, select Analytic Chart (see Figure 13-46), and then click OK.
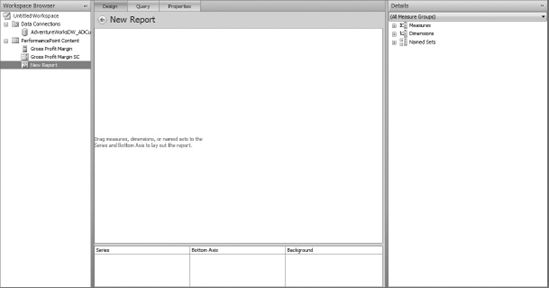
From the Select a data connection dialog, select the datasource in the current workspace, and click Finish. Figure 13-47 shows what the workspace should look like when you build any type of report.
Switch to the Properties tab, and then change the name of the new report to Category Internet Sales by Year.
Switch back to the Design tab.
Expand the Measures node in the Details task pane on the right.
Drag the Internet Sales Amount item into the Bottom Axis box.
Expand the Dimensions and Product nodes, and drag Categories into the Background. Even if you will not show the actual categories in the chart, you still need to reference Categories in the Background, so that when you build the dashboard, the filter that connects categories from the scorecard to the chart knows where to filter. You will learn about the dashboard in the next section.
Expand Date Measure and Find Calendar.
Drag the Calendar Year into the Series section.
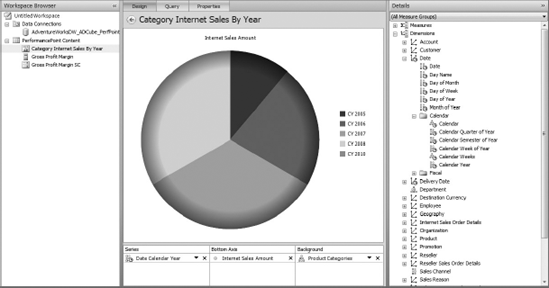
Change the name of the report to Complete Category Internet Sales By Year, by right-clicking it in the Workspace Browser and clicking Rename.
Right-click underneath the chart's legend, and from the context menu select Report Type
Save the report by right-clicking it in the Workspace Browser, and then selecting Save.
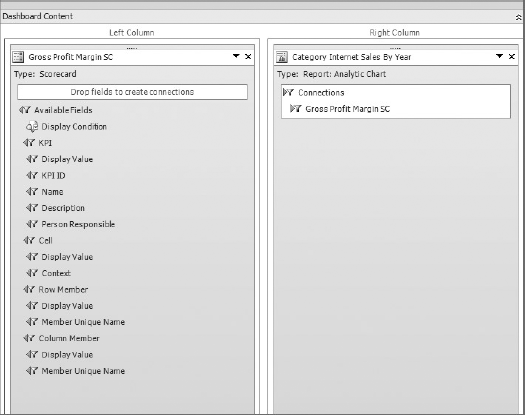
Now that you have gone through all the steps of building different pieces of the dashboard, it's time to put all the pieces together. In this section, you will create a dashboard that displays the scorecard and the report and connect them. This connection will allow filtering of the report (the pie chart) using the currently selected category from the scorecard.
Right-click the PerformancePoint Content folder in the Workspace Browser, and then click New
From the Select a Dashboard Page template, select the 2 Columns page template and click OK.
From the Details pane, drag the Gross Profit Margin SC scorecard and drop it into the Left Column.
From the Details Pane, Drag the Category Internet Sales By Year report into the Right Column.
Drag the Row Member item from the scorecard column into the report column.
In the Connection dialog, change the Source value drop-down to Member Row: Member Unique Name. As mentioned in the previous section, the filter that connects the scorecard to the report will base this connection on the product category that exists in both elements.
Save the dashboard by right-clicking it in the Workspace Browser and then selecting Save. Figure 13-49 shows the finished dashboard.
With the dashboard layout completed, the next step is to make it available in SharePoint for online viewing. Remember, the dashboard contents are already stored in the BI Center site, so publishing here really means creating an instance of the dashboard definition and dumping it as an .ASPX page (aka an exported dashboard) in a dashboard's document library.
Note
The distinction between a dashboard definition and the actual dashboard page still exists, as was the case in PerformancePoint 2007. If you take an exported dashboard (an .ASPX file) and customize it using an HTML editor and replace the existing one with the customized version of the dashboard, next time the same dashboard is published to SharePoint, your changes will be overwritten. That's because you modified the instance, not the definition.
You can publish your dashboard to any document as long as the following two conditions are met:
The page is in a document library with PerformancePoint content types.
The page has access to the dashboard elements in the BI Center.
Publishing the dashboard to SharePoint is relatively straightforward:
Right-click the dashboard in the Workspace Browser, and then select the Deploy to SharePoint menu item.
Select the Dashboards folder, and click OK.
From the Deploy To dialog, select the site and Dashboard document library and click OK. Optionally, you can select any of the available Master Pages in the current site collection for your dashboard. For example, if you want to see your dashboards with no chrome, you can develop a custom Master Page and select it to use when publishing your dashboard.
Once the deployment is completed, you will be redirected to a page (see Figure 13-50) where your dashboard is rendered with 100% fidelity to what you experienced in the authoring environment.
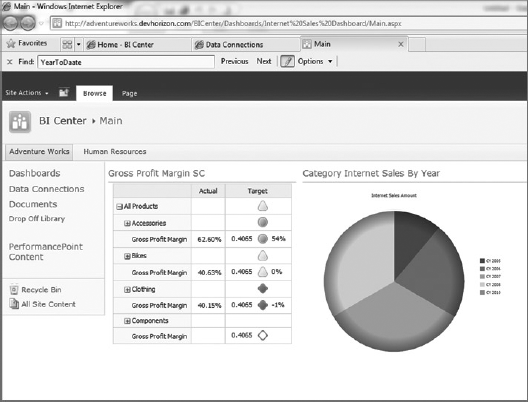
The dashboard that you just published is nothing more than a Web Part page, two web parts, and a web part connection, which were all set up automatically as part of the dashboard-publishing process.
These connections are not exclusive to PerformancePoint web parts. Using the web part connection, you can take your dashboard design to the next level by adding more web parts to the page representing more complex analytical scenarios. You can examine the content of the dashboard by switching the page to edit mode, as shown in Figure 13-51.
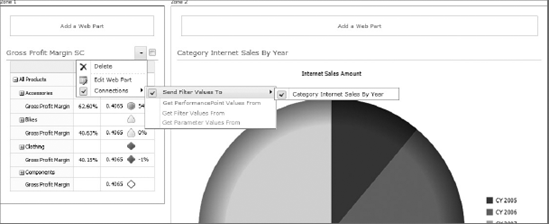
There are many more functionalities available on the chart itself. Let's suppose that, for the purpose of trend analysis, you need to change the type of the chart. To do so, right-click underneath the chart's legend, and from the context menu select Report Type
If you right-click on the analytic chart itself, you'll see that there are plenty of helpful built-in functionalities at your fingertips, as shown in Figure 13-53.
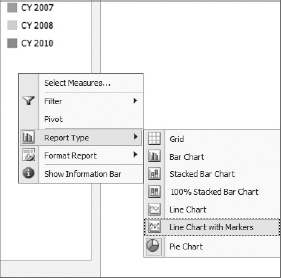
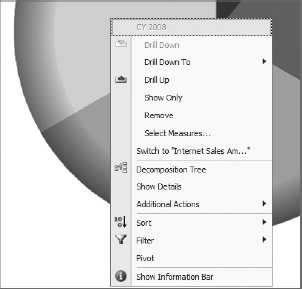
There are three options in this menu that need to be highlighted here:
Drill Down or Drill Up: These options allow you to drill down or up to see different levels of detail presented by the chart element.
Select Measures: If the measure that the report represents is not enough for your analysis, click Select Measures and select one or more items from the list of all measures that exist in the perspective.
Decomposition Tree: This option offers another interactive way of navigating your dashboard. An advantage of using the Decomposition Tree is that it keeps the report sorted and it places insignificant contributors at the bottom of the hierarchy (see Figure 13-54). Of course, if you want to analyze negativity (i.e cities with worse sales amount), you can always flip the default sorting style using the drop-down menu on the top of each level. Decomposition Tree is a Silverlight application and requires the Microsoft Silverlight 3 framework to be installed on the client machine.
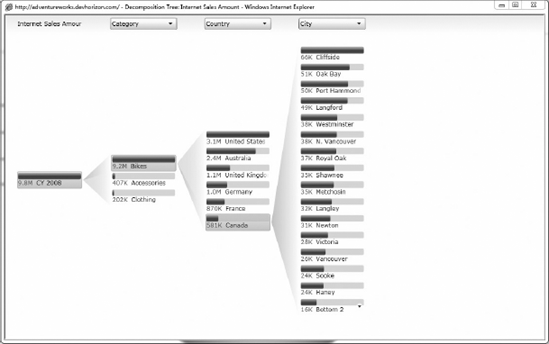
Last, but certainly not least, if you ever decide to show a dashboard element in a completely new page to have more real estate, from the web part that hosts the element, modify the properties, and select Open in New Window, as shown in Figure 13-55. You can also reset the view to the element's original state.
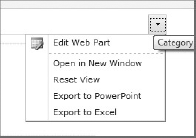
In your analysis, it's often required that you base all your time formulas and functions on a time dimension such as your company's fiscal year. In such scenarios, if your datasource is not aware of the time dimension you use, you will get the error that says the datasource has an invalid time intelligence configuration, as shown in Figure 13-56.
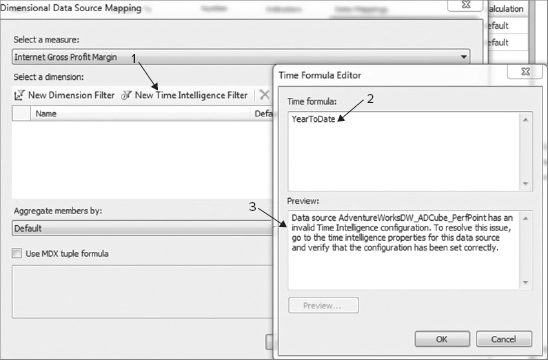
As suggested by the error message, setting the time intelligence configuration in your datasource prepares the groundwork for time intelligence. To configure the time intelligence in your datasource follow these steps:
Navigate to the Time tab in your datasource to select a time dimension, as shown in Figure 13-57.
From the Time Dimension drop-down, select Data.Date.Fiscal, as shown in Figure 13-58.
Click Browse button in the Reference Member field and from the Select Members dialog, select July 1, 2005. Let's suppose that your company's fiscal year starts on July 1st each year. By selecting an reference of July 1st, you make the datasource aware that your time dimension has a starting point on the first day of July each year.
From the Hierarchy level drop-down, specify the granularity of the member you just referenced in the previous step. Since July first represents a day, you should select Day from the drop-down menu.
In the Date picker control, specify a data (i.e 11/1/2009) that is equal to the period specified by the reference member you chose in Step 2 (see Figure 13-59). PerformancePoint Services uses this date to associate the Reference Member to the traditional calendar.
In the Time Member Associations, map your time dimension hierarchies (on the left) to the defined Time Aggregations (on the right).
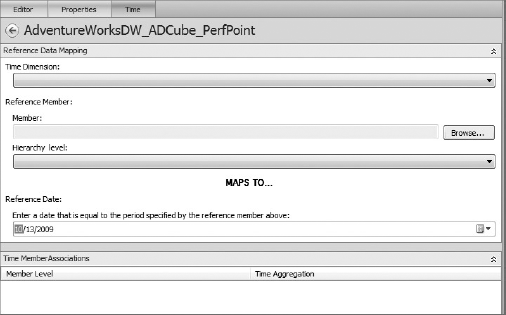
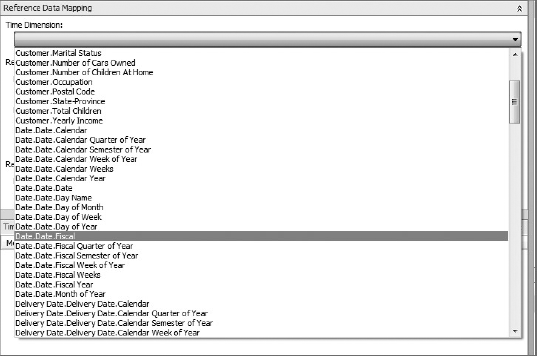
Now you can go ahead and create any formulas or filters that are based on this intelligent time dimension such as [Date.Fiscal].[FY 2006 to Date by Day].
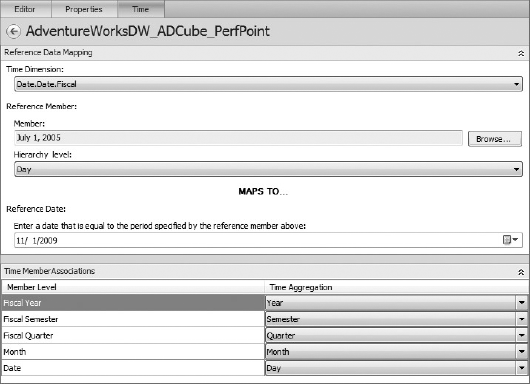
Since the initial release of Reporting Service in 2004, there have been many improvements and shifts in the core architecture. Today, the latest version of the product is named SQL Server Reporting Services 2008 R2; a product that provides a variety of functionalities to help you develop your reports much more easily than before, and perhaps continue experiencing the satisfaction of the good old days!
Unlike Excel Services or PerformancePoint Services, Reporting Services is not a native SharePoint service application. This means that an out-of-the-box SharePoint installation has no understanding of Reporting Services. So, the question is: What makes these two products aware of each other? The answer is a technique called Reporting Services integration with SharePoint.
Reporting Services 2008 R2 integration with SharePoint 2010 comes in two flavors:
Local mode
Connected mode
In order to integrate these two products, at a minimum, you need to download and install the SQL Server 2008 R2 Reporting Services add-in for Microsoft SharePoint Technologies 2010. This gives you the local mode, which is basically the lightest way you can integrate SSRS with SharePoint without any configuration steps. At the time of writing, the add-in is still up for Community Technical Preview (CTP) and can be downloaded at www.devhorizon.com/go/17.
It's worth noting that this particular CTP may expire by the time you are reading this chapter. If that's the case, you should either install the newer CTP or the RTM (Released to Manufacturing) version.
Connected mode, however, is where you get the most out of both products, and it involves more configuration steps both in the SQL Server Reporting Services configuration application and in the SharePoint Central Administration site.
Note
If you are interested in learning more about the integration between these two products, I recommend the book Wrox: Professional Microsoft SharePoint 2007 Reporting with SQL Server 2008 Reporting Services. Although, this book may sound as if it's written for the older versions of both products, most of the information is still very applicable.
In local mode, there is no Report Server and everything is installed on the web frontend server where SharePoint is installed. You can choose to install the add-in before or after the SharePoint installation. However, Microsoft's recommendation is to install it before, because there are fewer configuration steps involved. No additional configuration or replication out to servers in the farm will be necessary.
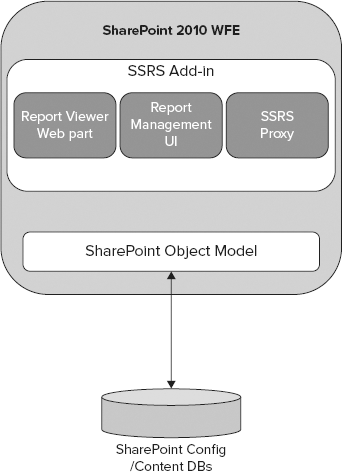
If you choose to install the add-in before installing SharePoint, the add-in creates SharePoint's 14 Hive folder structure and installs the required files, so when SharePoint is installed, the initial configuration of the local mode can be automatically configured.
The architecture of the local mode integration is pretty clean and straight forward, as shown in Figure 13-60.
When you install the add-in, three major components are included in the SharePoint web frontend:
Report Viewer web part: Installs an AJAX-enabled web part for rendering the Reporting Services report on a SharePoint page
Reporting Services proxy: A SOAP endpoint that sets up the connection between both products (for full integration)
Report Management UI: Adds all the Central Administration pages for configuring the integration, as well as application pages and ECB content menu options used for managing reports shared between all SharePoint web applications
Additionally, the add-in delivers the following new capabilities:
The local mode architecture is a subset of a larger architecture model named connected mode. In this mode, SSRS integrates with SharePoint at three different levels: farm, content databases, and security model. To make this integration possible, three additional components are installed on the Report Server, as shown in Figure 13-61.
The security extension uses SharePoint permissions levels to authorize access to report server operations such as reporting processing, snapshots, subscriptions, and the like. Data Management is responsible for doing SSRS native tasks and is the only component in the integration that has access to the Report Server database. The SharePoint Object Model is required, because Reporting Services needs to communicate with SharePoint.
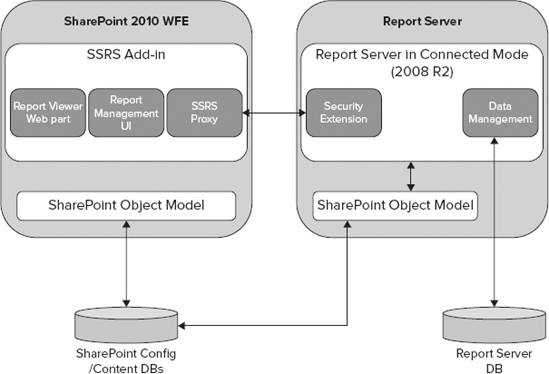
All the Reporting Services operations a user may perform in SharePoint application pages are routed, in the form of a request, to the Report Server for further processing. Depending on the authentication type of the connected mode integration, the request may or may not include the user's identity token in the header.
If you browse to the Reporting Services Integration page (Central Administration

In this page you can select either of the following options:
Trusted Account: In this particular mode of operation, the SharePoint user identity token flows from the WFE to the Report Server and is handed over to the security extension for further authorization actions. The actual connection between two servers is constructed and impersonated on behalf of the SharePoint application pool identity.
Windows Authentications: This authentication mode is used only when you are in a single machine (standalone installation of both products) or when the Kerberos protocol is enabled. Obviously, the Windows integrated security only works for the web applications that are configured for Windows authentication.
Although the new claims-based authentication model in SharePoint 2010 allows you to plug multiple authentication providers into a single web application, there are still cases where you need to extend the web application and use multiple zones.
For example, let's suppose that Adventure Works requires some users to authenticate to the company's intranet sites using smart cards while others still enter their credentials to logon to the sites. The business requirements dictate that reports must work for both types of users regardless of their authentication method. To do so, the IT department has extended the intranet web application, created a new zone, and has set up the certificate mapping for that web application in IIS 7.0.
In the previous versions of Reporting Services, if you wanted to display SSRS reports to those users who authenticated themselves by using their smart cards, reports must have been published to the new zone configured for smart card; otherwise, reports would error out saying that SSRS reports don't support multi-zone scenarios. This was an issue because such reports were pretty useless in other zones.
Thankfully, Microsoft has addressed this issue in Reporting Services 2008 R2 by introducing multi-zone support in the connected mode. You can use the alternate access mapping functionality in SharePoint and set up access to Report Server items from one or more SharePoint zones (default, Internet, intranet, extranet, or custom). You will see an example of a report rendered in two different zones later on. Keep reading!
So far, you have learned that the multi-zone scenario is fully supported in SSRS 2008 R2 when it's configured in connected mode. Suppose that Adventure Works would like to allow access to the catalog of products report without forcing Internet users to log in.
Even though SharePoint supports anonymous access to a site and maps anonymous users to the Limited Access permission level, there is an issue in displaying SSRS reports to anonymous users in connected mode. Unfortunately, Reporting Services still requires a valid security context and doesn't support anonymous access to reports right out of the box. The issue is that Anonymous users do not represent a true security context in SharePoint; therefore, when they try to access reports, SSRS won't be able to authorize their access to Report Server.
Note
Obviously, you can always use custom development and wrap anonymous users in a valid security context (i.e., Guest) and resolve the issue. A proof-of-concept implementation of this technique can be found in my blog at www.devhorizon.com/go/18.
Report Server never allows its service account (configured in the Reporting Service Configuration Manager) and all its administrative privileges to be delegated when connecting to a resource on the network. So, if you are reporting against a datasource that does not require authentication or when you use a SQL account in your datasource, the question is how is the connection between Report Server and the datasource established? Under what security context? Remember, Report Server must use a valid Windows security context to access resources such as an XML file or a SQL instance that supports SQL authentication.
In the Reporting Services world, this liaison account is referred to as execution account and it's mainly used in the following two scenarios:
Scenario 1: Security context for network connection: In this scenario, SSRS sends the connection requests over the network to connect to external datasources, such as an XML file or SQL Server when the report uses a SQL account to log in to the SQL Server instance. If the execution account is not specified, Report Server impersonates its service account but removes all administrator permissions when sending the connection request for security reasons.
Scenario 2: Access to external resource: In this scenario, SSRS sends the connection requests to retrieve external resources used in a report that doesn't store credentials in its datasource.
For example, when you create a report that has a link to an external image stored in a remote server, in the preview mode your credentials as a developer will be used to display the image. However, when the report is deployed to production and viewed on a SharePoint site, Report Server uses its execution account to retrieve the image. If the execution account is not specified, the image is retrieved using no credentials (i.e., anonymous access). Obviously, if neither of these two accounts has sufficient rights to access the image, it won't show up in the report. This is very important to remember for deploying reports to SharePoint, because images used in your report may or may not be in the same site collection that the current report viewer has permission to access.
Note
The Reporting Services execution account is totally different from the unattended account in Excel Services or PerformancePoint. The SSRS execution account must be used only for specific functions as described in this section. Microsoft has made it crystal clear that the execution account must not be used as a login account or for retrieving data from backend datasources. For more information, see the official statement in the "How to Use Unattended Report Processing Account" section in Book Online at www.devhorizon.com/go/19.
To set up an execution account you need to specify it in the Execution Account page in the Reporting Services Configuration tool, as shown in Figure 13-63.
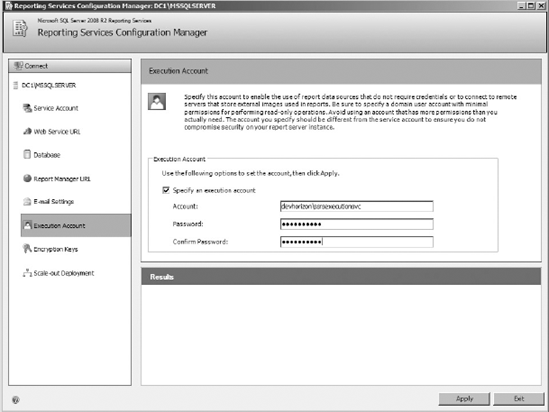
The execution account is encrypted and stored in the RSReportServer.config file.
If you have installed Reporting Services using a scale-out topology, you must run the configuration tool on each report server and use the same set of credentials for the execution account.
While Reporting Services reports can be deployed and managed in any site or document library, in this section you will continue using the BI Center site (which you built earlier) for housing Reporting Services reports.
To make a site such as the BI Center understand Reporting Services reports, models, and datasources, you need to add the required content types to the Data Connections and Documents libraries, because they are not added by default.
And, with that, let's get started:
Browse to the Data Connections library.
From the Ribbon, click on Library Tools
Under Content Types, click Add from existing site content types.
In the Select Content Types section, in Select site content types from, select Report Server Content Types from the drop-down list.
In the Available Site Content Types list, click Report Data Source, and then click Add to move the selected content type to the Content types to add list, as shown in Figure 13-64.
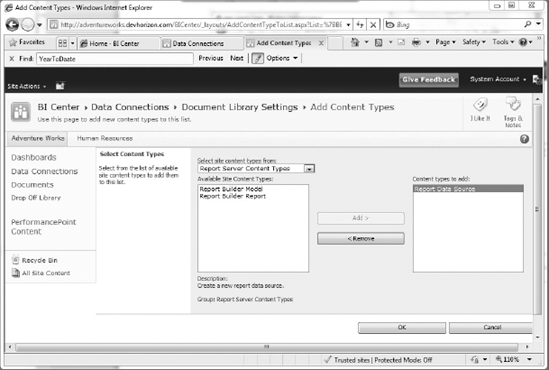
With the Data Connections library properly set up, next comes the Documents library. Follow the exact steps you took for the Data Connections library with one exception: from the list of available content types, only select Report Builder and Report this time.
The configuration steps you took in this section enable you to view and manage Reporting Services reports directly from the BI Center. Now, you can publish Reporting Services content to both document libraries and then view and manage those documents directly within the SharePoint context.
Unlike Excel and PerformancePoint, in Reporting Services you have two options when it comes to the authoring tool: BIDS or Report Builder. What is BIDS and why should you care?
BIDS is short for Business Intelligence Development Studio. It's a development tool that allows you to build reports and deploy them to a SharePoint site. The latest version of BIDS ships with SQL Server 2008 R2 and is almost always referred to as BIDS 2008 R2.
BIDS 2008 R2 supports four operations of RDL (Report Definition Language) files: opening RDL files, building and previewing the RDL files, and deploying them to a SharePoint site that is configured with an instance of Report Server (2008 or 2008 R2), as shown in Figure 13-65.
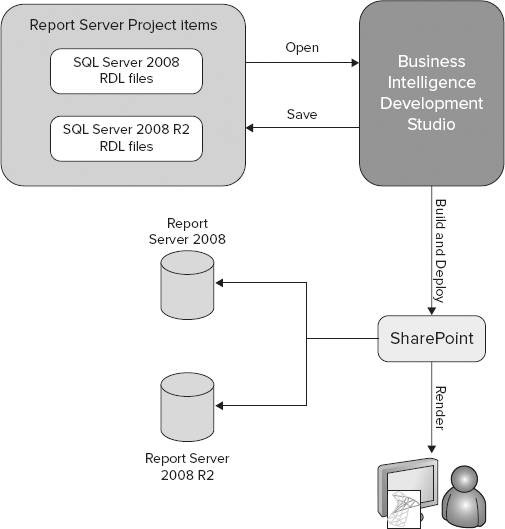
BIDS 2008 R2 works with both earlier and later versions of RDL files. Although BIDS may sound like an standalone product for report development only, in all reality BIDS is just a lightweight version of Microsoft Visual Studio 2008 with some BI project templates, such as Report Server project templates (for Reporting Services), Integration Services project templates, and Analysis Services project templates.
Although BIDS is the preferred tool for many report developers, it should be noted that that there is another option for developing reports: Microsoft Reporting Services Report Builder 3.0. You can download and install a small standalone MSI for this product (August 2009 CTP version) from the following URL: www.devhorizon.com/go/20. This product, also free, is an authoring tool to create reports. Report Builder is also a Click-Once application that has many of the same features in BIDS, but not all.
Since the audience of this book is mostly SharePoint developers, Reporting Builder 3.0 will not be used for creating reports, because it is mostly used by Information workers. The BIDS IDE is very similar to Visual Studio 2008, so it will be familiar to a lot of SharePoint developers.
The report that you will build in this section shows the Adventure Works sales by quarter and product category. This report illustrates some of the new visualization features shipped with SQL Server Reporting Services 2008 R2. This report also illustrates the use of a tablix data region with nested row groups and column groups. Tablix is a very flexible data region and grouping report item which was first introduced in Reporting Services 2008.
Once you build the report, you can preview the report in BIDS 2008 R2 and make the final adjustment before publishing it. Finally, you will deploy this report to the BI Center site and make it available to the end users. Users can quickly get a sense of the report by looking at the visuals embedded in the report or drill down from summary data into detail data for more information by showing and hiding rows.
As mentioned before, you will use BIDS 2008 R2 to create the reports in this chapter. However, there are also two ways you can build your reports in BIDS: manually or by using the Report Wizard. In this section, you will use the manual process.
To author your first report, follow these steps:
Open BIDS 2008 R2.
Click Ctrl+Shift+N to open the New Project dialog.
From the available templates, select the Business Intelligence Projects types, and then click Report Server Project.
Name the project something descriptive such as Chapter13_SSRSReport, and click OK.
In the Solution Explorer, right-click the Shared Data Source and select Add New Data Source.
Point the new datasource to the AdventureWorks database, as shown in Figure 13-66.
In the Solution Explorer, right-click the Reports folder and select Add
In the Report Data tab, right-click the Datasets folder, and select Add Dataset to open the Dataset Properties dialog.
Change the name of the dataset to DSSales, and then select the Use a dataset embedded in my report option.
Note
Starting in Reporting Services 2008 R2, datasets that you create in your reports can be stored externally from the report and shared between multiple reports. Like shared datasources, shared datasets can be created by IT or more senior developers and shared with information workers or other developers.
Shared datasets can be created in two ways. Either right-click the Shared Datasets folder in the Solution Explorer and add a new dataset or simply right-click on a nonshared datasource and select Convert to Shared Dataset.
Click the New button to open Data Source Properties.
Select the Use a shared datasource reference option, and from the drop-down list choose the datasource you created in Step 5. Click OK to get back to the Dataset Properties dialog.
Click the Query Designer button to open the Query Designer. Once the Query Designer dialog opens, click the Edit as Text button to switch to Query Mode.
Paste the query below in the query textbox. The query is a join between the ProductSubcategory, SalesOrderHeader, SalesOrderDetail, Product, and ProductCategory tables, and it's grouped on the following columns:
Order date (only year)
Category name
Subcategory name
The letter "Q" concatenated with
ProductCategoryID(i.e., Q1, Q2, . .)
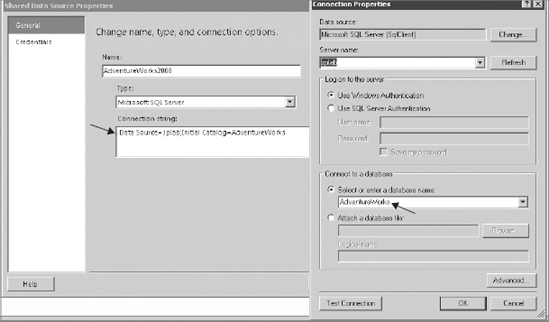
The query also takes two parameters, named @StartDate and @EndDate, to limit the calculation of the sales amount to a period of time specified by the parameters.
SELECT
   PC.Name AS Category, PS.Name AS Subcategory,
   DATEPART(yy, SOH.OrderDate) AS Year,
   'Q' + DATENAME(qq, SOH.OrderDate) AS Qtr,
   SUM(DET.UnitPrice * DET.OrderQty) AS Sales
FROM Production.ProductSubcategory PS INNER JOIN
   Sales.SalesOrderHeader SOH INNER JOIN
      Sales.SalesOrderDetail DET ON SOH.SalesOrderID = DET.SalesOrderID INNER JOIN
      Production.Product P ON DET.ProductID = P.ProductID
      ON PS.ProductSubcategoryID = P.ProductSubcategoryID INNER JOIN
   Production.ProductCategory PC ON PS.ProductCategoryID = PC.ProductCategoryID
WHERE (SOH.OrderDate BETWEEN (@StartDate) AND (@EndDate))
GROUP BY DATEPART(yy, SOH.OrderDate), PC.Name, PS.Name,
   'Q' + DATENAME(qq, SOH.OrderDate), PS.ProductSubcategoryID
You can examine the query result by clicking the button that has the exclamation mark on it and then entering a sample start date and end date such as 1/1/2003 and 12/31/2004. The returned result will appear in the grid below the query section, as shown in Figure 13-67. Once you are done, click OK to close the Query Designer.
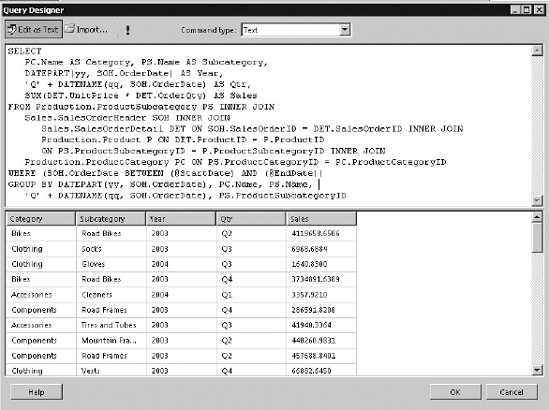
Step 14: Click OK again to close Dataset Properties dialog.
At this point, you should have a dataset with the following fields: Category, Subcategory, Year, Qtr, and Sales. The next logical step is to actually build the report display as outlined here:
Start by dragging a matrix from the toolbox to the Body section of the report.
From the Report Data tab, drag the following fields to the specified places on the design canvas:
The Category field to the matrix cell where it says Rows
The Year field to the matrix cell where it says Columns
The Sales field to the matrix cell where it says Data
The Subcategory field to below the Category field in the grouping pane where it says Row Groups (bottom-left corner)
The Qtr field to below the Year field in the grouping pane where it says Column Groups (bottom-right corner)
Delete the column titles for the Category and Subcategory fields that appear on the left side of the Year field. Your report layout should now look like Figure 13-68.
Hold down the Ctrl key and select all the cells in the matrix except the one that says Sum (Sales). From the properties window, change the following properties.
BackgroundColor: SteelBlue
Color: White
FontWeight: Bold
Select the textbox that has
[Sum(Sales)]in it. From the Properties windows, set'$'#,0;('$'#,0)as the value of theFormatproperty (see Figure 13-69). This string is used to apply the currency format to each sales amount cell that appears in the final report.
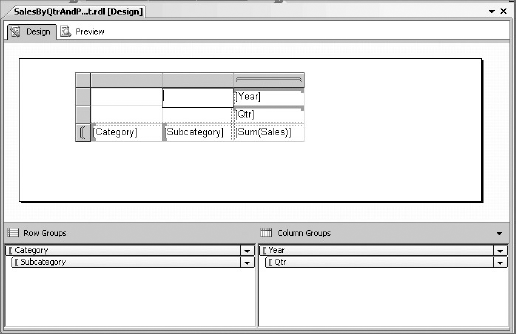
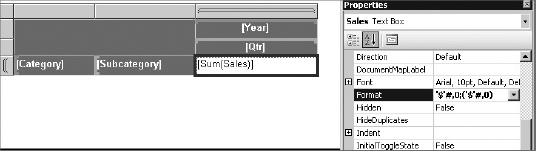
You are almost done with the initial formatting and clean up, but you still have to enable the drill-down, so the report allows users to look deeper in any area they choose. The goal is to show categories and years only when the report is first run and then allow users to see the subcategories and quarters by using the tree-style +/- controls that appear next to each category or year.
Click the subcategory group in Row Groups section to highlight it.
Click the down arrow that appears just to the right side of the group, and then select Group Properties.
Once the Group Properties window opens, go to the visibility section.
Select the Hide option and set the toggle item drop-down list to Category.
This collapses and hides the subcategory when the report is first run. If you set the toggle item property to
Category, when the report is run, a little plus sign appears next to each category, which allows users to drill down into each subcategory exactly like a tree view. You can repeat the exact same steps to toggle theQtrfield by Year.
That's everything you need to do to build a very basic report that shows the Adventure Works sales by quarter and product category. Finally, preview the report; it should appear like the one shown in Figure 13-70.
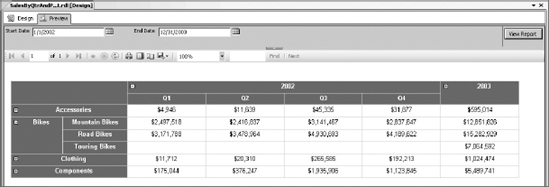
If you have been developing or designing reports for any amount of time, you probably know that no report is complete without some kind of visualization. Essentially, reports are there to allow end users to make fast business decisions, so if you can represent your report in such a way that they can intercept its data immediately and get the key points, your report would be of great value to them.
With SQL Server Reporting Services 2008, Microsoft introduced a useful data visualizations, named gauge. The gauge allows report developers to visually display aggregated data, and it's commonly used in digital dashboards. In SQL Server Reporting Services 2008 R2, more data visualizations are introduced. Sparklines, data bars, and indicators are additions to the SQL Server Reporting Services family, representing the same basic chart characteristics of values, categories, and series, but without any fluff such as axis lines, labels, or a legend.
Data bar: A data bar is like a regular bar chart in which each bar can be scaled based on a given value to display one data point or more.
Sparkline: Similar to Sparklines in Excel, a Sparkline in Reporting Services is just a mini-chart that trends over time. They are commonly used to display multiple data points.
Indicator: An indicator is a small icon that is often used to display the status or trend over time for a specific value.
In the example in this section, you have a chance to work with a Sparkline chart, while continuing work from where you left off with the sales by quarter and product category report created in the previous section.
For a Sparkline chart, you need a value field like Sales and a group like Quarter for which to record the trend. To add this to your report, follow these steps:
Add a new column on the matrix by right-clicking the column that has the [Year], [Quarter] and [Sum(Sales)] fields, and select Inset Column
Add a Sparkline to the new column by dragging and dropping the Sparkline from the toolbox to the cell that appears to the right of the cell that has [Sum(Sales)]. Note that because Sparklines display aggregated data, they must be placed in a cell associated with a group.
From the Select Sparkline Type dialog, select Area and click OK. You should now have a Sparkline ready to be configured in the new column, as shown in Figure 13-72.
Click the Sparkline image. This will open the Chart Data dialog on the right. Click the yellow plus symbol to the right of the Values area, and select the Sales field from DSSales dataset.
Click the plus symbol to the right of the Category Groups area, and select Qtr field. Your report is now ready to preview. Switch to the preview window in BIDS, and your report should be like the one shown in Figure 13-73.
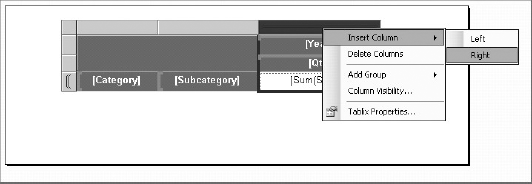

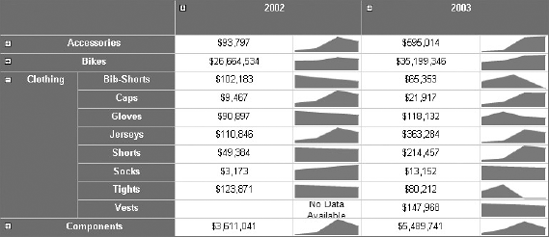
Note
This report can be found in the code download for this book, in the Chapter 13 .zip file. It is called SalesByQtrAndProductCat.rdl.
Although you used a matrix in your report, you are really using a tablix data region under the covers. The tablix (table + matrix) data region was first introduced in Reporting Services 2008, and it offers the flexibility of the table combined with the crosstab reporting features of the matrix.
As you can see in your report, Product Category and Product Subcategory are sharing two different columns, and there is a considerable amount of horizontal spacing wasted in the first column. You can reduce this spacing and make both groups share the same column by using a new feature in tablix called stepped columns. If you have been doing crosstab reports, you probably know that this wasn't an easy thing to implement with the old matrix. For more information on stepped columns, refer to the official documentation at www.devhorizon.com/go/21.
Another feature in tablix that can help you improve your crosstab reports is something known as side-by-side crosstab sections. Your report is currently broken down by year at the top, but what if you wanted to have the same grouping (Product Category, Product subcategory) by territory side by side with the year section? What if you want to allow users to drill down into categories and subcategories and see the year breakdown and territory breakdown at the same time?
If you wanted to do this report in SSRS 2005, you had to do it using multiple matrices, but in SSRS 2008 and 2008 R2, you can use a tablix and its native support for side-by-side crosstab sections. All you need to do is to include the territory data in your return result set and add it as a parent column grouping in the same matrix you just used in your report. As matter of fact, you can have an unlimited number of side-by-side crosstab groups (correlated or uncorrelated) on rows and columns of a tablix data region.
The tablix feature of Reporting Services makes using asymmetric layouts in your report super easy.
Now that you have prepared your report, you are ready to deploy it to SharePoint 2010. In BIDS, the terms publish and deploy are interchangeable. They both refer to a process that makes the report available in SharePoint for online viewing. Although the publishing process may seem simple at first glance, there is more to it than just moving the content from your local drive to a SharePoint site.
What happens during publishing that makes it a special process? First, BIDS validates the report before it is added to the destination libraries in SharePoint and if there are any problems you will be notified. As you may know, you can always go to a document library and upload documents yourself, but in this particular case, you should avoid direct uploads, because the validation check never occurs. This means that you never know if your reporting files are valid until either you manually access them or a background process such as snapshots, subscriptions, or a caching process references them.
Second, during the publishing process any shared datasource in the report project will be converted to an .rsds file name extension (originally, the file extension was .rds). Both .rds and .rsds files have the same content, but they come in different schemas. What's important to note is that it's only the .rsds file extension that is recognizable by SharePoint, and this is defined in the file extension mapping file (Docicon.xml) located at Drive:Program FilesCommon FilesMicrosoft SharedWeb Server Extensions14TemplateXML using the following entry:
<Mapping Key="rsds" Value="datasource.gif" OpenControl="SharePoint.OpenRsdsFiles"/>
The process of converting the .rds file extension to .rsds involves a web service call to the CreateDataSource() web method located at the ReportService2006.asmx endpoint, which makes the actual conversion. Note that you can perform the conversion programmatically by calling this web service and passing in an .rds file.
Finally, there is one more thing that the publishing process does for you. If you happen to publish a report that already exists in the destination document library, the report will be checked out, updated as a new version, and then checked back in for you. This is important because it illustrates that reports are treated like any other document content type for the purposes of versioning, permissions, and retention.
Publishing your report to SharePoint is relatively simple. Right-click the solution name and click Properties to open the Property dialog window, as shown in Figure 13-74.
Note
As you can tell, the Deployment Properties dialog has now changed to support new deployment settings related to shared datasets and the fact that BIDS 2008 R2 can open report definition files for both SSRS 2008 and SSRS 2008 R2.
Below, you will find all the properties and a brief explanation to help you understand what they are for and what you need to type in them to deploy your report to SharePoint.
Boolean Properties: true or false:
OverwriteDatasets: This setting specifies if the shared dataset definitions will be overwritten if they already exist in the TargetDatasetFolder in the target SharePoint site.
OverwriteDataSources: This setting specifies if the shared datasource definitions will be overwritten if they already exist in the TargetDataSourceFolder in the target SharePoint site.
URL Properties:
TargetDatasetFolder: A folder relative to the URL you specify in the
TargetServerURLproperty. This folder keeps all the shared dataset definition files.TargetDataSourceFolder: A folder relative to the URL you specify in the
TargetServerURLproperty. This folder keeps all the shared datasource definition files (.rsds).TargetReportFolder: A folder relative to the URL you specify in
TargetServerURLproperty. This folder keeps all the report definition files (.rdl).TargetReportPartFolder: A folder relative to the URL you specify in the
TargetServerURLproperty. This folder keeps all the report part definition files (.rcs). Report parts will be covered in more detail later in this chapter.TargetServerURL: The URL of the target SharePoint site where you wish to deploy your report.
TargetServerVersion: The expected version of SQL Server Reporting Services that is integrated with the target SharePoint site specified in the TargetServerURLproperty.
Set the value of the TargetDatasetFolder, TargetReportFolder, and TargetReportPartFolder properties to the fully qualified URL of the Documents document library in the BI Center (see the "Configuring the BI Center" section). Next, set TargetDataSourceFolder to the fully qualified URL of the Data Connections document library in the BI Center (see the "Configuring the BI Center" section). Finally, set the TargetServerURL property to the fully qualified URL of the BI Center and the TargetServerVersion property to SQL Server 2008 R2.
With the deployment properties completely configured, you are ready to deploy the report with all its items to SharePoint. Note that you need Full Control or Contribute permission in the site on which you are deploying your reports; otherwise, you will get the Reporting Services login when you attempt to build and deploy the reports. To deploy this report, all you have to do is right-click the solution and click Deploy.
At this point, you can browse to the document library and click the name of the report to render it in the browser (via RSViewerPage.aspx), as shown in Figure 13-75.
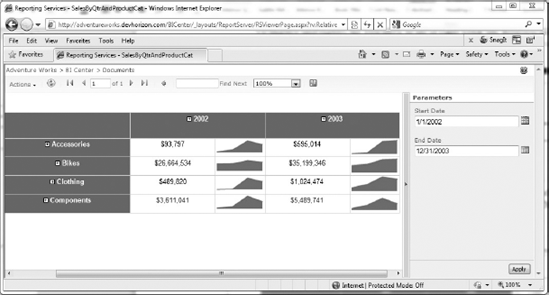
In case you didn't notice, there is a Cancel link on the page every time your report is run. This means that report processing is now completely asynchronous, and you have the option to cancel it while it's in progress.
By definition, report parts are individual items that make up an SSRS Report. They can be anything in a report from a parameter to a data region, such as a matrix. The idea is like splitting an ASPX page into smaller user controls, so they can be shared across multiple pages.
The good news is that these components can now be saved individually — without the rest of the report page. More precisely, however, report developers from either BIDS or Report Builder 3.0 publish report parts to a destination folder, and then other report developers or information workers can reuse the published parts and put together their own reports without having to build everything from the ground up.
Creating report parts in BIDS is for more experienced report developers, who will create these components and perhaps use source control, whereas Report Builder is for less experienced users, who should use the published report parts to build their own reports.
The report that you built in this section has only three items that can be published as report parts. To make these parts available on the SharePoint site, follow these steps:
From the Report menu, click Publish Report Parts.
This will open the Publish Report Items dialog, where you can select which items should be made available in the Report Parts library, as shown in Figure 13-76. Select all the items and click OK.
Redeploy your report by right-clicking the solution and click Deploy.
Browse to the Documents document library in SharePoint and verify that all the parts are successfully published to SharePoint, as shown in Figure 13-77.
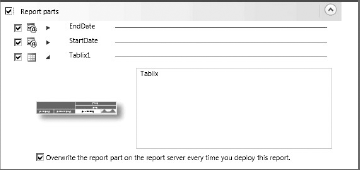
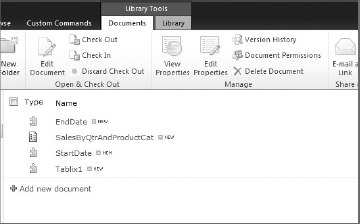
Once the report parts are published to a site, they can be found and reused by information workers using Report Builder. To see a list of available report parts in Report Builder, browse to the View tab and select Report Part Gallery. You can search for a specific part by typing its name in the search box provided on the top of the pane.
In addition to the RSViewerPage.aspx, there is another way of displaying your reports in SharePoint, through the use of the standalone Report Viewer web part. Adding a Report Viewer Web Part to a page is as easy as dragging and dropping it into a Web Part zone and then setting some simple properties.
To host your report in a Report Viewer web part, follow these steps:
Browse to Site Actions
In the All Site Content page, click the Create button.
In the Create dialog, select Page category and choose Web Part Page.
Click the Create button. This will take you to New Web Part page.
In the Name textbox, enter SSRS Demo.
Choose Header, Footer, 3 Columns from the available layout templates.
Click the Create button.
Add an instance of the Report Viewer web part to the Header Web Part zone.
Click the Web Part menu, and select Edit Web Part to open the Tool pane. Notice the extra tabs in the Tool pane, which provide custom properties specific to the Report Viewer web part, as illustrated in Figure 13-78.
In the Report textbox, specify the relative path and file name of your report. In this example, it is
/BICenter/Documents/SalesByQtrAndProductCat.rdl.Note
Because current integration between Reporting Services and SharePoint supports multiples zones, the Reporting Services team has changed the Report Path to be relative. Previously, Report Path had to be a fully qualified URL.
Leave the default View settings.
In the Parameters tab, click the Load Parameters button. You can leave the report to use its default values, or you can override the report so that it is rendered with another value of your choice.
Click Apply, and then click OK to close the pane.
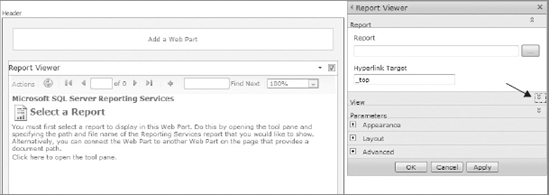
Figure 13-79 shows a rendered report in a Web Part page.
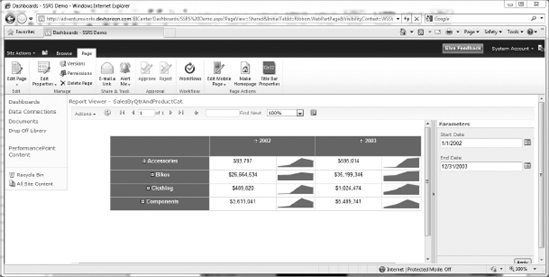
Now that you have a good understanding of the Report Viewer web part's capabilities, you should be aware of a few limitations with this web part.
First, you cannot have multiple reports in your site that point to different instances of Report Server. This is due to the fact that Reporting Services integration with SharePoint is implemented and configured at the farm level, and the Report Viewer web part and other integration operations simply follow the same model at each site collection level. Second, you cannot group multiple reports into a single instance of a Report Viewer web part. Third, you cannot open a saved report as an attachment to a list item. The Report Viewer web part can only respond to reports that are stored in a document library or are passed in via a connectable web part. Last, but certainly not least, the Report Viewer web part class is sealed and as such is not available for developers to leverage. If you need your own custom Report Viewer web part, you need to code it from scratch or put a wrapper around the Microsoft Report Viewer control.
One of the great features of SharePoint is the Web Part Connection framework, which allows web parts to accept connections from other web parts. In a nutshell, a connection is an association between two web parts that enables them to share data.
As demonstrated throughout this chapter, building Dashboard pages where different types of web parts exist on the same page, each showing different content and data, is an important part of the BI capabilities of SharePoint 2010. In real-world scenarios, these web parts often communicate with each other and are very interactive.
In the previous section, it was mentioned that one of the limitations of the Report Viewer web part is its one-to-one association with a report definition file. A standalone Report Viewer web part is useful when visitors to a page are likely to be interested in a particular report. However, in dashboard-style scenarios, a standalone web part is less likely to be what you really want. You need a web part that's more interactive.
Thankfully, the Report Viewer web part acts as a subscriber in web part connections by implementing the required interfaces, as shown in Figure 13-80. This means that you can make an instance of the Report Viewer web part to communicate with, and get its parameters or even the report definition from another web part on the same page or across pages.
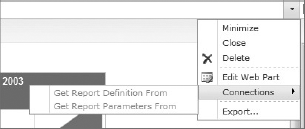
If you recall from an earlier discussion, one of the key factors to support the "BI for everyone" vision is to allow users access to the most up-to-date data for their day-to-day analysis. The problem is that, in many organizations, direct access to the backend datasources historically has been limited to a number of administrators and a few service accounts. That's mainly because directly accessing raw data without going through the business logic and security layers is not a best practice and can put organizational assets at much higher risk.
Starting with SQL Server 2008 R2, SSRS report data can be rendered as an Atom feed that follows WCF data services conventions. This means that you can get high-quality and refreshable data sourced from pretty much anywhere a report can get data from; whether that data is represented in a tablix, chart, or other form, really doesn't matter!
Note
To use your SSRS reports as data feeds, you need to install and configure Reporting Services and PowerPivot for SharePoint in the same farm. Also, on the client machine, the PowerPivot for Excel client must be installed. For more information, see the instructions at www.devhorizon.com/go/22.
Once you have found a report with backend data that you are interested in analyzing, you can pull it into your PowerPivot workbook by clicking the new orange Export to Data Feed button on the Report toolbar, as shown in Figure 13-81.
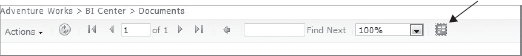
This will generate an .atomsvc file output and ask you if you want to open it locally.
If you already have an Excel workbook open, you will be prompted to either select an open workbook to add the data feed to, or create a new workbook for the feed.
Next, the Excel client is launched and it goes straight into the PowerPivot tab where the Table Import Wizard pops up.
If you click the Next button, the Table Import Wizard will show you a list of data regions in the report that you can import into your Gemini model and specify table names for. Optionally, you can preview data and select which columns from the data feed to add to your model, as shown in Figure 13-82.
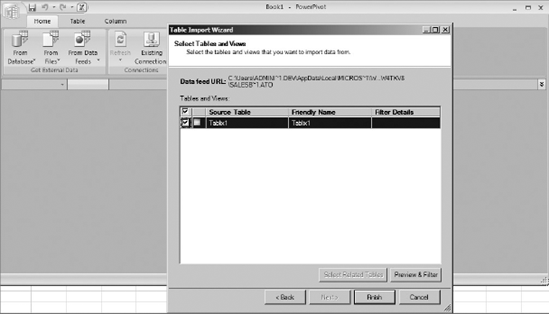
Now you should be able to consume the data feed and use the Tablix1 data region as a datasource in your PowerPivot workbook.
At the time of writing, SQL Server Reporting Services 2008 R2 is still in November CTP. In this version, the Export To Data Feed option only works for Tablix and Chart and not for Map. This will most likely change when the product is released to manufacturing (RTM).
The Open with Report Builder option in SSRS 2008 R2 has received two major bug fixes. First, if you click the Actions menu and choose Open with Report Builder, Report Builder 3.0 now launches by default if it's installed on the server. This action points to the following URL to instruct Report Builder which report to open:
http://adventureworks.devhorizon.com/_vti_bin/ReportBuilder/ReportBuilder_3_0_0_0
.application?ReportPath=http://adventureworks.devhorizon.com/BICenter/Documents/
SalesByQtrAndProductCat.rdl
Prior to the SSRS 2008 R2 release, Report Builder 1.0 would be launched and it was almost impossible to make SharePoint open the Report Builder 2.0 instead.
A second issue that's been addressed in this release is the opening by Report Builder of published drill-through reports. Previously, this would result in an error by Report Builder, because Report Builder was trying to resolve the action locally. However, in Report Builder 3.0, the action is forwarded to SharePoint for further processing and no action is taken locally.
When a user clicks your report or it's viewed in the Report Viewer web part, the dataset defined in that report executes and returns data to the Report Server from the underlying datasource. Next, the report execution engine uses the report definition file stored in the SharePoint content database to determine how to create the report from the retrieved data, transform it into HTML, and finally push it down through the HTTP pipeline to the user's browser. This process is known as on-demand report execution.
Although the on-demand report execution process always results in the most up-to-date data being returned to users, each time the report is requested, a new instance of the report is created, which in turn results in a new query being issued against the underlying datasource. This can add up exponentially until it results in the utilization of all the resources in your SharePoint farm.
When users don't need on-demand report execution, and when you need fast report performance, there are some other processing options available to help you manage your report delivery needs in more efficient ways. For example, wouldn't it be nice if users could run your report from the cache or snapshots instead? What are your options to prevent the report from being run at arbitrary times during peak hours?
Thankfully, SSRS 2008 and 2008 R2 offer functionalities that can help you deliver your reports faster and more efficiently. These options are all available from the Edit Control Block (ECB) menu of the report definition file, as shown in Figure 13-83.
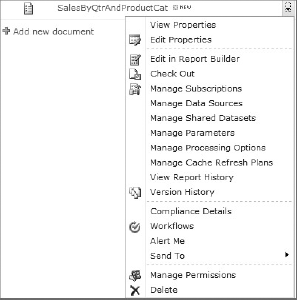
The goal of this chapter is to introduce techniques that can be used to improve the performance of your reports, which altogether result in a better user experience. Several operations that are discussed in this section require that you hard code the credentials in your report's datasource. That's because such operations do not represent a valid windows security context, and they can't access the backend datasources by themselves.
And, with that, let's start with storing credentials first!
Several operations that are discussed in this section require that you hard code the credentials in your report's datasource. That's because such operations do not represent a valid windows security context, and they can't access the backend datasources by themselves.
To store credentials in your datasource, browse to the Data Connections library where you published the datasource and just click on it. You will be taken directly to a page like the one shown in Figure 13-84. In this page, there are multiple options, but the one you will want to configure is the third one from the top, where it says Stored Credentials.
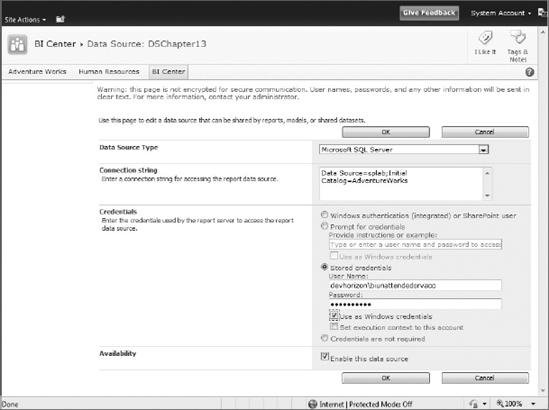
When you specify the stored credentials, there are two options you can select that determine how the stored credentials are authenticated.
Use as Windows credentials: If you select Use as Windows credentials, the stored credentials should be a Windows user account, because it is passed to Windows for subsequent authentication. Thus, you can specify this option and then use a SQL login. Obviously, the account you use here must be granted read permission at minimum to access the resource.
There are two important tips to remember with regard to this option. First, do not check this box if your datasource is using database authentication only (for example, SQL Server authentication). Second, the Windows domain user account must also have permission to log on locally. This permission allows Report Server to impersonate the user on the Report Server box and send the connection request to the external datasource as that impersonated user.
Set execution context to this account: You should select this option only if you want to set the execution context on the database server by impersonating the account that represents the stored credentials. Think of this option as the Transact-SQL
SETUSERfunction in SQL Server.There are two important tips to remember when selecting this check box. First, if your datasource is going after SQL Server databases, this option is not supported with Windows users; use SQL Server users instead. Second, do not use this option for reports initialized by subscriptions, report history, or snapshots, because these processes need a valid Windows user context (not a SQL login) to function.
In the real world, most of the reports you develop have one or more parameters, so before diving into evaluating other processing options, it makes sense to look at managing report parameters first.
Unlike when you run parameters' reports on-demand, end users won't get a chance to specify parameter values for reports delivered to them behind the scenes. As you saw, you can manage the default values configured for the report parameters when authoring reports in BIDS or Report Builder. You can also manage report parameters after they are published to SharePoint without having to go through the publishing process again.
To manage the parameters of your report, follow these steps:
Browse to the Documents document library.
Click the ECB menu, which appears to the right of the report title, and select Manage Parameters. If the report contains any parameters, they will be listed in order.
Click one of the available parameters, and you should see a page similar to the one shown in Figure 13-85.
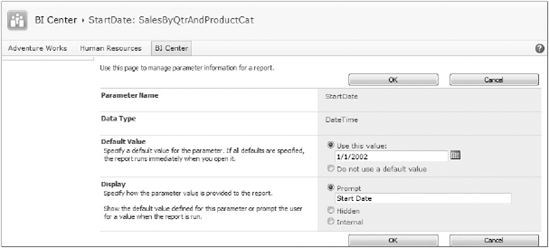
In this page, you can override the default value for the selected parameter as well as specify how the parameter value should be provided to the report. Available options are:
Prompt: Parameter appears as a textbox (for single-valued parameters) or combobox (for multi-valued parameters) in the parameter input pane next to the rendered report. Users can specify a new value or select from the available options.
Hidden: If you select this option, the parameter will be hidden in the Parameter Input pane, but its value can be set in background processes such as subscriptions, caching, and so on. You will learn about these processes a bit later.
Internal: An internal parameter is not exposed to end users or background processes but is still available in the report definition file.
Reporting Services provides a powerful and easy-to-use caching mechanism that helps you keep a balance between having up-to-date data in your reports and having faster access to the reports.
Note
Like many other heavy-duty operations, caching a report is managed by Report Server, not SharePoint. A cached report does not utilize page output caching in SharePoint.
Of course, caching comes at a cost and can be destructive if used in inappropriate ways. So, before you jump right into the hassle of setting up your report for caching, you need to have a plan. The most important step is to figure out how your design can best utilize caching and what risks you need to be aware of.
When you configure a report for caching, the first time it is requested everything is identical to the on-demand report execution. In fact, the first user who hits the report turns the report into a cached instance and pays the price for everyone else who requests the same instance later on. A cached instance is tied to a combination of parameter values. For example, if you have a parameterized report that has two parameters A and B, then a cached instance of this report with parameter values of A1 and B1 is different from another cached instance that has A2 and B2 as parameter values.
Once the report is turned into a cached instance, it is stored in the Report Server temporary database as an intermediate format image until the cache is invalidated. At this point, if any user requests that report with the same combination of parameter values, the report server retrieves the image from the Report Server temporary database and translates it into a rendering format.
As you may notice, for a report that uses several parameters, there can be multiple cache instances in memory. So, this is something that you may want to consider right up front.
Another thing to consider in your cache planning is the cache refresh plan. The key question you should ask yourself in this step is: How frequently must the cache be invalidated? The answer to this surprisingly simple question reveals a lot about the schedule you need to associate with your cache refresh plan (see "Managing Cache Refresh Plans" later). Remember that, in a transactional database, underlying data may change often; keeping an in-memory representation of data for a long time can lead to inaccurate results and, obviously, wrong decisions.
You don't want to get demoted for just caching a report, right?
Now that you have a plan in place, the final piece of puzzle is the most obvious one, caching the report by following these steps:
Browse to the Documents document library.
Click the ECB menu, which appears to the right of the report title, and select Manage Processing Options.
From the Data Refresh Option section, select Use cached data option.
From the Cache Options section, select Elapsed time in minutes and leave it at 30 minutes until the cache is invalidated.
Click OK to enable caching for your report.
The way that you cached your report in the previous section is good, but you could use more control over how the report should be cached. In SSRS 2008 R2, Microsoft introduced cache refresh plans to address this issue.
To create a cache refresh plan, follow these steps:
Browse to the Documents document library.
Click the ECB menu, which appears to the right of the report title, and select Manage Cache Refresh Plans. You should be looking at a page like the one shown in Figure 13-86.
Click New Cache Refresh Plan. If you haven't enabled caching as described in the previous section, you will get the error message shown in Figure 13-87. When you click OK, caching will be automatically enabled for you.
Create a cache plan for default parameter values (1/1/2002, 12/31/2003) and a custom schedule that caches this instance once only at 8 am of 12/31/2009. Let's suppose that 12/31/2009 is the date on which this report is made available to the users.
Click OK to go back to Manage Cache Refresh Plans page.
Click New Cache Refresh Plan, to create a new cache plan.
Create a cache plan for overridden parameter values (1/1/2010, 12/31/2010) and a custom schedule that caches this instance at 8:00 AM every Monday of every week, starting 1/4/2010, as shown in Figure 13-88.
Click OK to go back to Manage Cache Refresh Plans page. Your cache plans should be like those shown in Figure 13-89.
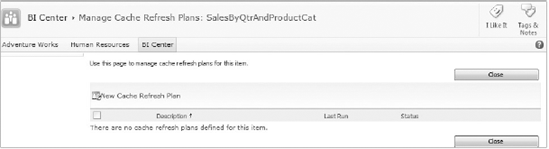
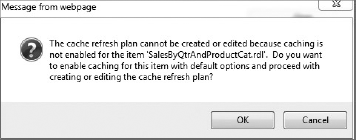
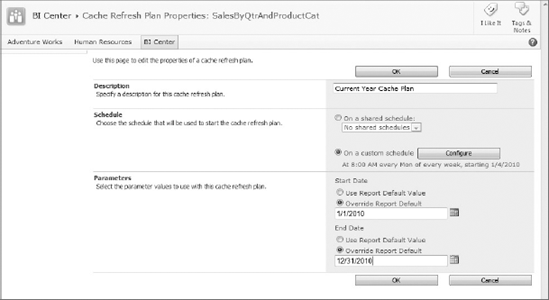
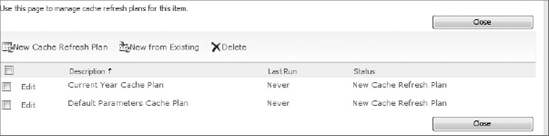
With the two cache plans properly configured, now you have your report with the following caching policies:
Your report with Start Date=1/1/2002 and End Date=12/31/2003 will be cached once at 8 AM on 12/31/2009 only.
Your report with Start Date=1/1/2010 and End Date=12/31/2010 will be cached at 8:00 am every Monday of every week, starting 1/4/2010.
Any other combinations of parameter values follow the default caching schedule you set up in the previous section, which is 30 minutes.
As mentioned previously, caching your report is a great way to give end users a reasonable balance between having current data in the report and having them access reports faster than typical on-demand report execution.
Reporting Services also offers report snapshots that can be used as an alternative approach to caching. In concept, report snapshots and caching are used for a single purpose: delivering reports faster, while lowering on-demand execution costs. Report snapshots can be used for the following two purposes:
Creating report histories
Controlling report processing
Functionality-wise, report snapshots differ from a cached instance in several ways. The first, obvious, difference is that, in caching, you have full control over how often a cached instance should be invalidated (using an expiration schedule or cache refresh plan), but you certainly cannot control when the new cached instance kicks in. This is because cache refreshing depends on when the first request is received after a cached instance expires.
The report caching process lacks the ability to produce a persistent copy of the report from a specific point in time. Report snapshot can be run at a specified time regardless of user requests and can be placed into history without overwriting previous snapshots. Remember that when report execution is persisted, end users will have the ability to compare the report instances at various points in time. This is a very important feature and often a business requirement.
The following steps will walk you through creating a snapshot of your report:
Browse to the Documents document library.
Click the ECB menu, which appears to the right of the report title, and select Manage Parameters.
Change the default dates for the Start Date and End Date to be 1/1/2010 and 12/31/2010, then Click OK.
Again, click the ECB menu, and this time select Manage Processing Options.
From the Data Refresh Option section, select Use snapshot data option.
From Data Snapshot Options section, select Schedule Data Processing and then select On a custom schedule option.
Define a schedule that snapshots the report at 8:00 AM on day 30 of Mar, Jun, Sep, Dec, starting 3/1/2010 and ending 12/31/2010, as shown in Figure 13-90.
Click OK to get back to the Manage Processing Options page.
Click OK to enable snapshots for your report.
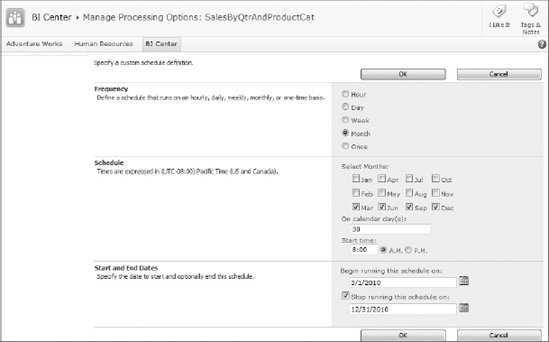
With the snapshot properly configured, on the specified dates an image of the report with the specified parameters is created and stored in the report history. You can see the snapshots taken by selecting View Report History from the same ECB menu.
Figure 13-91 shows the snapshot gallery for your report. As you can see, you can manually create snapshots too, by clicking on the New Snapshot button.
The schedule you defined in Step 7 is a bit different from the schedule you defined for cache refresh plans (see "Managing Cache Refresh Plans"). This schedule is for data processing, and it's independent from the report processing. The second difference between snapshots and caching is that in report caching you cache the data and report layout together. However, in snapshots, it's the data that can be retrieved in advance and stored as a snapshot, and when the report is actually viewed, everything is put together and returned to the end user. This makes snapshots a more lightweight report-processing option compared to caching.
The third difference is that rendering information is not tied to and stored with the snapshot. Instead, the final viewing format is adjusted based on what is appropriate for a user or an application requesting it. This functionality makes snapshots a much more portable solution. The fourth difference is that report snapshots offer less flexibility than report caching.
Snapshots are like pictures and lack interactivity to an extent. However, a cached report allows users to interact with the reports at the same level as on-demand report execution. For example, snapshots are always taken using the default parameter values (if applicable), and there is no way to change them afterward. This limitation forces you to create a different snapshot if you need to change the report parameters. Recall that, by using cache refresh plans, you can target multiple cached instances of the same report to different sets of parameters.
Figure 13-92 illustrates a snapshot report. Notice how the parameter input pane is disabled.
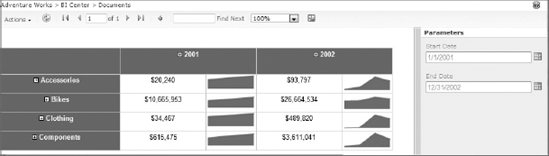
SharePoint lists provide lots of functionalities that are already baked into the core SharePoint platform, such as UI elements for managing data, versioning, workflows, and so on. The increasing adoption of SharePoint, along with the great out-of-the-box functionality that SharePoint lists offer, make SharePoint lists a popular choice for storing data.
Whether it makes sense to store your data in SharePoint lists or not is a discussion for another time and place (it's not one solution fits all). In reality, however, organizations often have their data stored in various structured and unstructured data stores, including SharePoint lists.
With the advent of Business Connectivity Services and External Content Types in SharePoint 2010, the data in SharePoint lists comes from new places and no longer does all that data come in from users manually entering it. Instead you are accessing live business data through SharePoint.
No matter how that data is pumped into a SharePoint list, the raw data doesn't have any special meaning by itself. It has to be sliced and diced, sorted, filtered, aggregated, and ultimately formatted to make a point. In general, this is referred to as reporting.
In the previous version of SharePoint, you could create relationships between lists using the lookup field, but there is no easy way to enforce relationship behavior. Moreover, joining lists and aggregating, sorting, and formatting data can quickly become serious bottlenecks. Without the ability to perform such basic operations, reporting on SharePoint data has been challenging for quite a while.
Microsoft elected to take the relational behavior of lists to the next level in SharePoint 2010, by supporting referential integrity (Cascade Delete or Restrict Delete) in list schemas. The new model helps in maintaining the organized form of data and ensures that any reporting you do on such lists is accurate.
Limitations on queries against large SharePoint lists still do exist in SharePoint 2010, but this time around farm administrators have more control over how and when the queries can be executed. For example, administrators can set up query throttling to prevent queries from returning too many rows during peak business hours. If you browse to the Central Administration site and then click Application Management
Sure enough, an administrator can set up happy hours in which large queries can be run, for example, starting 10 PM for 2 hours (see the second highlighted section of Figure 13-93).
But, what if you need a report during business hours and the query in that report exceeds the default list view threshold?
In the following sections, you will create two reports using Reporting Services 2008 R2 and Access 2010 against a sample SharePoint list. The goal is to learn how to report against SharePoint data, while minimizing the effect of list-throttling restrictions imposed by the farm settings.
Before going any further on reporting against SharePoint list data, it makes sense to switch gears here and create a SharePoint list called "Sales Order Numbers" that stores some sales numbers. This is the sample list that will be used in the rest of this chapter.
To create this list in the BI Center, follow these steps:
Browse to Site Actions
Click Create.
On the Create dialog, select List category, and then click Custom List template.
In the Title textbox, enter SalesOrderNumbers, and press the Create button.
Open the SQL Server Management Studio, and execute the following query in to get some sample sales numbers.
SELECT TOP 10
      [SalesOrderNumber]
FROM [AdventureWorks].[Sales].[SalesOrderHeader]
Select all the returned records and copy them to the clipboard, as shown in Figure 13-94.
Browse to the SalesOrderNumbers list, and click Datasheet View in the Ribbon, as shown in Figure 13-95.
Paste the content in the clipboard into the datasheet.
Switch back to the Standard View.
In SQL Server Reporting Services 2008 R2, Microsoft shipped a new SharePoint List data extension that allows querying against SharePoint list in both BIDS and Report Builder out of the box.
The process of creating SSRS reports against a SharePoint list is very similar to the process explained in the "Authoring Reports" section earlier in this chapter, and it won't be covered in this section. However, there are a few things that need to be highlighted here.
When creating your datasource, make sure that you specify the Type as Microsoft SharePoint List and set a fully qualified URL reference to the BI Center site that contains the SalesOrderNumbers list, as shown in Figure 13-96.
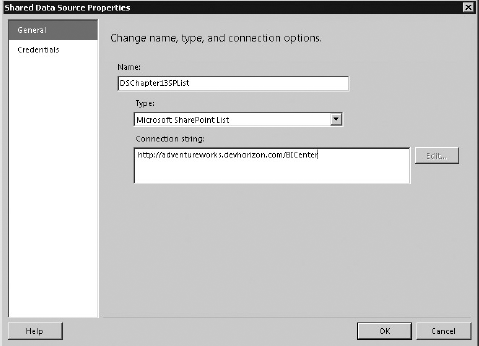
Previously in SSRS 2008, you needed to specify the Type as XML and set a web reference to the GetListItems method of the lists.asmx web service and pass in the name of the list as parameter.
Another point to consider here is specifying a valid authentication type in the Credentials tab. By default, the authentication is set to use the Do not use credentials option and this will cause an error when you create your dataset later if it's changed here.
In addition to SharePoint List data extension, SQL Server Reporting Services 2008 R2 ships with Query Designer support for both Report Builder and BIDS. Once the datasource is properly set up, you can create a dataset and use the Query Designer to extract the rows from the SalesOrderNumbers list, as illustrated in Figure 13-97.
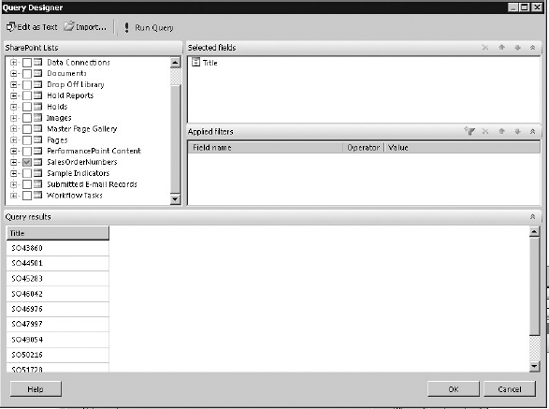
After the report is developed in BIDS, it can be deployed and displayed on a SharePoint page using a Report Viewer web part, as illustrated in Figure 13-98.
Now, how can Reporting Services help you to get around list throttling?
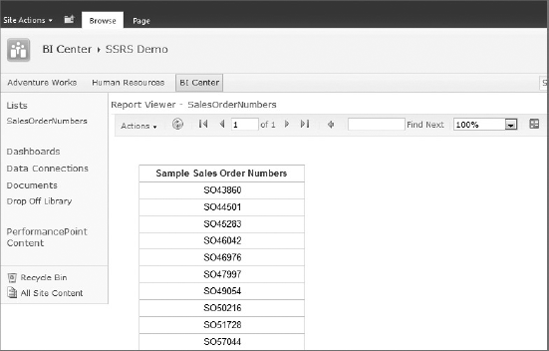
The list you set up in this section contains only 10 rows. In real-life scenarios where the list contains more records than the list view threshold, you can make a snapshot of the report during happy hours when the resource throttling restriction is not imposed, and render its snapshot in the Report Viewer web part during business hours. For more information, see the "Snapshots" section.
Note
This report can be found in the code download for this book, in the Chapter 13 .zip file. It is called SalesOrderNumbers.rdl.
Another way to report on SharePoint data is by using Access 2010 and Access Services. Access Services is a service application, and it's only available in the enterprise edition of SharePoint Server 2010. In addition to being an enterprise feature, Access Services uses Reporting Services 2008 R2 as its reporting engine. This means that a prerequisite for running Access Services reports in SharePoint is the installation of the Microsoft SQL Server 2008 R2 Reporting Services add-in and setting up the integration in local mode at a minimum.
Once you have installed the add-in and created a new Access Services service application in your farm, Access reports work in pretty much the same way they would in connected mode, as you have seen throughout this chapter.
There are three compelling reasons why you should be considering Access as a reporting solution for reporting on SharePoint data. First, the Access 2010 client application comes with a powerful query engine that can perform many different types of queries such as joins, filtering, aggregates, and master-child and parent-child relationships between SharePoint lists, that otherwise would be challenging to create and often require considerable custom coding. Second, the Access 2010 client has a flexible Report Designer environment that enables you to quickly and easily develop customized reports (.rdl files) and publish them to SharePoint. Third, Access Services 2010 offers a caching layer that addresses the limitations of the maximum number of list items that a query can return at one time (List View Threshold), as discussed earlier in this section.
In this section, you will create an Access report that queries the SalesOrderNumbers list. To do this, follow these steps:
Start Microsoft Access 2010.
From the available templates, select Blank database and name the database.
Click Create button.
Right-click Table1 and close it.
From the External Data tab, click More and select the SharePoint List option in the drop-down list, as shown in Figure 13-99.
In the first screen of the wizard, enter the URL of the BI Center site and select Link to the datasource by creating a linked table option, as shown in Figure 13-100.
When you select this option, Access establishes a link to any lists that will be selected in the next section, instead of pulling their data into Access in one or more tables. The link goes both ways, meaning that if you modify the content in Access table, it will be synched up with the list and vice versa.
Select the SalesOrderNumbers custom list from which you want to pull data into Access and click OK. Note that if you want to construct joins between lists, you need to select them in this step of the wizard.
To create a query against the linked list, from the Create tab select Design Query.
In the Show Table dialog, click the Add button to add the SalesOrderNumbers table to the query design surface.
Double-click the Title field to include the selected fields for the query, as illustrated in Figure 13-101.
Right-click the Query tab, and select Datasheet View to preview the list data.
Click the Save button in the Quick Access toolbar. At this point, there should be two objects in your Access database.
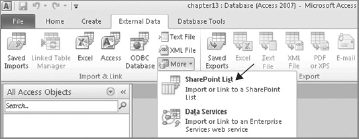
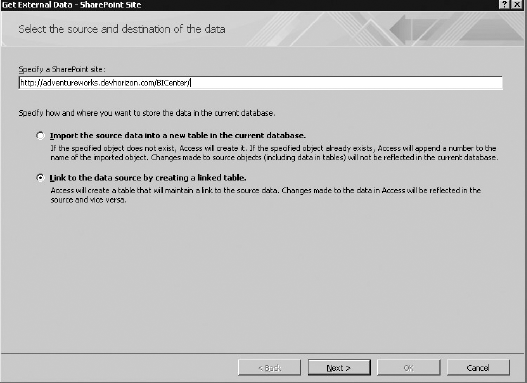
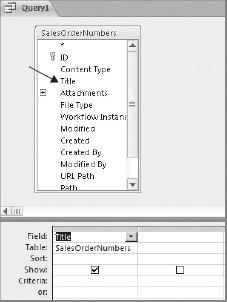
Now that you have the list data all linked up to the Access, the next logical step would be to report on this data.
Creating the report from the SalesOrderNumbers table requires simply one button click. All you need to do is to go to the Create tab in the Ribbon and click Report to generate the report shown in Figure 13-102. Click Save to save the new report. Of course, you need to do some customization to make the report look more professional.
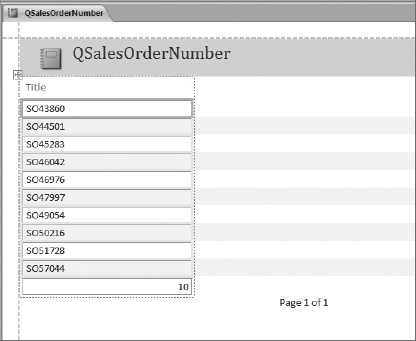
With the new report generated from the SharePoint list, you are now ready to publish the Access database to SharePoint and make the report available in the browser. To publish the Access database, go to the Backstage and from the File Types billboard select Publish to Access Services. Next, on the Access Services Overview pane, enter the URL of Access Services and the site on which you want this database to be made available. In this example, the site is a subsite of the BI Center, as shown in Figure 13-103.
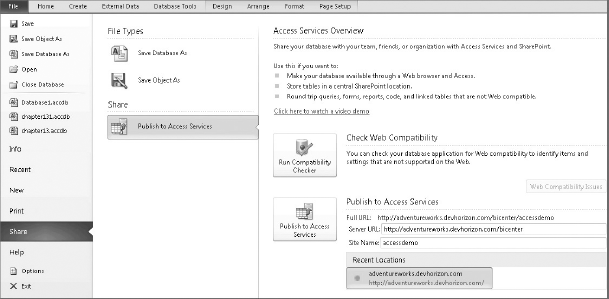
Once you are done, click Publish to Access Services; that's it!
Now you should be able to browse to the site by clicking the link in the confirmation page. Your Access workspace should look like the one shown in Figure 13-104. Now, you click the report, and you should get the exact same report you saw in Figure 13-98.
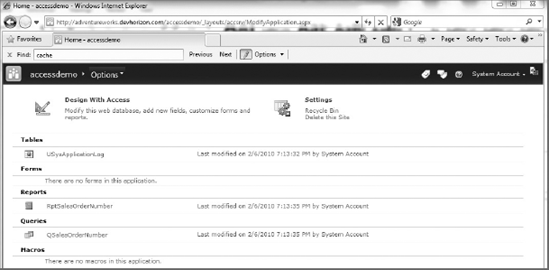
In SharePoint Server 2010, there are some important developments related to authentication and authorization, which affect all the services running on the top of the new platform. These changes are particularly important for BI solutions deployed to SharePoint and when SharePoint plays the role of a middle man in accessing the backend data. Perhaps the most important impact is how claims-based identity has been plugged into the SharePoint authentication and authorization semantics through a new service called Security Token Service (STS).
In SharePoint 2010, when a user authenticates to a claims-aware web application, regardless of identity system or authentication type, a claims identity is issued by STS and then it's translated into an SPUser object. This identity is issued based on the standard protocols (SAML, WS-Trust, and WS-Federation) and works with any corporate identity system, such as Active Directory, WebSSO, Live ID, LDAP, SQL, or Custom. Without any special configuration, the claims identity flows along with the request through the server tiers (service applications) in a SharePoint farm.
In terms of the authorization semantics, things haven't changed much in SharePoint 2010, with one exception. Now you can authorize access to resources over a lot more attributes. Additionally, during the authentication process, you have a chance to call into the claim provider APIs and augment the existing claims for handling your own custom authorization scenarios. For more information, see the official documentation at www.devhorizon.com/go/23.
Now the question is does the new claims authentication in SharePoint 2010 mean that all the double hop issues are resolved? The answer is certainly no!
Service application infrastructure in SharePoint Server 2010 is claims-aware, but many external datasources are still not claims-aware. There are many scenarios where claims cannot be used. In the following list, you will find a number of them:
Scenario 1: In this scenario, an Excel workbook or PerformancePoint scorecard is used against an Analysis Services cube which has role-based security (i.e., every role has its own view of the data). This will require Windows authentication for Analysis Services and, thus, a way to pass the identity for every user from SharePoint to Analysis Services. SQL Server Analysis Services is not claims-aware and has no idea who or what the SharePoint user is. In order to implement this, you either need to configure Kerberos or the unattended service account and add an authenticated username in the connection string.
Scenario 2: Frontend web servers, the Excel Calculation Services application, and the SharePoint database servers run on different computers. In this scenario, if Excel Calculation Services are opening workbooks stored in SharePoint content databases, you should use Kerberos or the unattended account.
Scenario 3: In this scenario, Excel Calculation Services is opening a workbook from non–Microsoft SharePoint Foundation trusted file locations, such as UNC shares or HTTP websites. The authentication method used in this scenario is either to use impersonation or process an account, as seen in Figure 13-105.
Scenario 4: A very common scenario in which Kerberos is needed is when there are multiple machine hops from mid-tier to the last datasource, as shown in Figure 13-106. Remember, the minute an identity leaves the boundary of the Service Application tier, the claims identity may no longer be meaningful if a datasource doesn't understand the compliant SAML protocol.
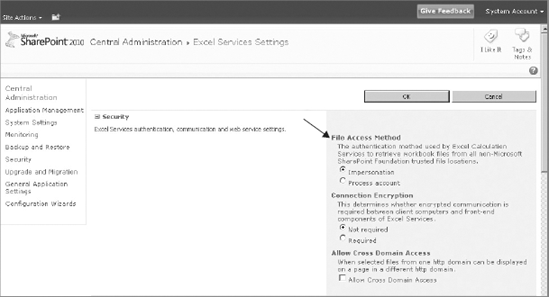
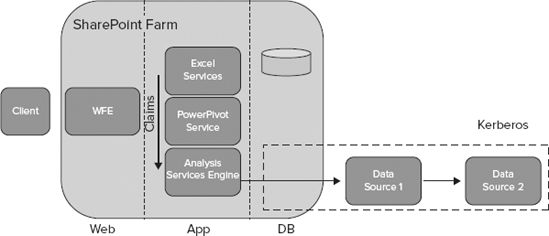
The scenario depicted in Figure 13-107 shows how the combination of claims and the unattended account can help you properly authenticate to the backend datasource. In this scenario, the claims identity flows between multiple service applications, and the Analysis Services engine impersonates the unattended account to connect to the external datasource.
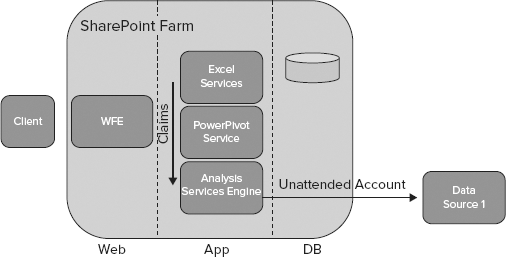
In SharePoint Server 2010, BI is a very important topic and another area with significant enhancements. Even if you are a seasonal SharePoint developer, the chances are you are not very familiar with BI concepts, so the chapter started out by explaining some of the must-know BI terms and concepts.
The power of the BI template that ships out of the box with the Enterprise Edition of SharePoint 2010 hopefully came out in this chapter. The idea of using this template is to help you quickly and easily create a BI-focused SharePoint site that will make others think you spent hours putting it all together, so just use it!
This chapter introduced two of the most important BI service applications in SharePoint Server 2010: Excel Services and PerformancePoint Services. In the Excel Services section, you learned in particular how to import data into an Excel workbook, slice and dice it, and visualize and display it in a PivotTable and PivotChart. In the PerformancePoint section, you were introduced to a very common confusion in the BI world, that between the dashboard and scorecard. Hopefully, you walked away learning that, at the end of the day, they're all the same. Both scorecards and dashboards are used to monitor performance and make sure that the business is on the right track toward a set of predefined goals.
In the Reporting Services section, you learned not only how to build and deploy reports to a SharePoint site configured in connected mode, but also techniques such as caching and snapshots. These operations have the advantage of being scheduled and running in the background, giving you greater control over when and how report execution should occur. The goal is to enhance the performance of report execution and the user experience when viewing reports.
At the end of the chapter, you had a brief overview of two techniques used to query SharePoint lists: Reporting Services and Access Services. Although we didn't go into much detail, the core message was that both Reporting Services reports (with the snapshot feature) and Access reports can help you minimize the performance effects of reporting against large lists.
When you put together all the pieces presented in this chapter, you have a powerful array of options for building BI solutions that will address critical business needs.