
- Dedication
- A Note Regarding Supplemental Files
- Foreword
- Preface
- 1. Hello, MapPoint!
- I. MapPoint 2004
- 2. Programming with MapPoint 2004
- 2.1. The MapPoint 2004 Object Model
- 2.2. Programming with MapPoint 2004 API
- 2.2.1. Adding MapPoint 2004 References Using Visual Studio .NET
- 2.2.2. Adding MapPoint 2004 References Using TlbImp.EXE
- 2.2.3. Finding a Place
- 2.2.4. Finding an Address
- 2.2.5. Finding Both Places and Addresses
- 2.2.6. One UI Finds All
- 2.2.7. Finding Points of Interest Around a Location
- 2.2.8. Calculating Distance Between Two Locations
- 2.3. Programming the MapPoint ActiveX Control
- 2.4. Cleaning Up After You’re Done
- 2.5. Dealing with Latitude and Longitude
- 2.6. Routing in MapPoint 2004
- 2.7. Where Are We?
- 3. Working with Data in MapPoint 2004
- 3.1. Understanding the MapPoint 2004 Data API
- 3.2. Understanding Data Maps
- 3.3. Working with MapPoint Demographic Data
- 3.4. Working with Your Business Data
- 3.4.1. Importing External Data
- 3.4.1.1. Understanding the DataSets.ImportData method
- 3.4.1.2. Importing data from a text file
- 3.4.1.3. Helping MapPoint understand your text data
- 3.4.1.4. Displaying Data Maps using your data and demographic data
- 3.4.1.5. Importing Data from Microsoft Excel
- 3.4.1.6. Importing data from Microsoft Access
- 3.4.1.7. Importing data from SQL Server 2000
- 3.4.1. Importing External Data
- 3.5. Querying a MapPoint DataSet
- 3.6. Working with Shapes
- 3.7. Working with Territories
- 3.8. Where Are We?
- 4. Advanced MapPoint 2004 Programming
- 4.1. Interfacing MapPoint 2004 with a GPS Device
- 4.1.1. GPS Basics
- 4.1.2. Understanding NMEA GPS Sentences
- 4.1.3. Parsing NMEA Sentences
- 4.1.4. Fields in the Fixed Data Sentence
- 4.1.5. Fields in the Position and Time Sentence
- 4.1.6. Converting NMEA Values
- 4.1.7. Converting Latitude and Longitude Information
- 4.1.8. Converting the Speed Information
- 4.1.9. Converting the Bearing Information
- 4.1.10. Converting the UTC Time Information
- 4.1.11. Communicating with a GPS device
- 4.1.12. Event-Based Architecture for Reading GPS Sentences
- 4.1.13. How to Use the Sample API in Your Applications
- 4.1.14. Displaying GPS Sentences Using MapPoint 2004
- 4.1.15. Centering the Map on the Current Location
- 4.2. Integrating Your Applications with MapPoint 2004
- 4.3. Performance Considerations
- 4.4. Where Are We?
- 4.1. Interfacing MapPoint 2004 with a GPS Device
- 2. Programming with MapPoint 2004
- II. MapPoint Web Service
- 5. Programming MapPoint Web Service
- 6. MapPoint Web Service Find APIs
- 6.1. Understanding Find APIs
- 6.2. Understanding Entities and Entity Relationships
- 6.3. Data Sources and Countries/Regions
- 6.4. Working with Find Methods
- 6.5. Asynchronous Programming with Find Service
- 6.6. Optimizing Find Call Performance
- 6.7. Globalizing Find
- 6.8. Where Are We?
- 7. MapPoint Web Service Route APIs
- 8. MapPoint Web Service Render APIs
- III. MapPoint Location Server
- 9. Programming Microsoft Location Server
- 9.1. Microsoft Location Server Terminology
- 9.2. How Does Location Server Work?
- 9.3. Microsoft Location Server Architecture
- 9.4. Installing the Location Server
- 9.5. Accessing the Location Service APIs
- 9.6. Accessing the Location Server APIs
- 9.7. Microsoft Location Server Supported Providers
- 9.8. Where Are We?
- 10. Programming with Location Server APIs
- 10.1. Programming with Location Server Web Service
- 10.2. Programming with the Location Server Management API
- 10.3. Comparing Location Server API to Location Web Service API
- 10.4. Where Are We?
- 9. Programming Microsoft Location Server
- IV. MSN Virtual Earth
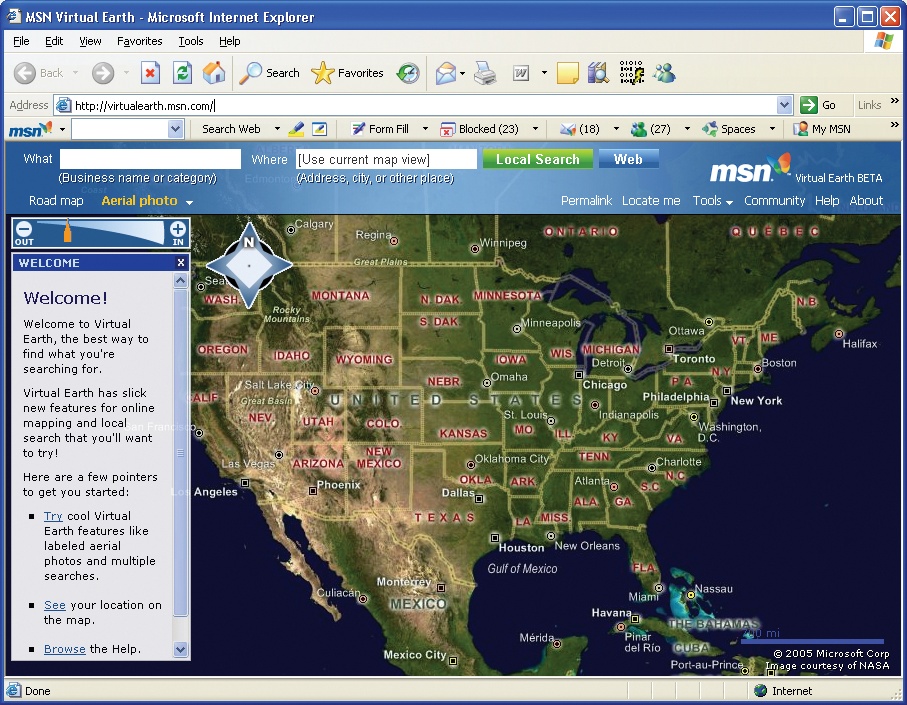
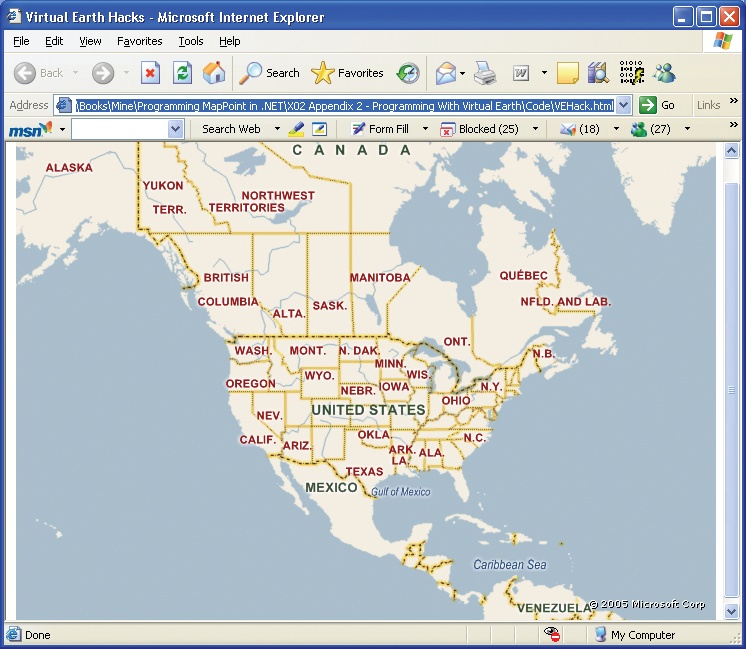
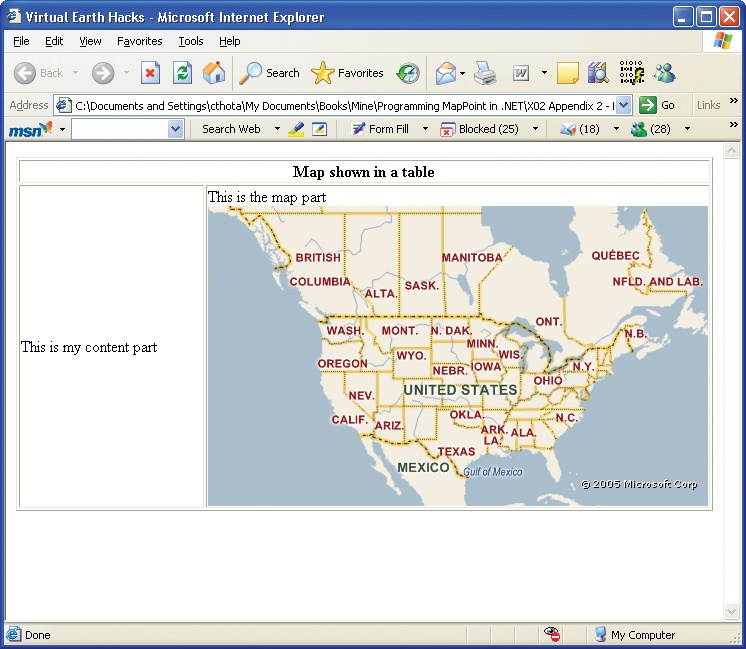
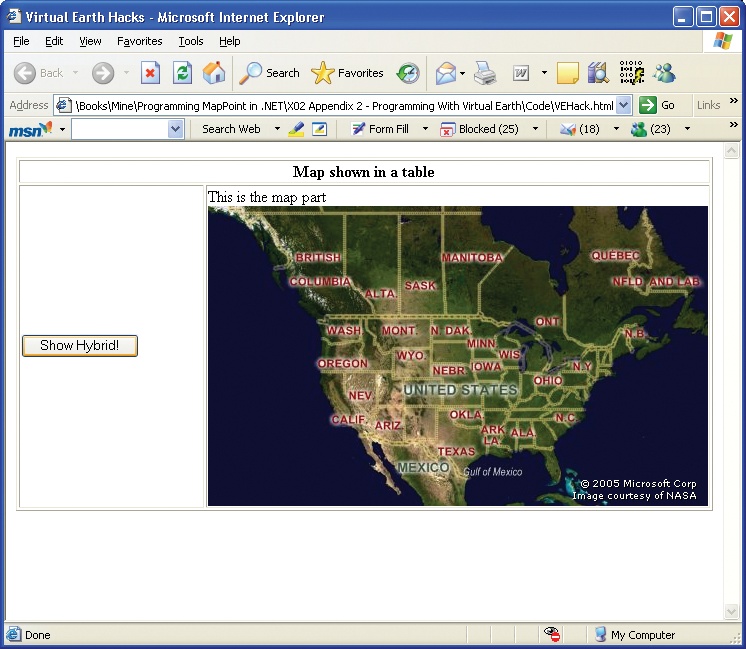
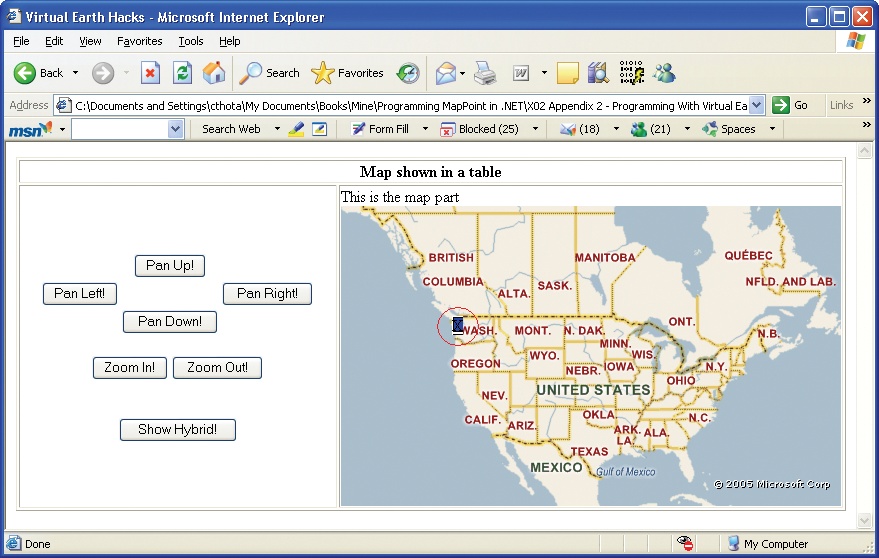
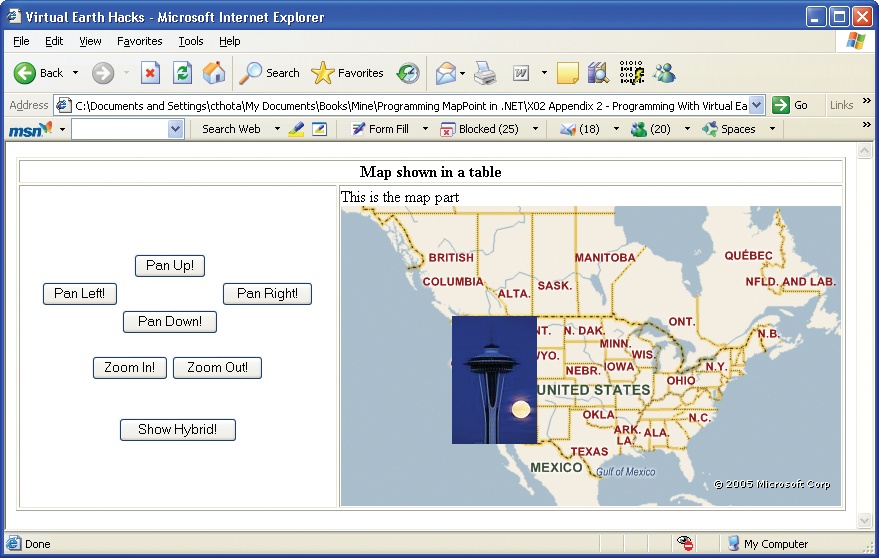
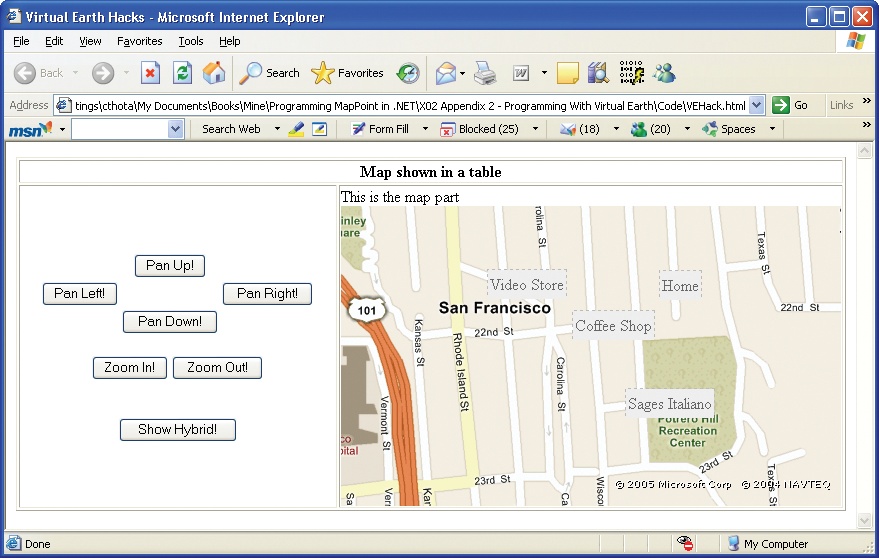
- 11. Programming with Virtual Earth
- A. Managing Your Data on MapPoint’s Customer Services Site
- A.1. Using the MapPoint Customer Services Site
- A.2. Using Customer Data Web Service
- A.2.1. A Look at Customer Data Service APIs
- A.2.1.1. Uploading data using Customer Data Service
- A.2.1.2. Polling for an upload job status
- A.2.1.3. Downloading data using Customer Data Service
- D. Maps
- About the Author
- Colophon
- Copyright
- A.2.1. A Look at Customer Data Service APIs
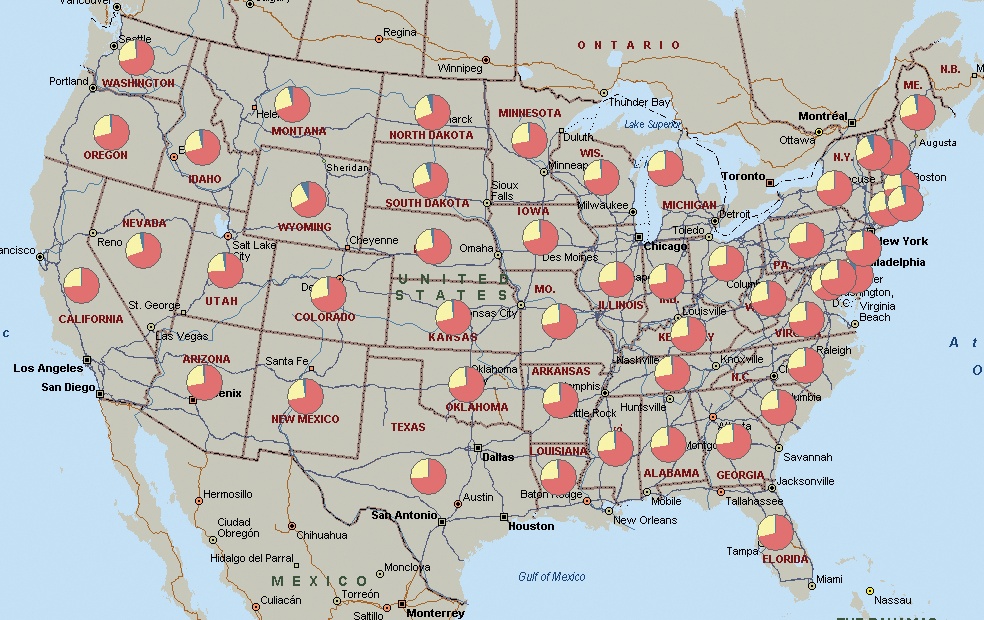
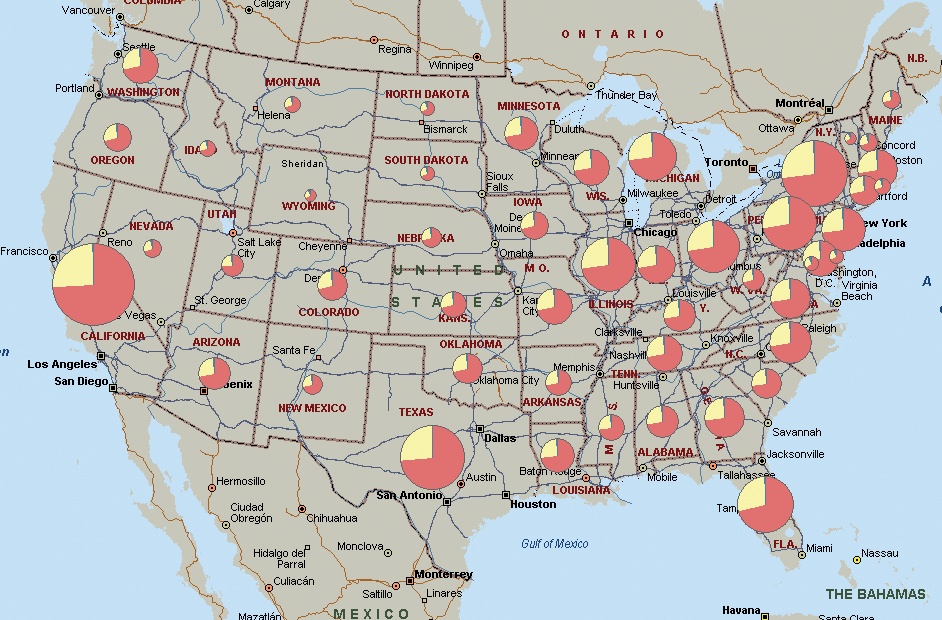
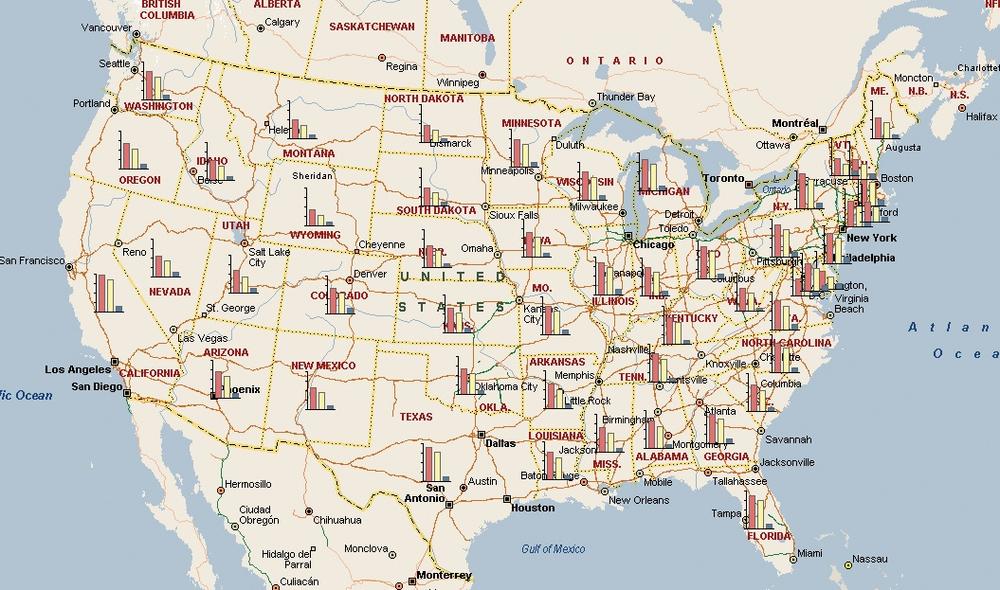
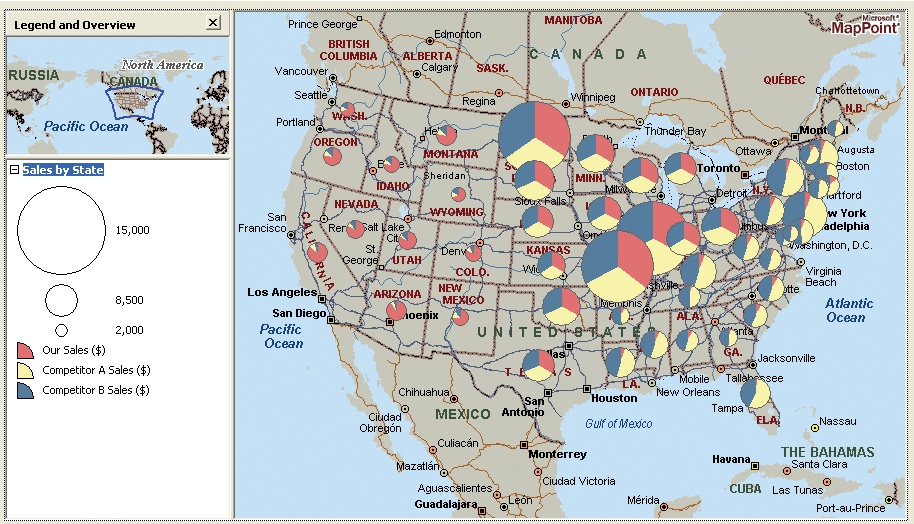
Appendix D. Maps


-
No Comment
..................Content has been hidden....................
You can't read the all page of ebook, please click here login for view all page.