
Chapter 3. Working with Data in MapPoint 2004
MapPoint 2004 can process, analyze, and display business data based on location, and it can then create demographic maps, thematic maps, territories, time zone maps, and shapes on maps. MapPoint 2004 ships with extensive built-in demographic data and a set of APIs to import, analyze, and display your business data from variety of sources.
This chapter has three major sections that correspond to the common tasks of working with:
MapPoint demographic data
Your own data
Shapes on maps
I will assume that you are familiar with the basic MapPoint 2004 programming model (if not, refer to Chapter 2 of this book). The sample data and code used in this chapter is available in the book’s companion material in the Chapter03 directory.
Understanding the MapPoint 2004 Data API
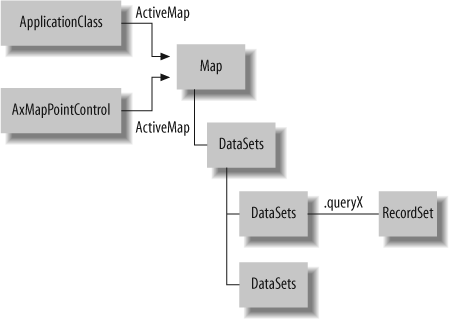
In MapPoint 2004, both business data and demographic
data are represented using the DataSet class. An active Map object exposes the DataSets collection, which you use to access
a valid DataSet object. How does a
DataSets collection get its data
wrapped as a DataSet object? The
DataSets collection is different
from traditional .NET collections—it not only exposes a collection of
DataSet objects, but it also offers
methods to import external data and to access MapPoint 2004
demographic data.
A DataSet object is similar
to a data table with rows and columns and regular querying
capabilities. However, a DataSet
object allows you to query the records or data rows based on location
information. Each query results in a Recordset object containing the records that
satisfy the location-based query. The DataSet object can also be used to display
data on maps. In essence, if you are using any data features (such as
data maps, territories, etc.) in MapPoint 2004 APIs, the DataSet class is the root for all these
tasks; Figure 3-1 shows
the relationships between an active Map object, a DataSets collection, a DataSet object, and a Recordset object.
Tip
It is important to note that the DataSet and RecordSet objects shown in the MapPoint
object model are different from the Dataset and RecordSet classes defined in the System.Data namespace in the .NET
Framework.
Tables 3-1 and
3-2 show some of the key
methods exposed on the DataSet and
RecordSet objects.
Method Name | Description |
| Displays a set of data on a map |
| Returns all records in a |
| Returns records that fall within a
specified shape on the map as a |
| Zooms to the best map view of the
specified |
Method Name | Description |
| Sets the current record of the
|
| Sets the current record of the
|
With this introduction, let’s look at specifics of dealing with visualization of data using MapPoint 2004.
Understanding Data Maps
Imagine this: if you had a table of data that contained population count and area in square miles per state, and a map of the United States with states color-coded with corresponding population densities, on which one would it be easier to spot the state with the highest population density? Visualizing statistical data on maps makes grasping the key statistics more intuitive, especially if they are based on location.
MapPoint 2004 supports data visualization on maps through its data APIs. You can display data
maps using either native MapPoint demographic data or an
external data source such as a text file, Excel spreadsheet, or even a
SQL Server database. In MapPoint 2004, a data map is represented with
a DataMap class. A DataMap object can only be created using a
DataSet object by calling the
DisplayDataMap method. The
resulting map displays data on the current active map of the MapPoint
ActiveX Control or the ApplicationClass object and returns a
DataMap instance. The DataMap object exposes a set of read-only
properties that define the data map’s behavior. The only property for
which you can set a value is the LegendTitle property, used in the legend
pane.
Before we get into coding details of data maps, there are a
couple of details that you need to know: what data map styles (also
known as data map types) are, and how to use the DataSet.DisplayDataMap method.
Understanding Data Map Styles
MapPoint 2004 supports three broad categories of data map styles:
Location data map
Single item data map
Multiple items data map
Each category is appropriate for a different set of uses.
Location data map
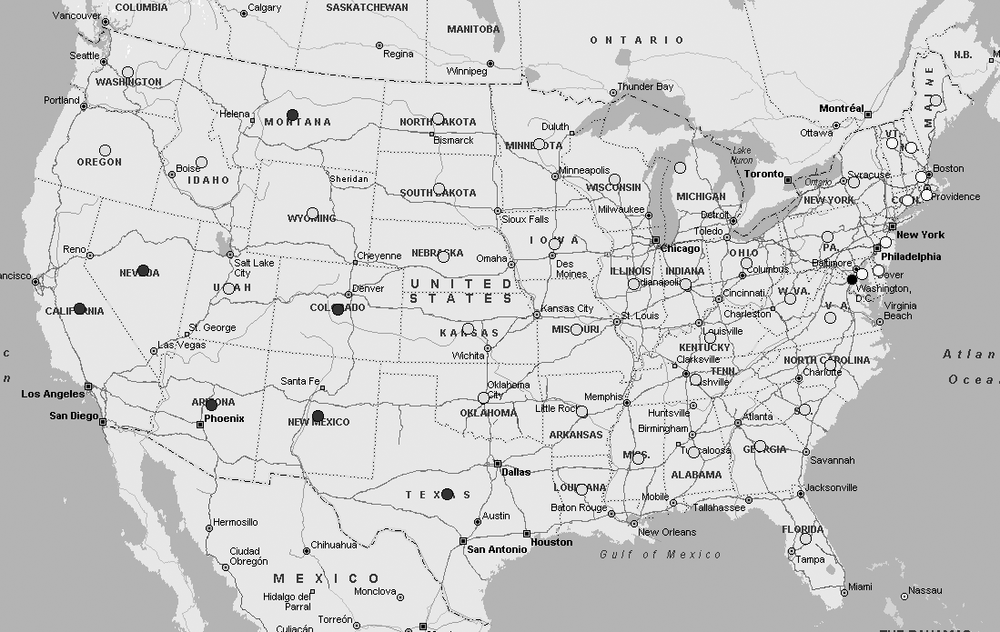
This data map style should be used when you want to display only locations and have no data associated with them. For example, if you want to display your company’s retail store locations in the United States, use a location data map. In this data map style, there are two display options to represent locations on maps:
- Pushpin maps
Use standard MapPoint 2004 pushpins or custom pushpins to represent each location. For example, locations such as a coffee shop, your office, and your home will be shown using one pushpin type.
- Multiple symbol maps
Use different symbols to represent each location. For example, locations such as a coffee shop, your office, and your home are marked with different pushpins for easy identification.
Single-item data map
This data map style should be used when you have a single data item associated with each location that you want displayed on a map (or when you have multiple data items but want to display only one on the map). For example, to display the annual sales for each retail store in the United States, use a single-item data map. In a single item data map, each location has an associated data item. In this category, you have four display options:
- Shaded area maps
In this map style, shown in Figure 3-2, varying map shades and colors represent the data associated with each location. This map style is useful for displaying data for larger areas, such as states, countries, and Zip Codes. In this map style, a lighter shade represents a lower value, and a darker shade represents a higher value. For example, if you use the shaded area map style to represent annual sales amounts per state for retail stores, all states that have a lighter shade represent poorly-performing stores, and all states that have a darker shade represent the stores that are performing well in sales.
- Shaded circle maps
In this map style, similar to the shaded area map style, varying map shades represent the data associated with each location. Since each location is represented as a circle, this map style is suited only for point locations such as cities or addresses. In this map style, shown in Figure 3-3, all circles are the same size, and the shade of the circle represents the data value; lighter shades mean lower values, while darker shades mean higher values. This map style is suitable if you want to display annual sales per store.
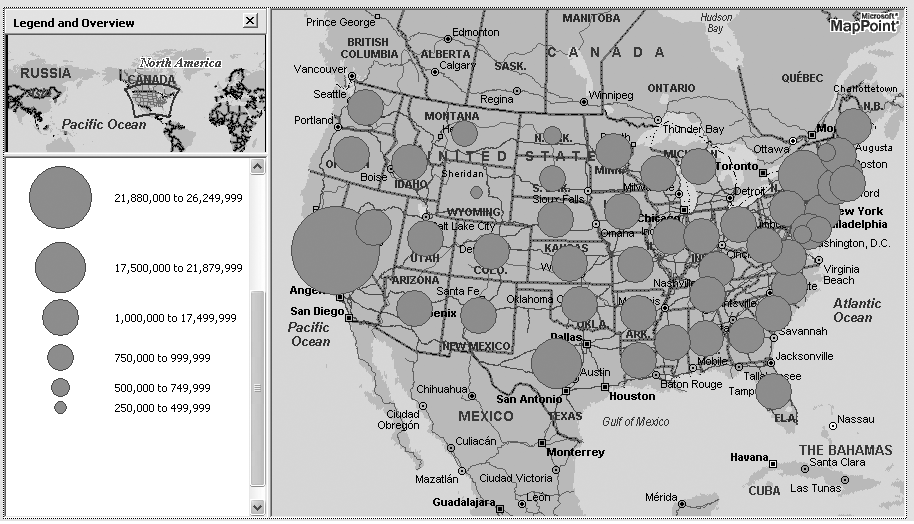
- Sized circle maps
In this map style, shown in Figure 3-4, varying circle size represents the data associated with each location. This map style is useful when displaying data for medium to large locations, such as a city, county, state, or Zip Code. In this map style, the circle’s size represents the data associated with that location. For example, if you use the sized circle map style to represent annual sales amounts per state for your retail stores, states with smaller circles represent poorly-performing stores, and states with bigger circles represent the stores that are performing well in sales.
- Multiple symbol maps
In this map style, shown in Figure 3-5, multiple symbols represent locations, and different colors represent ranges of value associated with each location. For example, you could use the multiple symbol map style to display annual sales of your retail stores by using green to represent top sales range (say, >$10 million), orange to represent medium sales range (say, from $5 million to $10million), and red to represent poor sales range (say, from $1 million to $5 million).
In all these map styles, there is only one dimension being analyzed based on location (for example, retail store sales). But what map styles would you use to display both your sales and your competitor’s sales based on location? This situation is when you need multiple item data maps .
Multiple item data map
In multiple item data maps, you display two or more items based on location. For example, you could display your sales and your competitor’s sales per state to understand how you are performing against your competitor, or you could display your sales and average spending per state to verify whether you are targeting the right market segments. So, in a multiple item data map, there are two or more pieces of information associated with each location. Again, in this category, there are different map styles that come to our rescue to represent multiple values for each location:
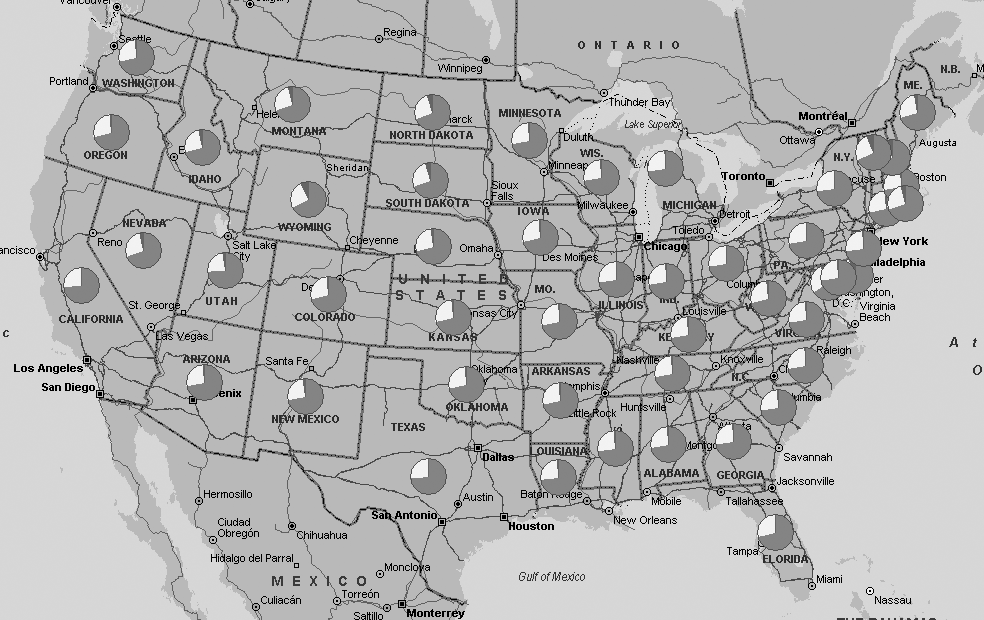
- Pie chart map
The pie chart map style, shown in Figure 3-6, is good for displaying multiple data items for each location. The maximum number of data items that can be displayed for each location is 16. Each data item’s value is represented by the size of the pie for each location. Use this map style to display sales by product line for your retail stores.
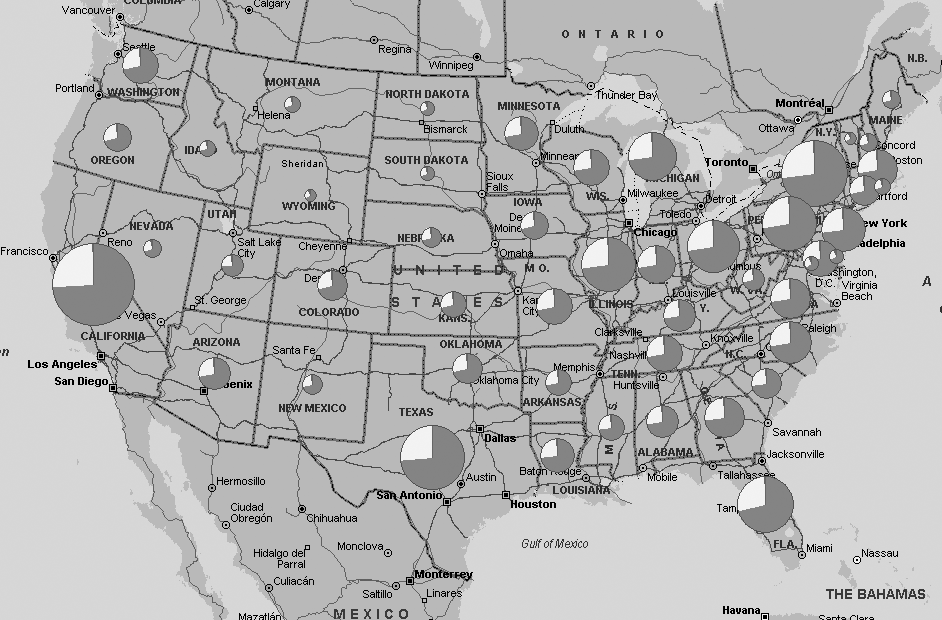
- Sized pie chart map
The sized pie chart map style, shown in Figure 3-7, is similar to the pie chart map style except that the size of the pie chart represents the overall value of the data items associated with that location. For example, to see how your sales are doing against your competitor’s sales per state as a pie chart, and also to get a sense of overall sales (yours and your competitor’s combined) for each state, use this map style. In this figure, a bigger pie chart represents higher overall sales, while a smaller pie chart represents poorer overall sales.
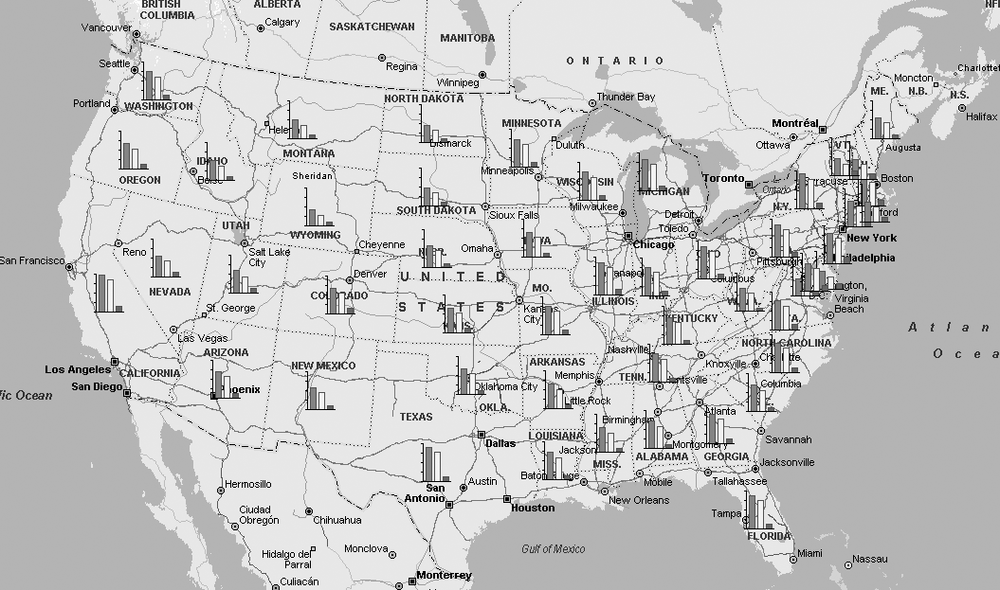
- Column chart map
In this map style, shown in Figure 3-8, each data item associated with a location is represented by a column. The size of the column represents the value, so the taller the column, the higher the value. You can also assign different colors to each column. For example, to display your sales against your competitor’s sales, use a column chart map style. The maximum number of data items that can be associated with a location is 16.
- Series column chart map
This map style, shown in Figure 3-9, is identical to column chart map style but all columns are of the same color. This map style is more suitable for representing a series of data. For example, presenting your store sales per month per state is more suited for series column chart map style . This map style also supports associating up to 16 data items per location.
Now that we know what data map styles are and what they are
well-suited for, let’s look at the DataSet.DisplayDataMap method used to
display a data map.
Understanding the DataSet.DisplayDataMap Method
The DisplayDataMap
method is called on a valid DataSet object to display a map using the
data in the dataset. This method provides a lot of flexibility and
control to choose from a wide variety of parameters for data maps,
but this flexibility comes with a penalty—complexity.
It is not an exaggeration to say that the DataSet object’s DisplayDataMap method is one of the most
complex methods available with the MapPoint 2004 APIs because of
both the complex inner workings of the method and the sheer number
of arguments that it accepts. See the following code snippet of the
DisplayDataMap method:
    //Invoke DisplayDatamap method
    MapPoint.DataMap datamap =
        dataset.DisplayDataMap(MapPoint.GeoDataMapType.geoDataMapTypeCategoricalColumn,
                              datafields,
                              MapPoint.GeoShowDataBy.geoShowByRegion1,
                              MapPoint.GeoCombineDataBy.geoCombineByNone,
                              MapPoint.GeoDataRangeType.geoRangeTypeDefault,
                              MapPoint.GeoDataRangeOrder.geoRangeOrderDefault,
                              6,
                              5,
                              arrayOfCustomValues,
                              arrayOfcustomNames,
                              missing,
                              arrayOfcustomLabels,
                              missing );
The DisplayDataMap method
takes 13 arguments to display a data map; look at the original
definition of the DisplayDataMap
method signature to understand what each parameter represents in the
previous method call:
    DataSet.DisplayDataMap([DataMapType],
                           [DataField],
                           [ShowDataBy],
                           [CombineDataBy],
                           [DataRangeType],
                           [DataRangeOrder],
                           [ColorScheme],
                           [DataRangeCount],
                           [ArrayOfCustomValues],
                           [ArrayOfCustomNames],
                           [DivideByField],
                           [ArrayOfDataFieldLabels],
                           [ArrayOfPushpinSymbols])
Table 3-3 shows how each parameter is used during this method call.
If you are worried about how to remember all this, thankfully, it is possible to categorize these arguments into one argument and two major categories, as follows:
    dataset.DisplayDataMap(Data map style,
                          [Data Specification],
    [Range Specification]);
Let’s discuss this method in detail by starting off with a hypothetical scenario: say your requirement is to display your average annual sales for each product line compared to your competitor’s. A hypothetical display data map command (like in SQL) would look like this:
Display a pie chart data map per state for our annual sales (per product line) compared to our competitor’s annual sales per product line.
Also, let’s assume that you have data in a table with the schema shown in Table 3-4.
County | Our annual sales | Competitor’s annual sales | Total product lines lold | ............. |
Pierce | 34,561,775 | 11,701,483 | 20 | .............. |
King | 22,456,333 | 16,995,443 | 18 | .............. |
.............. | .............. | .............. | .............. | .............. |
Note that your data is categorized based on county and not on
state, but the requirement is to display a data map based on states.
Next, let’s look at the DisplayDataMap method to display the data
map specified in this hypothetical command.
Defining data map style
This is the first step in displaying a data map.
Choose the map style for the data map using the DataMapType argument. This argument is
GeoDataMapType enumeration, and
you can choose among the nine available map styles. Setting it to
geoDataMapTypeDefault allows
MapPoint 2004 to decide what map is best suited for the input data
and other factors. In our example, we wanted a pie chart map, so
set this to geoDataMapTypeUnsizedPie enumeration
value.
The portion of the hypothetical display data map command completed so far:
Display a pie chart data map...
Next, let’s look at the data specification arguments category, which you use to actually specify which data will be be displayed on the map and how to manipulate or process it on the fly before displaying it.
Specifying Data Detail
In this category, the following arguments are used to specify the data and how to process the data before displaying it on a data map. Let’s look each of these arguments in detail:
DataFieldIndicates field name or names to be displayed as a data map. The field values can be numeric or non-numeric, but they should be linked to a location dimension. This argument is of object type, so you can pass either a string or an array of strings depending on the requirement. In our example, we want to display your company’s sales and your competitor’s annual sales, so that would be two named columns, Our Annual Sales and Competitor Annual Sales from Table 3-1.
The portion of the hypothetical display data map command completed so far:
Display a pie chart data map per state for our annual sales compared to our competitor’s annual sales...
ShowDataBySpecifies which location dimension you are applying to your data to display a data map. In other words, indicates whether you want to display your data map based on a city, state, country, and so on. This argument is of type
GeoShowDataBy, which is an enumeration, andgeoShowByDefaultis the default value. In our example, we want to display data map of average annual sales per state, so you need to pass theGeoShowDataBy.geoShowByRegion1.Tip
For a full list of values available with the
GeoShowDataByenumeration and their meanings, see MapPoint 2004 help: mk:@MSITStore:C:Program%20FilesMicrosoft%20MapPointMapPoint.chm::/BIZOMVGeoShowDataBy.htm.The portion of the hypothetical display data map command completed so far:
Display a pie chart data map per state for our annual sales compared to our competitor’s annual sales...
However, there is an issue with this command. The sales data
we have is at the county level, but we want to display data at
state level. How can we do it? Now we need theCombineDataBy argument.
CombineDataByAn optional argument needed only when data aggregation is used. Aggregation is required when you want to show data at a larger location dimension than the one in the data table. This argument is of
GeoCombineDataBytype, which is an enumeration. Since you don’t have state level sales data readily available, you have to aggregate (add) the county data to produce a data map at the state level; so, in our example, you have to pass the valuegeoCombineAdd. Other combine options include average, count, default, and none.The portion of the hypothetical display data map command completed so far:
Display a pie chart data map per state for our annual sales compared to our competitor’s annual sales...
DivideByFieldIndicates whether there is any divide-by operation to be performed on the data (
DataFieldargument) being displayed. This argument takes a column name from the table. When you pass a valid column for this field, the data used to display on the map will be:Data displayed on the map = DataField(s)/DivideByField
So, in our example, since we want to display annual sales per product line, we need to divide the annual sales number by the product line count. So, we need to pass the Total Product Lines Sold field for this argument.
The hypothetical display data map command is now complete:
Display a pie chart data map per statefor our annual sales per product line compared to our competitor’s annual sales per product line.
We have now finished the display data map task as we specified it at the beginning. Now it’s time to address the range specification.
Specifying data range
The range specification argument group consists of the arguments that specify the data ranges and related color scheme to be used with the data map. What is a data range in the data map context? Data range is where you define the limits (lowest and highest) for your data to be displayed on the data map. Some ranges will be narrow, while others will be wide—this depends purely on the input data. Usually MapPoint 2004 does a good job of deciding which range types and orders to use depending on the input data. For most applications, leaving the default values would suffice. Still, let’s look at each argument in detail.
The range specification argument group consists of the following arguments:
DataRangeTypeThis argument indicates which kind of data range you prefer to use to display a data map. This argument is of type
GeoDataRangeTypeenumeration, which has values to indicate different data range types such as continuous, logarithmic, discrete, equal data, and so on. When in doubt, just usegeoRangeTypeDefault, and MapPoint will choose the suitable range for your data. If you are planning to use a specific range type for your data maps, there are some compatibility issues that you need to be aware of (for example, a logarithmic data range type cannot be used with unsized pie chart data maps). For a full list of range types and compatibilities, refer to theDisplayDataMapmethod in the help documentation.DataRangeOrderThis argument indicates whether the data map should display range from low to high or high to low. This argument is of type
GeoDataRangeOrderenumeration. The default value isgeoRangeOrderDefault, and MapPoint decides which order to use based on the input data.DataRangeCountThis argument indicates preferred data range count for the data map. The allowed range is from one to eight. This argument is of type integer. This argument is ignored for maps with a continuous data range (since the range here is continuous, rather than a specific ranges in steps) and for unsized pie chart, column chart, and series column chart map styles.
ColorSchemeThis argument indicates the color scheme to use for your data map. There are 16 different types of color schemes (0-15) available in MapPoint. You have to pass the integer value that represents the suitable color scheme for your data map. You can also pass -1 to let MapPoint pick the appropriate color scheme for you.
Tip
For more details on how the color scheme values map to actual colors, refer to the “ColorScheme Property” topic (http://msdn.microsoft.com/library/en-us/mappoint2004/BIZOMPColorScheme.asp) in the online help documentation on MSDN.
So far, we have discussed the arguments you need to understand to work with data maps. If you are not anticipating using custom data range specifications, you can safely skip the following section on specifying custom ranges without losing any continuity or context.
Specifying custom ranges
The following sets of arguments are used only to
specify a custom data range. Why do you need a custom data range?
Say, for example, that you have sales data ranging from $10 to
$10,000. If you want to consider a specific range of sales amount
in your data map, say from $500 to $5,000, ignoring all other
data, you need to use a custom data range specification that sets
the range limits as $500 and $5,000. Remember, though, that there
is a direct relationship between the DataRangeCount argument and the custom
data range values, which is shown in Table 3-5.
Data range type | DataRangeCount | Custom data range values | Notes |
Continuous / Continuous Logarithmic | Ignored | 3 | Set only first and third custom range values. |
Unique Values | 1 to 8 | 1 to 8 | If your data has more than 8 unique values, only first 8 will be displayed. |
Discrete Equal Values/ Discrete Logarithmic/ Equal Data Points | 1 to 8 | Data Range Count + 1 |
Similar to the previous range count, range type, and custom range value relationships, there is one more relationship between map style and custom range values. For column chart and series column chart maps, the number of custom values is always set to five, and you need to set only the first and fifth custom range values.
With this introduction, let’s take a look at the custom range specification arguments in detail:
ArrayOfCustomValuesIndicates the custom range values used for displaying the data map. Use this argument to pass the custom data ranges.
ArrayOfCustomNamesLists the names of the custom data range values. The rules applicable to the custom data range values and data range count are also applicable to the custom data range names, which are displayed in the legend pane.
ArrayOfDataFieldLabelsContains the labels for the colors in the legend pane. This argument size must match the number of colors displayed on the map, which is equal to the number of data fields, except for the series column chart map style, in which case the column charts are always displayed in one uniform color, so only one label is required.
ArrayOfPushpinSymbolsUsed only with the multiple symbol map style. For other styles, the size of this array is equal to that of the data range count. The valid values are 0-255.
We have now finished a grand tour of the DisplayDataMap method argument list. If
your head is spinning by now, don’t worry—I will discuss all of
these concepts with some examples later in this chapter. For now,
there is one last important issue that you need to understand in
order to use this method in .NET: dealing with optional
values .
Dealing with optional values
The DisplayDataMap method (along with many
other methods in the MapPoint 2004’s API) has optional arguments
that can be safely omitted by passing nothing in COM/VB era. It’s
not that simple when you call this method from .NET. Whether it’s
C#, VB.NET, or any other .NET language, there is no notion of
optional values that can be skipped in a method call. However, the
.NET framework provides a type, System.Reflection.Missing.Value, which
represents a COM optional value. So, when you are working with a
method that has optional values, and you do not have any specific
value to pass, you need to send the missing value instance:
    //Define missing argument for optional argument
       object missing = System.Reflection.Missing.Value;
    ....

    //Now display datamap
    MapPoint.DataMap datamap =
        dataset.DisplayDataMap(
        GeoDataMapType.geoDataMapTypeCategoricalColumn,
        datafields, GeoShowDataBy.geoShowByRegion1,
        GeoCombineDataBy.geoCombineByNone,
        GeoDataRangeType.geoRangeTypeDefault,
        GeoDataRangeOrder.geoRangeOrderDefault,
    6, 3, missing, missing, missing, missing, missing);
Now that you have a good understanding of data map styles
and the DisplayDataMap method,
it’s time write some code to display data maps. As a first step,
let’s look at how to use the native demographic data that ships with MapPoint 2004 to display data maps.
Next, we’ll look at some techniques to display external data (for
your business) and to integrate the demographic data and your
data.
Working with MapPoint Demographic Data
MapPoint 2004 ships with a lot of demographic data (also known as statistical data) that includes 136 categories for the United States and Canada and 43 categories for other countries worldwide. This demographic data includes statistics, such as population by location, average age by location, average household income by location, and so on. It is very useful when integrated with your own business data. For example, you may want to see total sales by state in the United Sates and then compare them with total population by state; this gives you an idea of your sales relative to population in each state.
Accessing the Demographic Data Categories Programmatically
Our first task is to see which kind of demographic
data is available on a per country basis programmatically. An active
Map object exposes a DataSets collection. You can access the
demographic data by calling the GetDemographics method on the DataSets collection:
    //Get the demographics dataset by calling the
    //GetDemographics method

    MapPoint.DataSet dataset
     = map.DataSets.GetDemographics(MapPoint.GeoCountry.geoCountryUnitedStates);
The GetDemographics method
takes the country as an input argument and returns a DataSet object containing demographic data
for the specified country.
Tip
You can obtain a demographic DataSet for other countries using
MapPoint.GeoCountry
enumeration. For example, to get demographics for the United
Kingdom, call GetDemographics
with the MapPoint.GeoCountry.geoCountryUnitedKingdom
value.
To get all demographic data categories supported by this
DataSet, loop through its field
collection:
    //Get dataset details
    if(dataset != null)
     {
       //Get all field names
       for(int i=1;i<=dataset.Fields.Count;i++)
        {
          object index = i;
          //Add the field name in a listbox
          listBox1.Items.Add(dataset.Fields.get_Item(ref index).Name);
        }
     }
This code generates a listbox, shown in Figure 3-10, filled with all demographic categories that are available in MapPoint 2004 North American edition.
In case you are wondering how to interpret the list displayed in Figure 3-10, don’t worry—it’s really simple: think of a table with rows and columns where the items from the list are the columns in that table. Now add one more column with some form of location information to the left of the existing columns in the table, and that’s how the demographic data is organized. So an example demographic table can be interpreted somewhat like Table 3-6.
Location | Population (2002) | Households (2002) | Average household size (2002) | ............. |
California | 34,561,775 | 11,701,483 | 2.88 | .............. |
.............. | .............. | .............. | .............. | .............. |
In the previous example, I have taken State as my location dimension; MapPoint 2004 demographic data supports the following location dimensions:
- State
Demographic data by state/region/province.
- Metropolitan area
Demographic data by metropolitan area.
- County
Demographic data by county/province.
- Zip Code
Demographic data by Zip Code.
- Census tract
Demographic data by census tract/subdivision.
- Geography for every zoom level
The location dimension varies based on scale. For example, for maps at lower altitudes, Zip Code or census tract location dimension can be used; for maps at higher altitudes, the states and countries can be used for clarity of data representation.
So, for any given demographic data item (such as “Population (2002)”), you can display a data map on any one of the above six location dimensions. In other words, if it were to be a command (going back to our hypothetical commands again), an example could be: “Show a Shaded Area Map for Population (2002) per State,” and this command displays 2002 population statistics based on state by using the shaded area data map styles.
Even though the demographic data categories are exposed, the actual data itself is not exposed for direct use. MapPoint 2004 APIs allow you to display demographic data based on location. Each of the previous categories contains statistical data, but the data makes more sense if you can either analyze or visualize it based on location.
Displaying Data Map Using Demographic Data
Our next task is to display a data map using a demographic category based on location. We need three pieces of information to display a data map:
Data map style
Data specification
Data range specification
It makes sense to start with a simple scenario: displaying
“Population (2002)” per state in a sized circle map. In this
scenario, the map style used is GeoDataMapType.geoDataMapTypeSizedCircle,
the data field argument value is “Population (2002),” and the show
data by argument is GeoShowDataBy.geoShowByRegion1. For now,
let’s leave the data range specifications at their default
values.
Displaying a data map
Let’s write code to display a data map for these specifications. Assuming that you already have an instance of the MapPoint 2004 ActiveX Control in your Windows form, we will first get the demographic dataset:
    //Get a reference to the active map
    MapPoint.Map map = axMappointControl1.ActiveMap;

    //Get the MapPoint demographics dataset
    MapPoint.DataSet dataset
        = map.DataSets.GetDemographics(MapPoint.GeoCountry.geoCountryUnitedStates);
Now that we have the MapPoint 2004 demographic dataset, define the data field argument:
    //Define the data field name as a key
    object datafieldKey = "Population (2002)";
    //Now get the data field from the demographic dataset
    object[] datafields = new object[1];
    datafields[0] = dataset.Fields.get_Item(ref datafieldKey);
You might have noticed that I’m defining the datafields instance as an array of
objects. You could also define it as a single object instance as
long as you don’t need to pass more than one field name.
Next, define a few other arguments, such as color scheme and data range count:
    //Define the color scheme
    //Between 0 and 16; 3 represents orange/red shade
    int colorScheme = 3;

    //Define data range count
    //Between 1 and 8; 3 works for most
    int rangeCount = 3;

    //Define missing object optional values
    object missing = System.Reflection.Missing.Value;
Now we have everything we need to display a data map, and
the following code snippet shows the actual DisplayDataMap method call:
    //Now call the display data map for sized circle map
    MapPoint.DataMap datamap =
            dataset.DisplayDataMap(MapPoint.GeoDataMapType.geoDataMapTypeSizedCircle,
                    datafields, MapPoint.GeoShowDataBy.geoShowByRegion1,
                    MapPoint.GeoCombineDataBy.geoCombineByNone,
                    MapPoint.GeoDataRangeType.geoRangeTypeDefault,
                    MapPoint.GeoDataRangeOrder.geoRangeOrderDefault,
                    colorScheme, rangeCount, missing, missing,
                    missing, missing, missing);
We are using the default values for range type and range order arguments.
Finally, make sure that you have the legend pane open so that you know how to interpret the data map; the following code shows how to set the legend pane state:
//Now make sure to display legend pane
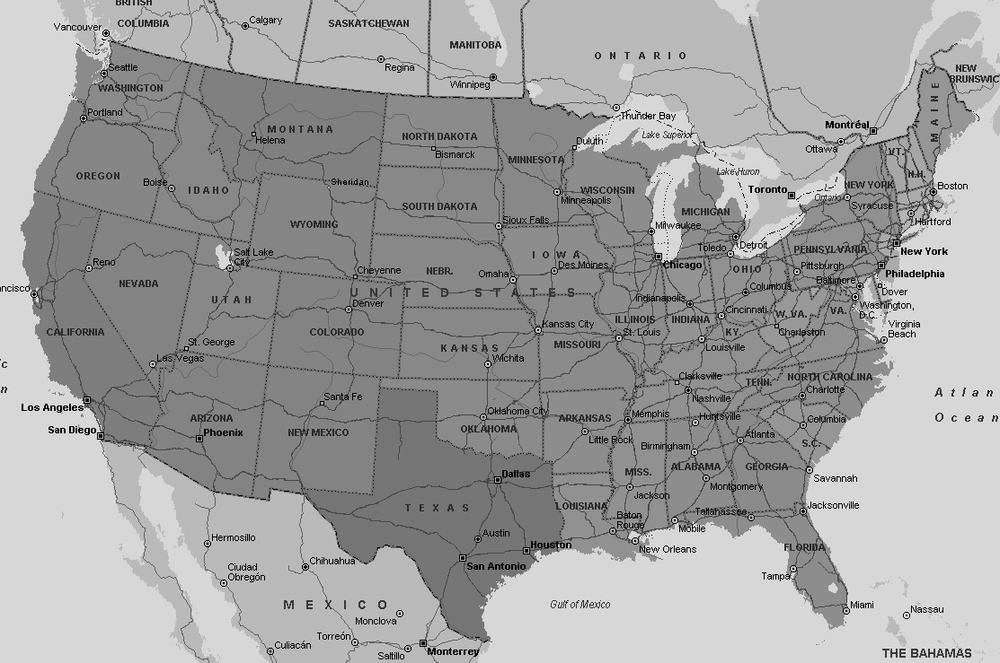
axMappointControl1.PaneState = MapPoint.GeoPaneState.geoPaneLegend;When you execute this code, a data map for population statistics per state, shown in Figure 3-11, is created.
Remember that we have chosen to use the default data range
type for this data map. A little investigation of the resulting
datamap object properties (datamap.DataRanges.DataRangeType)
reveals that MapPoint has chosen geoRangeTypeContinuousLog range type, so
the resulting data map has three ranges with a low value of
400,000 and a high value of 35,000,000. While this data map does a
good job of revealing which state has the largest population
(California, with close to 35 million people!) it does not do a
very good job indicating the state with smallest population
(Wyoming, a quiet 500,000).
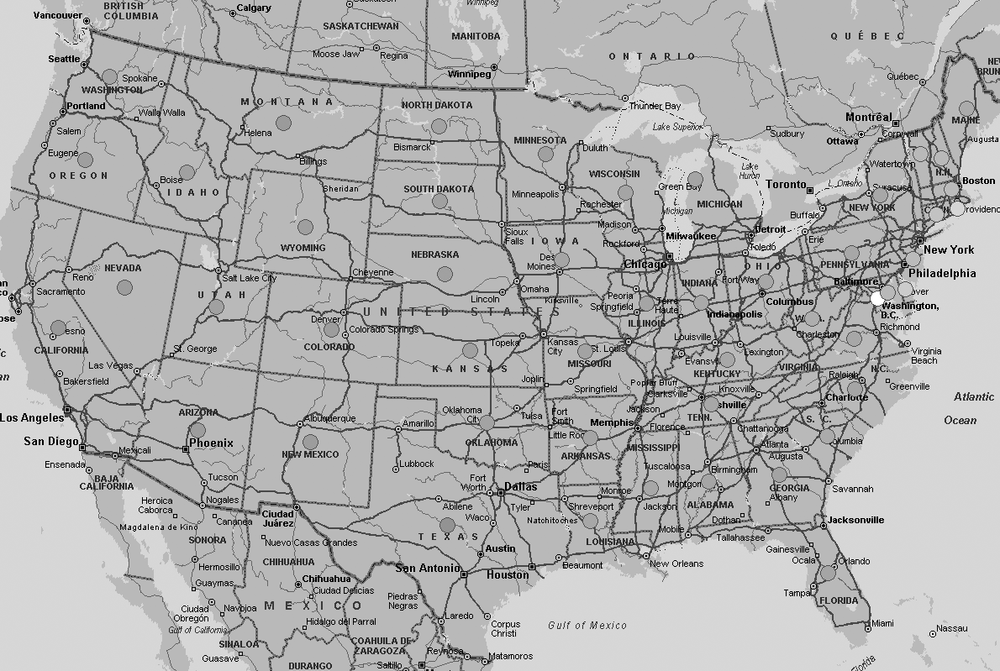
Defining data range type and count
It might be useful to expand the data range a little
by increasing the data range count to, say, eight (the maximum
allowed value). However, changing the data range count to eight
also requires a change in the range type (since the default data
range does not support range count other than three); to meet this
requirement, change the data range type to geoRangeTypeDiscreteEqualRanges. The
following code reflects the two changes discussed:
    //Define data range count
    //Between 1 and 8; changing from 3 to 8
    int rangeCount = 8;
The new method call looks as follows:
    //Now call the display data map for sized circle map
    MapPoint.DataMap datamap =
            dataset.DisplayDataMap(MapPoint.GeoDataMapType.geoDataMapTypeSizedCircle,
                    datafields, MapPoint.GeoShowDataBy.geoShowByRegion1,
                    MapPoint.GeoCombineDataBy.geoCombineByNone,
                    MapPoint.GeoDataRangeType.geoRangeTypeDiscreteEqualRanges,
                    MapPoint.GeoDataRangeOrder.geoRangeOrderDefault,
                    colorScheme, rangeCount, missing, missing,
                    missing, missing, missing);
When you execute the code with these new settings, the data map displayed looks like Figure 3-12.
Even though the data map has an expanded data range, it’s still unclear from the map which state has the smallest population, so you need to use the custom data ranges by specifying custom ranges .
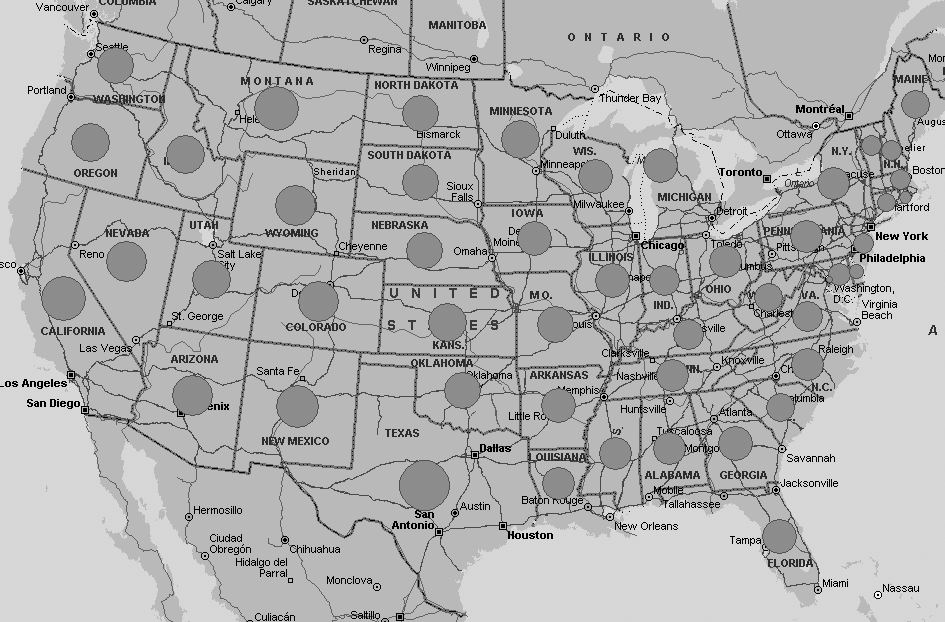
Specifying custom data ranges
In this case, we clearly need a range that starts much lower than the starting range shown in Figure 3-4 (0 to 4,379,999 would be appropriate here). So, define a custom data range as shown below:
    //Define custom range values
    //Since the range count is 8,
    //we are defining 9 range objects
    object[] arrayOfCustomValues = new object[9];
    //Stretch the lower end by defining ranges
    //pretty close to each other
    arrayOfCustomValues[0] = 250000;
    arrayOfCustomValues[1] = 500000;
    arrayOfCustomValues[2] = 750000;
    arrayOfCustomValues[3] = 1000000;
    //Set the maximum value
    arrayOfCustomValues[8] = 35000000;
In this code, I have just defined the starting range as 250,000 and set the next three ranges in 250,000 increments. What I’m really trying to do here is to stretch the lower end of the data range to have smaller ranges to accommodate better size variation in the circles. I also set the maximum limit for the data to be 35,000,000.
The DisplayDataMethod
call with this custom data range specification is shown
here:
    //Now call the display data map for sized circle map
    MapPoint.DataMap datamap =
            dataset.DisplayDataMap(MapPoint.GeoDataMapType.geoDataMapTypeSizedCircle,
                    datafields, MapPoint.GeoShowDataBy.geoShowByRegion1,
                    MapPoint.GeoCombineDataBy.geoCombineByNone,
                    MapPoint.GeoDataRangeType.geoRangeTypeDiscreteEqualRanges,
                    MapPoint.GeoDataRangeOrder.geoRangeOrderDefault,
                    colorScheme, rangeCount, arrayOfCustomValues, missing,
                    missing, missing, missing);
The resulting data map is shown in Figure 3-13.
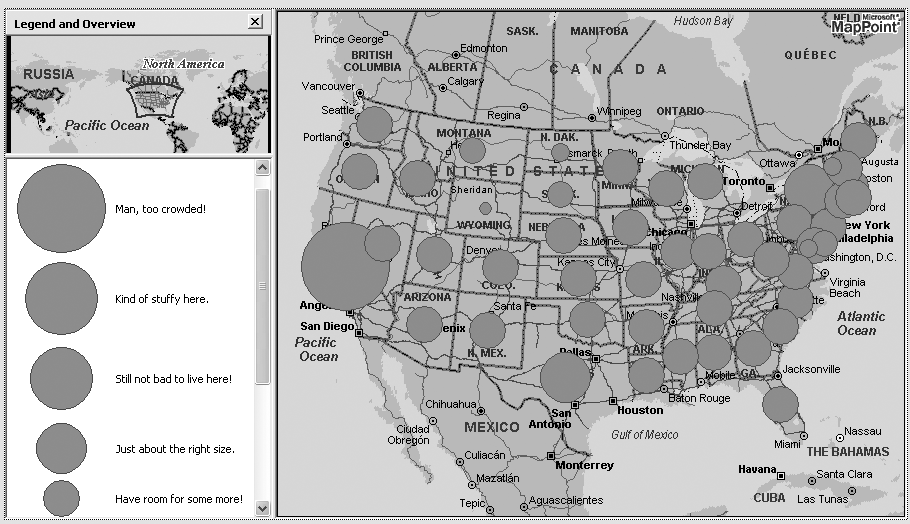
Now, as you can see, the circle in the state of Wyoming looks smallest of all the circles, so it has the smallest population in all states (only 499,904). Using custom data range specification, we could display both the most and least populous states. While we are at it, we can also customize the legend pane to reflect what we are trying to achieve.
Customizing the legend pane
You can customize the legend pane names by defining an array of custom names. The number of the custom name array must be equal to the data range count. In our example the range count is set to eight, so we need to define an array of objects of size eight and assign names for each range:
    //Define custom name array to reflect
    //their populations
    object[] arrayOfcustomNames = new object[8];
    arrayOfcustomNames[0] = "Hello! Anyone home?";
    arrayOfcustomNames[1] = "Small and happy!";
    arrayOfcustomNames[2] = "Nice and pleasant.";
    arrayOfcustomNames[3] = "Have room for some more!";
    arrayOfcustomNames[4] = "Just about the right size.";
    arrayOfcustomNames[5] = "Still not bad to live here!";
    arrayOfcustomNames[6] = "Kind of stuffy here.";
    arrayOfcustomNames[7] = "Man, too crowded!";
Calling the DisplayDataMap method with custom names
results in the map shown in Figure 3-14.
The legend pane now contains custom names. They may look
(and sound) funny. If you are thinking, “How can you judge whether
a state is too crowded based only on population? We’re supposed to
look at the population density to determine whether it is too
crowded or not,” these are the exactly right questions to ask. I
should display population density (population divided by area of
the state) to justify my custom labels. We need to write code to
use the DivideBy field.
Using the DivideBy field
To create a population density map, you need to
divide the population by the total area of the corresponding
state. The area of the state is available in the demographic data
of the “Area in Square Miles” field. To divide the state
population with area, we have only to obtain a reference to the
“Area in Square Miles” field and pass it as a DivideByField argument:
    //Define data field indexes
    object popIndex = "Population (2002)";
       object areaIndex = "Area in Square Miles";

    //Get demographic dataset
    MapPoint.DataSet dataset =
             map.DataSets.GetDemographics(MapPoint.GeoCountry.geoCountryUnitedStates);

    //Get population field
    MapPoint.Field datafield = dataset.Fields.get_Item(ref popIndex);
       //Get area field
    MapPoint.Field divideField = dataset.Fields.get_Item(ref areaIndex);

    ...

    //Define custom range values
    //Since the range count is 8,
    //we are defining 9 range objects
    object[] arrayOfCustomValues = new object[9];
    //Set the custom range values
    arrayOfCustomValues[0] = 1;
    arrayOfCustomValues[1] = 5;
    arrayOfCustomValues[2] = 10;
    arrayOfCustomValues[3] = 50;
    //Set the maximum value
    arrayOfCustomValues[8] = 10000;

    ...

    //Now display Map
    MapPoint.DataMap datamap =
        dataset.DisplayDataMap(MapPoint.GeoDataMapType.geoDataMapTypeSizedCircle,
        datafield, MapPoint.GeoShowDataBy.geoShowByRegion1,
        MapPoint.GeoCombineDataBy.geoCombineByNone,
        MapPoint.GeoDataRangeType.geoRangeTypeDiscreteEqualRanges,
        MapPoint.GeoDataRangeOrder.geoRangeOrderHighToLow,
        colorScheme,rangeCount, arrayOfCustomValues, arrayOfcustomNames,
        divideField, missing, missing);

    //Set proper legend title
       datamap.LegendTitle = "State Population Density";

    //Zoom to show compelte data mapdataset.ZoomTo( );
As you can see from this code, the divideField is the “Area in Square
Miles” field from the demographic dataset. Also, notice that I
redefined the custom data range value to accommodate the new data
values we’ll have after the division process. The new concepts
that I have included in this code are setting the LegendTitle property of the data map and
zooming to the full data map view by calling the ZoomTo method on the dataset object. The
resulting data map is shown in Figure 3-15.
From the data map in Figure 3-15, you can see that Alaska has the lowest population density at about 1.1 people per square mile. When you zoom in to the east coast, you can tell that Washington D.C has the highest population density at about 1,000 people per square mile. There is one more thing you can do with custom data ranges: filter unwanted data from the data map.
Using the custom data range to filter data
By specifying custom data range values, you can show only states with population densities below 100 people per square mile.
    //Set the range so that you only show
    //states with population density
    //below 100 people/Sq. Mile
    arrayOfCustomValues[0] = 1;
    arrayOfCustomValues[1] = 5;
    arrayOfCustomValues[2] = 10;
    arrayOfCustomValues[3] = 50;
    //Set the maximum value
    arrayOfCustomValues[8] = 100;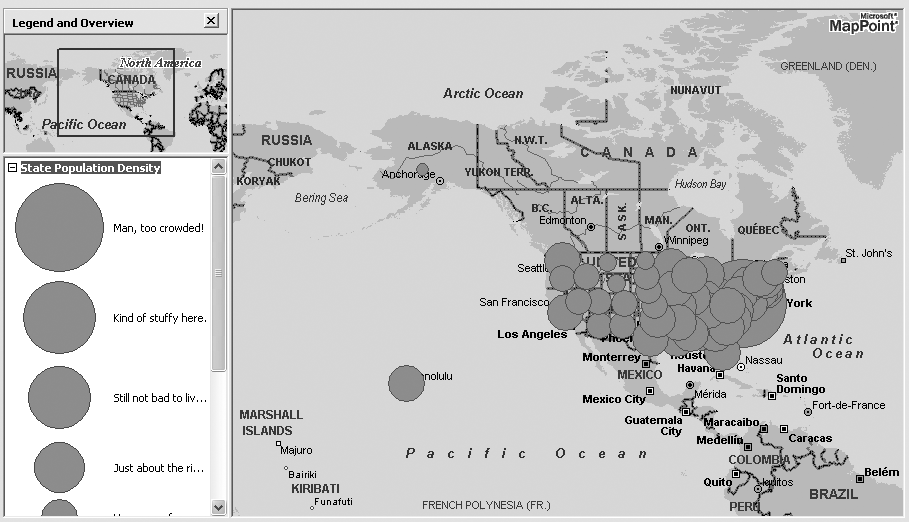
You can also specify any other data range count to achieve the same effect.
Finally, to use the Data Mapping Wizard user interface from the MapPoint 2004 product in
your application, call the DataSets.ShowDataMappingWizard
method:
    MapPoint.DataMap datamap =
            map.DataSets.ShowDataMappingWizard(this.Handle.ToInt32( ),
             null, MapPoint.GeoDataMappingPage.geoDataSetPage);
This method takes the parent window handle, a DataSet instance, if you want to import
the data into an existing data set and onto the starting page of
the wizard. You can pass null if you want to import the data into
a new DataSet instance.
Next, let’s switch gears and look at how to use your business data to draw data maps.
Working with Your Business Data
Using the MapPoint 2004 APIs, you can import external data (i.e. your business data) and use it to create data maps. MapPoint APIs support variety of data sources for importing data. The data sources supported by MapPoint include, but are not limited to:
You can also import Outlook contacts. In this section, I will show how to import data from these data sources and display data maps using the imported data. Then I will show how to integrate your business data with demographic data. You will be able to display data maps rich with both business information and statistical data.
Importing External Data
Importing external data is generally simple using the
MapPoint 2004 APIs. You use the DataSets.ImportData method to import
external data. This method returns reference to a valid DataSet object upon successfully importing
data . The returned DataSet object is also added to the
current active map’s DataSets
collection so that you can use the dataset later; however, once the
map is closed, the imported dataset is lost.
Understanding the DataSets.ImportData method
Like the DisplayDataMap method, the ImportData method is also exposed on the
DataSets collection, mainly due
to the fact that the imported data will be stored as a data set in
MapPoint and made available from the DataSets collection for later use. The
signature for the ImportData
method is as follows:
DataSets.ImportData(DataSourceMoniker, ArrayOfFields, Country, Delimiter, ImportFlags)
Let’s discuss each argument in detail.
To import external data into a MapPoint 2004 DataSet,
indicate the data source specifics, such as the path to the data
source for a text file or an Outlook contacts file moniker, and
pass this as the DataSourceMoniker argument. Even though
this argument is an Object
type, you can pass a string value. However, since there is no
direct interface available in MapPoint 2004 to work with
relational data bases such as SQL Server, you have to write code
to connect to the SQL server and read the data to be imported into
a DataSet (which we will see
later in this chapter).
The next argument is the ArrayOfFields. This argument is used to
import specific fields from the data source. This field is a
two-dimensional array of objects. One dimension holds the data
field names form the data source, and the other holds the field
type specification. The field style specification is defined by
using the GeoFieldType
enumeration, which provides values such as geoFieldSkipped, geoFieldRegion1, geoFieldData, and so on. Each of these
values is used to specify how the data field from the source
should be treated in the MapPoint DataSet. The following code snippet
shows how to define this argument and cite the field
specifications. Say you have a text file that has the following
tab-delimited fields:
    ID  State     Country   Our Sales($) Competitor A Sales($) Competitor B Sales($)
    1   Alabama   US        531          2859                  2810
    2   Arizona   US        4872         328                   193
You can specify the field specification:
    //Define field specification
    object[,] fieldSpecifications = null;

    fieldSpecifications = new object[6,2];

    //Specify what fields are geographic and what fields are not
    fieldSpecifications[0,0] = "ID";
    fieldSpecifications[0,1] = MapPoint.GeoFieldType.geoFieldSkipped;

    fieldSpecifications[1,0] = "State";
    fieldSpecifications[1,1] = MapPoint.GeoFieldType.geoFieldRegion1;

    fieldSpecifications[2,0] = "Country";
    fieldSpecifications[2,1] = MapPoint.GeoFieldType.geoFieldCountry;

    fieldSpecifications[3,0] = "Our Sales($)";
    fieldSpecifications[3,1] = MapPoint.GeoFieldType.geoFieldData;

    fieldSpecifications[4,0] = "Competitor A Sales($)";
    fieldSpecifications[4,1] = MapPoint.GeoFieldType.geoFieldData;

    fieldSpecifications[5,0] = "Competitor B Sales($)";
    fieldSpecifications[5,1] = MapPoint.GeoFieldType.geoFieldData;
The next argument is the country. You have to specify the
country enumeration to indicate the data for the country with
which you are working. This argument’s type is GeoCountry, an enumeration.
The other two arguments are the flags that aid the import process to understand how the data is delimited and data source-specific interfacing. I will discuss these flags later in this section.
Building on this introduction, let’s see how to import data from different data sources.
Importing data from a text file
The DataSets.ImportData method can import
data from text files with tab, semicolon, and comma delimitation.
The following sample code shows how to import a tab-delimited text
file with default field settings:
//Using the MapPoint Sample Sales data from txt file
//This data file can be found on the companion CD in
//the Chapter 03 directory.
string filePath = @"D:MapPoint�3Sample DataSales.txt";
//Define field specification
//Since we want to import all fields, we can just
//go with default import
object missing = System.Reflection.Missing.Value;
//Import data and create a dataset
MapPoint.DataSet dataset =
map.DataSets.ImportData(filePath, missing,
MapPoint.GeoCountry.geoCountryUnitedStates,
MapPoint.GeoDelimiter.geoDelimiterTab,
MapPoint.GeoImportFlags.geoImportFirstRowIsHeadings);When you run this code, each row from the text file is
imported into a newly created DataSet, and a pushpin is placed on the
map to indicate the location of the record. The new DataSet created with this method is also
called a PushpinDataset. You
can also call the DataSet.DisplayPushpinMap method to
display the contents of a dataset. This method places a pushpin
for each record in the corresponding location.
Also, as you might have noticed already, the Delimiter argument in this case is set
to geoDelimiterTab, since the
source data file has records with tab delimited columns; you can
also use the geoDelimiterDefault value. However, in
that case MapPoint determines the delimitation based on the
filename. By design, MapPoint assumes that the delimitation is a
tab for .txt, .asc, and .tab files, while delimitation is a
comma for .csv files.
Finally, The ImportFlags
argument is of GeoImportFlags
type, an enumeration whose value is set to GeoImportFlags.geoImportFirstRowIsHeadings
to indicate that the first row is a header.
After importing the data, you can access the fields in this newly created pushpin dataset as you would access fields in the MapPoint demographic dataset. The following code shows how to access the fields from the imported dataset to display a data map. Say, for example, you have just imported a text file in the following format:
    ID  State     Country   Our Sales($) Competitor A Sales($) Competitor B Sales($)
    1   Alabama   US        531          2859                  2810
    2   Arizona   US        4872         328                   193
Now you can access the data and display a sized pie chart data map to compare your company sales with the other two competing companies. Pie chart maps are great for comparing data side-by-side:
    //Define data map columns
    //These indexes come in the same order as
    //the fields in the text file
    object oursalesIndex = 4; //Fourth field from the text file
    object compAsalesIndex = 5; //Fifth field from the text file
    object compBsalesIndex = 6; //Sixth field from the text file

    //Now get fields
    object[] datafields = new object[3];
    datafields[0] = dataset.Fields.get_Item(ref oursalesIndex);
    datafields[1] = dataset.Fields.get_Item(ref compAsalesIndex);
    datafields[2] = dataset.Fields.get_Item(ref compBsalesIndex);

    //Now display datamap
    MapPoint.DataMap datamap =
        dataset.DisplayDataMap(MapPoint.GeoDataMapType.geoDataMapTypeSizedPie,
                            datafields, MapPoint.GeoShowDataBy.geoShowByRegion1,
                              MapPoint.GeoCombineDataBy.geoCombineByNone,
                              MapPoint.GeoDataRangeType.geoRangeTypeDefault,
                              MapPoint.GeoDataRangeOrder.geoRangeOrderDefault,
                              6, 3, missing, missing, missing, missing, missing);
    //Set the legend title
    datamap.LegendTitle = "Sales by State";

    //Set the legend pane
    axMappointControl1.PaneState = MapPoint.GeoPaneState.geoPaneLegend;
The previous code displays a data map that compares your sales with your competitor company’s sales, as shown in Figure 3-16.
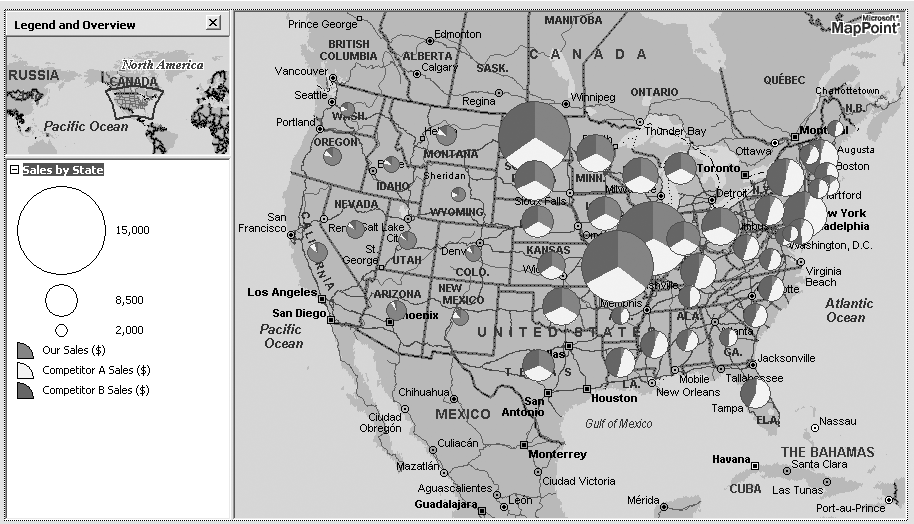
The map in Figure 3-16 contains a significant amount of information, and there are some immediate conclusions you can draw from it. I have listed a few of them:
Sales are strong on the West Coast; however, the sales magnitude is less in the West Coast compared to rest of the country.
Competitor A dominates the market on the East Coast, where the sales magnitude is also large.
The Midwest seems to be the battle ground among the three companies. They seem to have equal market share. Also, note that the Midwest has the biggest overall market size.
The list of conclusions that can be drawn can go on and on once you get into the details of each market segment, your share of the market segment, your competitor’s share, and so on. To get there, though, you can easily import your business data and process that data using location to help you make intelligent and informed business decisions.
You may be wondering, “How does MapPoint understand how each record is linked to a location?” You are right that we haven’t specified anything of that nature to tell MapPoint which column is a location column from the text file, neither in the import code nor in the data map display code. So how does it understand? It’s actually pretty simple. MapPoint understands keywords like “state,” “country,” “Zip Code,” etc. and maps them to the appropriate geographic region. In this example, MapPoint automatically associated each record with the state location.
So, what happens if you have location data in an obscurely
named column, say, “LocX?” Can MapPoint interpret it as a location
and map the record to that location? No. That’s when you need to
help MapPoint understand your data using the ArrayOfFields specification
argument.
Helping MapPoint understand your text data
When no location column is clearly named or when you have 200 columns of which you want only 10 columns for your data map, you need to specify the field specifications to help MapPoint understand your data. Say, for example, you have a text file as a data source with the following data:
    ID  LocX     Land   Our Sales($) Competitor A Sales($) Competitor B Sales($)
    1   Alabama   US        531          2859                  2810
    2   Arizona   US        4872         328                   193
Imagine that the requirement is only to import the state
field (named LocX) and your
sales field (named “Our Sales ($)”), ignoring the rest of the
fields. You have to define field specifications:
    //Define field specification
    object[,] fieldSpecifications = null;

    //Declare field specifications to indicate about
    //each and every field - so we need a total of
    //6 fields since we have 6 fields in the txt file
    fieldSpecifications = new object[6,2];

    //Specify the field name
    fieldSpecifications[0,0] = "ID";
    //Indicate MapPoint not to import it
    fieldSpecifications[0,1] = MapPoint.GeoFieldType.geoFieldSkipped;

    //Specify the field name
    fieldSpecifications[1,0] = "LocX";
    //Indicate MapPoint that this is a State field
    fieldSpecifications[1,1] = MapPoint.GeoFieldType.geoFieldRegion1;

    fieldSpecifications[2,0] = "Land";
    fieldSpecifications[2,1] = MapPoint.GeoFieldType.geoFieldCountry;

    //Specify the field name
    fieldSpecifications[3,0] = "Our Sales($)";
    //Indicate MapPoint that this is one of the required
    //data fields so that MapPoint imports it
    fieldSpecifications[3,1] = MapPoint.GeoFieldType.geoFieldData;

    //Skip all other fields
    . . .

    //Now import the data and create a dataset
    MapPoint.DataSet dataset =
        map.DataSets.ImportData(filePath, fieldSpecifications,
        MapPoint.GeoCountry.geoCountryUnitedStates,
        MapPoint.GeoDelimiter.geoDelimiterTab,
        MapPoint.GeoImportFlags.geoImportFirstRowIsHeadings);
The GeoFieldType
enumeration value is used to inform MapPoint about any given field
from the data source.
Once you import your data into a dataset, using either a default import or a customized import using the custom field specifications, you can integrate your data with the demographic data and display data map using both datasets.
Tip
For full list of GeoFieldType enumeration values, see
the GeoFieldType values topic
from the help documentation:
mk:@MSITStore:C:Program%20FilesMicrosoft%20MapPointMapPoint.chm::/BIZOMVGeoFieldType.htm.
Displaying Data Maps using your data and demographic data
MapPoint 2004 allows you to draw more than one data map on any given ActiveMap instance meaning that you can display an Annual Average Spending data map using the demographic data set, and then display a data map of your sales on top of the existing data map. The resulting data map contains data from both datasets and gives you an idea of how to make use of demographic data in conjunction with your business data to make intelligent business decisions.
Now that you know how to import data from a text source and how to customize the import using field specifications, let’s look at importing data from other data sources.
Importing Data from Microsoft Excel
Importing data from a Microsoft Excel file is no different from importing data from a text file. To use an Excel data source with the MapPoint 2004 API, you need to know how to define an Excel data source moniker. Say you have an Excel file with sales data in the C:MapPointData directory. Also, assume that the actual sales data is in Sheet2 of the Excel book. The data source moniker would be:
string filePath = @"C:MapPointDataSales.xls!sheet2";
Once you have the proper data source moniker ready, importing the data is easy. It is similar to what you have seen in case of a text file:
    //Define the missing field
    object missing = System.Reflection.Missing.Value;
    //Import data and create a dataset
    MapPoint.DataSet dataset =
        map.DataSets.ImportData(filePath, missing,
        MapPoint.GeoCountry.geoCountryUnitedStates,
        MapPoint.GeoDelimiter.geoDelimiterDefault,
        MapPoint.GeoImportFlags.geoImportExcelSheet);
However, if you are importing data from an Excel source, and you want to limit your data to a particular row and column range, the moniker and the data import flag will be different. Table 3-7 shows different data import options, corresponding monikers, and the appropriate data import flags.
Import type | Moniker example | Import flag value |
Excel File | C:MapPointDataSales.xls | |
Excel Sheet | C:MapPointDataSales.xls!Sheet1 | |
A1 - Range | C:MapPointDataSales.xls! Sheet1!A1:D10 | |
R1C1 - Range | C:MapPointDataSales.xls! Sheet1!R1C1:R10C3 | |
Excel Named Range | C:MapPointDataSales.xls!myNamedRange | |
The A1 and R1C1 ranges are used to select a particular set of rows and columns from the source Excel sheet.
Importing data from Microsoft Access
Support for importing data from a Microsoft Access database is built into MapPoint 2004 APIs. An import from an Access database differs from any other data source imports that we’ve seen so far only in terms of defining the data moniker and specifying an appropriate import flag.
For example, if you have a sample sales Access database in the C:MapPointDataSales.mdb directory, and if it has a table called SalesTable that contains sales information based on location, you can define a moniker as follows:
string filePath = @"C:MapPointDataSales.mdb!SalesTable";
Once you have the right moniker, it is pretty simple to import the data:
    //Define missing argument for optional argument
    object missing = System.Reflection.Missing.Value;
    //Import data and create a dataset
    MapPoint.DataSet dataset =
            map.DataSets.ImportData(filePath, missing,
            MapPoint.GeoCountry.geoCountryUnitedStates,
            MapPoint.GeoDelimiter.geoDelimiterDefault,
            MapPoint.GeoImportFlags.geoImportAccessTable);
Microsoft Access also supports data source monikers in the query form. If you have a query, namely SalesQuery in your Access database, you can import data from it using the following moniker and import flag arguments:
       string filePath = @"C:MapPointDataSales.mdb!salesQuery";

    //Define missing argument for optional argument
    object missing = System.Reflection.Missing.Value;
    //Import data and create a dataset
    MapPoint.DataSet dataset =
            map.DataSets.ImportData(filePath, missing,
            MapPoint.GeoCountry.geoCountryUnitedStates,
            MapPoint.GeoDelimiter.geoDelimiterDefault,
            MapPoint.GeoImportFlags.geoImportAccessQuery);
Next, let’s look at how to import data from a SQL database.
Importing data from SQL Server 2000
Unlike the data imports that we have seen so far, MapPoint 2004 does not have any built-in support for importing data from relational databases such as SQL 2000. Using the .NET Framework’s ADO.NET base classes , however, you can easily import data. So, in this section, I will show how to import data from SQL into MapPoint. In the following example, I import customer order information from the Orders table in the standard NorthWind database.
Since there is no ImportData method that both supports a
SQL data source and creates a resulting DataSet, you need to create a data set
yourself in which to import data. The first step is to create a
new DataSet instance in the
DataSets collection:
    //See whether there is an existing datasetwith the same name
    object datasetName = "NorthWind Orders";
    if(map.DataSets.Count > 0 && map.DataSets.get_Item(ref datasetName) != null)
        //If so, delete it
        map.DataSets.get_Item(ref datasetName).Delete( );
    //Now create a new dataset
    MapPoint.DataSet dataset = map.DataSets.AddPushpinSet("NorthWind Orders");
I check for an existing DataSet with the name NorthWind Orders
and delete it if it already exists. We need to perform this check
since you cannot create a dataset with the same name twice in one
map session; MapPoint throws an exception when you create a
duplicate.
Once you have the DataSet
ready to import the data, connect to the SQL Server using the
ADO.NET SqlConnection
class:
    //Define a connection string
    string sqlConnectionString =
       "server=localhost;database=northwind;User Id=sqluser;Password=password";

    //Define a connection object
    System.Data.SqlClient.SqlConnection connection
        = new System.Data.SqlClient.SqlConnection(sqlConnectionString);
Tip
You can also configure your App.Config file to read the connection from SQL Server; in either case, make sure to keep your SQL Server user ID and password safe and secure.
Now that your application is ready to connect to SQL Server,
the next step is to create a SQL query using the ADO.NET SqlCommand class to get the purchase
order records from the orders database:
    //Define a SQL query
    string sqlQueryString = "SELECT CustomerID as ContactName, ShipName as CompanyName,
ShipAddress as Address, ShipCity as City, ShipRegion As Region, ShipPostalCode as
PostalCode, ShipCountry as Country FROM Orders WHERE ShipCountry = 'USA'";

    //Define a command object
    System.Data.SqlClient.SqlCommand command =
            new System.Data.SqlClient.SqlCommand(sqlQueryString, connection);
Since we have the SQL command instance ready, we need to
execute the command, read through the records, and import each one
of them into the DataSet
instance that we have created earlier.
    try
       {
          //Open the connection
          connection.Open( );
          //Get a sql reader from the query
          System.Data.SqlClient.SqlDataReader sqlReader =
                    command.ExecuteReader(System.Data.CommandBehavior.CloseConnection);
          if(sqlReader != null)
           {
              while(sqlReader.Read( ))
               {
                  //Get the name of the customer
                  string customername  = sqlReader["ContactName"] as String;
                  //Get the company name
                  string companyname  = sqlReader["CompanyName"] as String;
                  //Get the address string
                  string address = sqlReader["Address"] + ", " + sqlReader["City"] + ",
                                 " + sqlReader["Region"] + ", " +
                                  sqlReader["PostalCode"] + " " + sqlReader["Country"];

                 //Find location
                 MapPoint.Location location = null;
                 try
                   {
                      //Find the address
                      MapPoint.FindResults findrs = map.FindResults(address);
                      //If no results found, skip to next record
                      if(findrs == null || findrs.Count <= 0)
                          throw new Exception(address);
                      //Get the location
                      location = findrs.get_Item(ref index) as MapPoint.Location;
                      //Create a pushpin
                      if(location != null)
                       {
                         MapPoint.Pushpin pushpin =
                              map.AddPushpin(location, companyname);
                         //Assign the contact name
                         pushpin.Note = "Contact : " + customername;
                            //Move to the pushpin dataset
                         pushpin.MoveTo(dataset);
                       }
                   }
              catch
                   {
                      //Do some logging
                   }
            }

            //Close the reader; this will automatically close the connection
            //due to the command behavior setting during the ExecuteReader method
            sqlReader.Close( );
          }
        }
    catch
        {
          //Do clean up
        }
This code loops through the records from the SqlDataReader instance, finding the
corresponding location for each ship address in the orders table,
adding a pushpin to the map for that location, and, most
importantly, at the end, moving that pushpin to the dataset
created previously using the Pushpin.MoveTo method.
Upon executing this code, we now have a pushpin DataSet that can be treated like any
imported DataSet that we have
seen so far in this chapter.
Finally, to use the MapPoint 2004 Import Data Wizard, call
the DataSets.ShowImportWizard
method.
So far, we have used MapPoint DataSets to display data maps. There are
more powerful business intelligence applications you can build
with MapPoint 2004.
A MapPoint DataSet is
very versatile—you can build business applications to assist in
making intelligent business decisions (similar to the one you have
seen at the beginning of this section with pie charts), but now
let’s take a simple scenario that does not include a data map but
still relates to business intelligence and decision making. The
DataSet that I will use for
this example is the NorthWind Orders dataset that we just
created.
Let’s tackle a simple form of a supply-chain optimization
problem: your company has warehouses on the West Coast where all
of the West Coast shipments come from. Considering that the U.S.
West Coast is very long, your CEO wants to know whether there is a
way to cut transportation costs and boost your company’s
bottom-line. One simple way to answer his question is by
investigating all shipped orders and finding out how many orders
are transported from any given warehouse for more than, say, 100
miles. Next, investigate whether there is a possibility of opening
another warehouse in a place closer to the customers in that area.
Then you could cut down the transportation for the shipments. Can
MapPoint 2004 do this? Using the DataSet querying capabilities, absolutely! Let’s see how.
Querying a MapPoint DataSet
A MapPoint DataSet
object gives you the ability to query the dataset to access the
records. These queries can be pure data access queries (using the
DataSet.QueryAllRecords method) or
geometry- and location-based queries (using the DataSet.QueryCircle, DataSet.QueryPolygon, and so on). In any
case, a successful query returns a RecordSet object that you can loop through
the records and access the fields and the values contained in that
record. With this introduction, let’s now look at different ways to
query a dataset.
Executing Location Queries Using MapPoint DataSet
You can query a DataSet using specific location queries
for which the DataSet object
provides methods, such as QueryCircle, QueryPolygon, and QueryShape. I will discuss the QueryCircle and QueryPolygon methods in this section and
the QueryShape method shortly
after introducing the shape concepts in the next section.
The QueryCircle method
allows you to limit your query based on geographic distance. An
example of this type of query is, “Find all orders that are being
shipped to locations more than 100 miles away from my warehouse.” In
this query, you would use the QueryCircle method, specify the center of
the circle as your warehouse, and set the radius of the circle to
100 miles.
Now, let’s get back to our supply-chain optimization problem: imagine that you have a warehouse in Redmond, WA, and you have a database of all orders shipped on the West Coast. You can query the shipment records to find out which orders travel for more than 100 miles from your warehouse in Redmond by following these steps:
Import all orders from SQL Server into a dataset:
    //Create a new dataset
    MapPoint.DataSet dataset = map.DataSets.AddPushpinSet("NorthWind Orders");

    //Import orders records from your SQL Server
    try
       {
          //Open the connection
          connection.Open( );
          //Get a sql reader from the query
          System.Data.SqlClient.SqlDataReader sqlReader =
                    command.ExecuteReader(System.Data.CommandBehavior.CloseConnection);
          if(sqlReader != null)
           {
              while(sqlReader.Read( ))
               {
                  //Get the name of the customer
                  string customername  = sqlReader["ContactName"] as String;
                  //Get the company name
                  string companyname  = sqlReader["CompanyName"] as String;
                  //Get the address string
                  string address = sqlReader["Address"] + ", " + sqlReader["City"] + ",
                                 " + sqlReader["Region"] + ", " +
                                  sqlReader["PostalCode"] + " " + sqlReader["Country"];

                 //Find location
                 MapPoint.Location location = null;
                 try
                   {
                      //Find the address
                      MapPoint.FindResults findrs = map.FindResults(address);
                      //If no results found, skip to next record
                      if(findrs == null || findrs.Count <= 0)
                          throw new Exception(address);
                      //Get the location
                      location = findrs.get_Item(ref index) as MapPoint.Location;
                      //Create a pushpin
                      if(location != null)
                       {
                         MapPoint.Pushpin pushpin =
                              map.AddPushpin(location, companyname);
                         //Assign the contact name
                         pushpin.Note = "Contact : " + customername;
                         //Move to the pushpin dataset
                         pushpin.MoveTo(dataset);
                       }
                   }
              catch
                   {
                      //Do some logging
                   }
            }

            //Close the reader; this will automatically close the connection
            //due to the command behavior setting during the
            //ExecuteReader method
            sqlReader.Close( );
          }
        }
    catch
        {
          //Do clean up
        }
Find the location of your warehouse using the
FindResultsorFindAddressmethod://Now find out how many orders are shipping within 100 miles //of your warehouse in Redmond, WA //First step is to find out the warehouse MapPoint.Location warehouse = map.FindResults("1 Microsoft Way, Redmond, WA").get_Item(ref index) as MapPoint.Location;Define the distance limit (the radius of the circle):
    //Define the radius of the circle
    double radius = 100;
Query the dataset using the warehouse location and the distance limit:
    //Now query for records (orders) that fall within 100 miles of distance around
    //this warehouse using the QueryCircle method

    //Call the Query circle method with warehouse as center and the radius
    MapPoint.Recordset orders = dataset.QueryCircle(warehouse, 100);
Count the number of matching records for this query to get the number of orders shipping from your warehouse in Redmond that travel for distances of 100 miles or more:
    //Count the orders
    int orderCount = 0;
    if(orders != null)
    {
        orders.MoveFirst( );
        while(!orders.EOF)
        {
            orderCount ++;
            orders.MoveNext( );
        }
    }

    MessageBox.Show( orderCount.ToString( ) + " out of " +
                  dataset.RecordCount.ToString( ) +
                 " orders are shipping from Redmond, WA warehouse");
Using the standard NorthWind database order data, there are 17 orders out of total 113 being transported for more than 100 miles—that’s more than 10% of your company’s orders. Now you can extend this code to find out specific locations that are outside the 100-mile radius, find a place at the center of these locations, and recommend it as your new warehouse.
Along the same lines, you can use the QueryPolygon method if you have an array
of locations and want to get the records from a dataset that resides
within that polygon.
In some cases, you may need to query all the records in a
dataset and loop through them. It is possible to accomplish this
task with the DataSet object
using the QueryAllRecords
method.
Querying a Dataset for All Records
You can query a DataSet object for all records using the
DataSet.QueryAllRecords
method:
    //Query all records and loop through
           MapPoint.Recordset recordSet = dataset.QueryAllRecords( );

        //Move the first record in the cursor
        recordSet.MoveFirst( );

        //Loop through the record set and see the values
        while(!recordSet.EOF)
        {
            //Get the row-level values for each field
            foreach(MapPoint.Field field in recordSet.Fields)
            {
                MessageBox.Show(field.Value.ToString( ));
            }
            //Move to next record
            recordSet.MoveNext( );
        }
In addition to querying for all records and looping through
the records, this code also shows the value for each field contained
in the record. Is there a way to query for all records and access
fields by their name or index? Yes, using the RecordSet.Fields collection. The following
example shows how to access the value of a field selected by the
name of the field:
    //Query all records and loop through
    MapPoint.Recordset recordSet = dataset.QueryAllRecords( );

    //Move the first record in the cursor
    recordSet.MoveFirst( );

    //Define the field name to that we are interested in
       object stateField = "State";

    //Loop through the record set and see the values
    while(!recordSet.EOF)
        {
               MapPoint.Field field = recordSet.Fields.get_Item(ref stateField);
            //Find the corresponding pushpin
            MapPoint.Pushpin pp = map.FindPushpin(field.Value.ToString( ));
            //For fun show each pushpin detail in a loop
            if(pp != null)
            {
                pp.Highlight = true;
                pp.BalloonState = MapPoint.GeoBalloonState.geoDisplayBalloon;
                System.Threading.Thread.Sleep(1000);
                pp.BalloonState = MapPoint.GeoBalloonState.geoDisplayNone;
                pp.Highlight = false;
            }
            else
            {
                //MessageBox.Show("Field not found!");
            }
            //Move to next record
            recordSet.MoveNext( );

        }
I’m querying for all records and then for each individual
record. I use the value of the location field to find the
corresponding pushpin and highlight it. The processing I’m doing in
this case (highlighting a pushpin based on a field value) may look
trivial, but you need this kind of simple capability when you are
building more complex applications like fleet tracking (which we
will build in the next chapter). You can also obtain a pushpin
corresponding to a dataset record by using the Recordset.Pushpin property.
Now that you have seen how to query a dataset for all the
records and use the QueryCircle
method, it’s time to look at the Shapes and how to query Shapes to explore the power of MapPoint
2004 DataSet APIs.
Working with Shapes
A shape in MapPoint
2004 context is an entity that can be drawn on top of a map, queried
for location information, or altered in appearance. MapPoint 2004 APIs
allow you to draw, query, and alter the shapes on any given map. These shapes include circles, polygons,
polylines, text boxes, drivetime zones, and so on. Remember that the
circles, pies, series columns, and all other shapes drawn using the
DisplayDataMap do not belong to
shape category, since there is no way for you to either query or alter
the circle shape appearance. Now, let’s see how to work with shapes in
MapPoint 2004.
Drawing Shapes
MapPoint 2004 APIs expose all shapes on any given map as a
Shapes collection (similar to the
DataSets collection). Using this
Shapes collection, you can add a
new shape or retrieve an existing shape. To add a new shape, the
Shapes collection offers Add XXXX
methods (where XXXX can be a line, text
box, polyline, and so on). Table 3-8 provides a list of
these methods and their descriptions:
Methodname | Notes |
| Adds a freeform closed shape representing the driving distance from a point on the map within a specified amount of time |
| Adds a new line to the map between two points |
| Adds a new polyline to the map |
| Adds a new radius circle, oval, or rectangle to the map |
| Adds a new text box to the map |
When you call one of these Add methods, a shape is created on the map
and added to the Shapes
collection. The method also returns a reference to the newly created
shape as a Shape object. You can
also access a shape using the Shapes collection indexer via the shape
index or name.
Next, we’ll draw a shape using the MapPoint 2004 APIs.
Drawing a circle
Using the AddShape method from the Shapes collection, you can add a circle
or oval at any location on the current map. The AddShape method accepts the type of
shape, which is of MapPoint.GeoAutoShapeType enumeration,
and the location around which to draw this shape at the same
height and width.The GeoAutoShapeType enumeration supports
drawing ovals, circles, and rectangles. The following example
shows how to draw a circle around the location Seattle, WA:
    //Find a location
    object index = 1;
    MapPoint.Location location =
            (MapPoint.Location) map.FindResults("Seattle").get_Item(ref index);

    //Add a circle with radius = 50 miles
    MapPoint.Shape shape =
            map.Shapes.AddShape(MapPoint.GeoAutoShapeType.geoShapeOval,
                            location, 50, 50);
    //Zoom to shape
    shape.Location.GoTo( );
To draw an oval, pass a different height and width. What if
you want to draw a circle that shows the radius? You’ll have to
use GeoAutoShapeType.geoShapeRadius as the
shape type. You can also draw a rectangle using the same method
but passing the GeoAutoShapeType.geoShapeRectangle value
for the shape type argument.
Drawing a line
Drawing a line using MapPoint 2004 is very simple. Since a line is basically a shape that connects only two locations, pass two locations to this method. So, if you want to draw a line between Seattle, WA, and Los Angeles, CA, use the following code:
    object index = 1;
    //Find Seattle, WA
    MapPoint.Location location1 =
         (MapPoint.Location) map.FindResults("Redmond, WA").get_Item(ref index);
    //Find Los Angeles, CA
    MapPoint.Location location2 =
         (MapPoint.Location) map.FindResults("Los Angeles, CA").get_Item(ref index);

    //Now, add a line
    MapPoint.Shape shape = map.Shapes.AddLine(location1, location2);
Drawing a polyline
While a line connects two locations, a polyline connects more than two
locations. The AddPolyline
method takes an array of locations as an argument and draws a
polyline connecting the input locations.
The following example shows how to draw a polyline connecting Redmond, WA, Portland, OR, and Los Angeles, CA:
    object index = 1;

    MapPoint.Location location1 =
      (MapPoint.Location) map.FindResults("Redmond, WA").get_Item(ref index);
    MapPoint.Location location2 =
      (MapPoint.Location) map.FindResults("Portland, OR").get_Item(ref index);
    MapPoint.Location location3 =
      (MapPoint.Location) map.FindResults("Los Angeles, CA").get_Item(ref index);

    //Add a polyline
    MapPoint.Shape shape =
    map.Shapes.AddPolyline(new MapPoint.Location[] {location1, location2, location3});
Drawing a polygon
You can extend the polyline to draw a polygon by closing the
polyline to form a polygon. For example, if you have four
locations that you are drawing a polyline with, you can form a polygon using these
four locations by connecting the last location with the first
location. The following example shows how to create a polygon
using the AddPolyline
method:
    object index = 1;
    MapPoint.Location location1 =
      (MapPoint.Location) map.FindResults("Redmond, WA").get_Item(ref index);
    MapPoint.Location location2 =
      (MapPoint.Location) map.FindResults("Portland, OR").get_Item(ref index);
    MapPoint.Location location3 =
      (MapPoint.Location) map.FindResults("Los Angeles, CA").get_Item(ref index);
    MapPoint.Location location4 =
      (MapPoint.Location) map.FindResults("Boise, ID").get_Item(ref index);

    //Add a ployline
    MapPoint.Shape shape =
        map.Shapes.AddPolyline(new MapPoint.Location[] {
                           location1, location2, location3, location4, location1});
Since “location4” is now connected back to “location1,” this method draws a polygon that includes the aforementioned four locations as vertices.
Accessing shape vertices
For any non-GeoAutoShapeType shape, you can access
vertices/locations at the vertices that make up that shape. You
can obtain values for vertices for any shape that is drawn using
AddLine or AddPolyLine methods:
    //Add a ploygon
    MapPoint.Shape shape = map.Shapes.AddPolyline(new MapPoint.Location[]
                    {location1, location2, location3, location4, location1});

    //Now get the vertices for this polygon
    object[] vertices = shape.Vertices as object[];
    foreach(object vertex in vertices)
    {
        MapPoint.Location loc
            = vertex as MapPoint.Location;
    }
The vertices are exposed as an array of objects, and you
have to typecast them as Location objects to access the location
properties of the vertex.
Sometimes you have to find distance from a given point or
location to a shape. In such cases, since there is no direct API
available for this purpose, use the vertices of the shape to find
the nearest vertex to the input location using the Location.DistanceTo method:
    //Start with a location object
    MapPoint.Location loc;
    //Obtain a valid location instance such as Redmond, WA
    //and assign it to loc object.
    . . .

    //Now get the vertices a polygon from where
    //we want to measure distances
    object[] vertices = shape.Vertices as object[];
    foreach(object vertex in vertices)
    {
        MapPoint.Location shapeLoc
            = vertex as MapPoint.Location;
        //Now get distance
        Console.WriteLine(shapeLoc.DistanceTo(loc));

    }
While this is does not give exactly the nearest location, it provides a workaround for this situation.
Drawing a text box
Finally, the Shapes collection provides a method to
draw a text box on the map. This is useful to draw labels that are
specific to your business needs. The following example shows how
to draw a text box at the center of a circle that indicates your
market area:
    //Find a location
    object index = 1;
    MapPoint.Location location =
        (MapPoint.Location) map.FindResults("SEA").get_Item(ref index);

    //Add a circle
    MapPoint.Shape shape =
            map.Shapes.AddShape(MapPoint.GeoAutoShapeType.geoShapeOval,
            location, 150, 150);

    //Draw a text box
    MapPoint.Shape tBox = map.Shapes.AddTextbox(location, 50, 20);

    //Now assign text to the text box
    object name = "MarketingAreaTextBox";
    //Assign it to the shape
    tBox.Name = name.ToString( );
    //Now assign text by accessing the shape from the collection
    map.Shapes.get_Item(ref name).Text = "Marketing Zone A";
The shape can be accessed via either the name of the shape
or the index of the shape from the Shapes collection.
So far, you have seen how to draw shapes. Next, let’s look at how to customize the shape’s appearance using the MapPoint 2004 APIs.
Altering Shape Appearance
Using the MapPoint 2004 APIs, you can not only draw shapes but also modify their look and feel. There are some limitations related to the color settings, but I will discuss how to work with the OLE color palette using the .NET colors.
Altering line width
When you draw a shape in MapPoint 2004, the shape is drawn
with a default line width and color. However, you can change these
attributes by altering the settings available using the Shape.Line property, which is a LineFormat object. The LineFormat object exposes Width and ForeColor properties to alter the width
and color of the line. The properties are Integer type. The integer represents the
RGB color value of the OLE color format. In order to convert the
.NET Color structure to the OLE color structure , use the .NET Framework’s ColorTranslator class available in the
System.Drawing namespace. The
following example shows how to set the line color and line width
of a circle shape:
    //Add a circle
    MapPoint.Shape shape =
      map.Shapes.AddShape(MapPoint.GeoAutoShapeType.geoShapeOval, location, 75, 75);

    //Customizing the line format
    shape.Line.Weight = 1;
    shape.Line.ForeColor = ColorTranslator.ToOle(Color.LightSteelBlue);
You can change the visibility of the line using the LineFormat.Visible property:
    //Do not want to show the line
    shape.Line.Visible = false;
Changing the fill color
You can change the fill color of a shape using the Shape.Fill property, which is a FillFormat object. The FillFormat object exposes properties
such as ForeColor and Visible to change the appearance of the
shape. The following sample shows how to change the fill color of
a circle shape:
    //Add a circle
    MapPoint.Shape shape =
      map.Shapes.AddShape(MapPoint.GeoAutoShapeType.geoShapeOval, location, 75, 75);

    //Customizing a shape look-and-feel
    shape.Fill.ForeColor = ColorTranslator.ToOle(Color.LightBlue);
    //Set visibility to true
    shape.Fill.Visible = true;
When I talk about fill color, you may be wondering whether it is possible to fill the shape with alpha blending (or translucency ). Actually, OLE fill color does not support alpha blending; however, MapPoint 2004 allows you to create and fill shapes so that the map beneath the shape is still visible.
Simulating translucency
The Shape object has a
method, ZOrder, which you can
use to make a shape transparent even with fill color visible. The
ZOrder method takes an argument
of type GeoZOrderCmd
enumeration, which provides values for sending the shape behind
objects (such as roads on the map), bringing it in front of
objects, or sending it behind another shape. To make a shape
transparent by sending it behind the roads, use the following
code:
    //Add a circle
    MapPoint.Shape shape =
       map.Shapes.AddShape(MapPoint.GeoAutoShapeType.geoShapeOval, location, 75, 75);

    //Customizing a shape look-and-feel
    shape.Fill.ForeColor = ColorTranslator.ToOle(Color.LightBlue);
    shape.Fill.Visible = true;
    shape.Line.Weight = 1;
    shape.Line.ForeColor = ColorTranslator.ToOle(Color.LightSteelBlue);

    //Send back to the map
   shape.ZOrder(MapPoint.GeoZOrderCmd.geoSendBehindRoads);
Toggling shape visibility
Sometimes you have to toggle the visibility of a
shape completely. Even though the MapPoint 2004 API provides
Visible properties for both
line and fill color of shapes, setting them as false does not make the shape disappear
completely. You can work around this by moving a shape to an
obscure location (such as the North Pole) and bringing it back to
its original location when needed. The following steps show how to
achieve the visibility toggling effect:
Define a
Hashtableto hold the shape’s original location://Create a hashtable to store shape ids System.Collections.Hashtable hTable = new Hashtable( );Find a
Placeand draw a shape around it://Find a location object index = 1; MapPoint.Location center = map.FindResults("Redmond, WA").get_Item(ref index) as MapPoint.Location; center.GoTo( ); //Now add a shape MapPoint.Shape shape = map.Shapes.AddShape(MapPoint.GeoAutoShapeType.geoShapeOval, center, 5, 5);Set a unique name for this shape. Having a unique name is important because we will later use it as a key to retrieve the original shape location from the hash table:
    //Set a unique name
    shape.Name = "Shape1";
Add the original location to the hash table:
    //Add the shape to the hashtable
    //Persist the location in a hashtable
    hTable.Add(shape.Name, shape.Location);
Make the shape invisible by sending it to the North Pole :
    //Toggle process
    //Find some obsucre location - a pole
    MapPoint.Location pole
        = map.GetLocation(0, 0, 2000);

    //Send shape to the pole
    shape.Location = pole;
Bring the shape back to the original location when needed:
    //Get the original location
    MapPoint.Location originalCenter
        = hTable[shape.Name] as MapPoint.Location;
    //Set original location back
    shape.Location = originalCenter;
This method works well within a single application session. However, if you want to persist the shape across the application sessions, you may have to persist the shape name and the original location in an external store, such as a config file or a text file.
Now that you know how to draw shapes and customize their look and feel, it’s time to explore using the shapes for location information.
Querying Shapes
You can use a shape to query a dataset to find the matching records that reside within that shape. To find out how many records or locations are contained within the specified shape, use the querying shapes technique.
Here is a sample scenario: you have a list of customers spread across the United States. You happen to be in Chicago on a business trip, and you want to find out how many of your customers are within 50 miles of where you are staying so that you can visit them. You create a circle shape with 50-mile radius and query for all customers that are contained within this circle shape. The following code shows this implementation:
    //Using the MapPoint Sample sales data from mdb file
    string filePath = @"C:MApPointDataClients.mdb!Addressestable";
    //Define missing fields
    object missing = System.Reflection.Missing.Value;
    //Import data and create a dataset
    MapPoint.DataSet dataset =
            map.DataSets.ImportData(filePath, missing,
            MapPoint.GeoCountry.geoCountryUnitedStates,
            MapPoint.GeoDelimiter.geoDelimiterDefault,
            MapPoint.GeoImportFlags.geoImportAccessTable);

    //Now Find O'Hare Airport in Chicago (Airport Code ORD) to draw a circle around
    //Find a location
    object index = 1;
    MapPoint.Location location =
       (MapPoint.Location) map.FindResults("ORD").get_Item(ref index);

    //Draw a circle around this location with 50 mile radius
    MapPoint.Shape shape  =
        map.Shapes.AddShape(MapPoint.GeoAutoShapeType.geoShapeOval, location, 50, 50);

    //Now query for customers that fall within this shape
       MapPoint.Recordset records = dataset.QueryShape(shape);

    //Customer Name field index from the source file
    object fieldIndex = 2;

    //Now loop through the records
    if(records != null && !records.EOF)
    {
        records.MoveFirst( );
        while(!records.EOF)
        {
          //Store the address - you need to meet this customer
          . . .
          records.MoveNext( );
        }
    }
This method works well for querying records based on distance (such as the 50-mile radius) constraint. However, don’t you think it would be easier if you could query for the records based on time constraints instead of just a distance constraint? You can do this using drivetime zones .
Working with Drivetime Zones
A drivetime zone
is a free form polygon shape that represents the maximum driving
distance from a location on a map within a specified amount of time.
In our example, you can modify the query to be: “Find all customers
that can be reached within 60 minutes of driving from O’Hare
Airport.” So, a drivetime zone is essentially a shape that can be
added to a map around a prespecified location. You can add a
drivetime zone shape using the Shapes.AddDrivetimeZone method:
    //Add a 60 minute drivetime zone around a location
    MapPoint.Shape shape =
       map.Shapes.AddDrivetimeZone(location,
                  60 * MapPoint.GeoTimeConstants.geoOneMinute);
This method uses the location around which the driving
distance is calculated to express the time value in a GeoTimeConstants enumeration. This
enumeration provides values for days, hours, and minutes.
A 60-minute drivetime zone is shown in Figure 3-17.
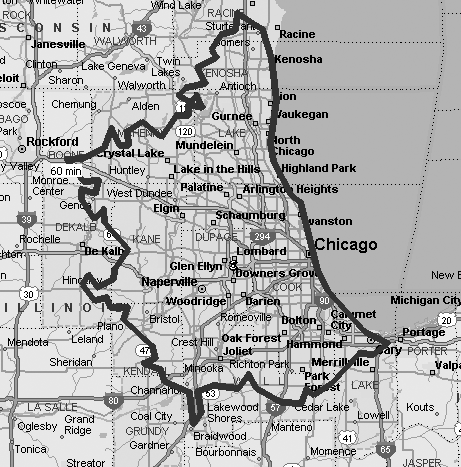
Once you have the drivetime zone, you can use the shape like
any other MapPoint shape to find the locations that fall inside that
shape using the DataSet.QueryShape method.
When thinking of customers all across the United States, it is sometimes helpful to find out which customer falls into which account representative’s territory. When you have 20 account representatives, it is a common practice to assign them geographic territories to streamline account management and communication processes. You can use the MapPoint 2004 APIs to display territory maps based on external information.
Working with Territories
MapPoint 2004 provides APIs to generate and display
territories based on external data (such as a text file or Access database).
As with importing any other location data, the DataSets object is used to import
territories. The DataSets object
provides the ImportTerritories
method to import territories from any source supported by the ImportData method.
The following code shows how to create a territory map using the 2004 U.S. presidential election results:
    //Using the MapPoint Sample Territory data from txt file
    string filePath = @"C:MapPointData2004Elections.xls";
    //Define fields
    object missing = System.Reflection.Missing.Value;
    //Import data and create a dataset
    MapPoint.DataSet dataset =
        map.DataSets.ImportTerritories(filePath, missing,
        MapPoint.GeoCountry.geoCountryUnitedStates,
        MapPoint.GeoDelimiter.geoDelimiterDefault,
        MapPoint.GeoImportFlags.geoImportExcelSheet);

    //Zoom to the territory map
    dataset.ZoomTo( );
The previous code yields the territory map shown in Figure 3-18.
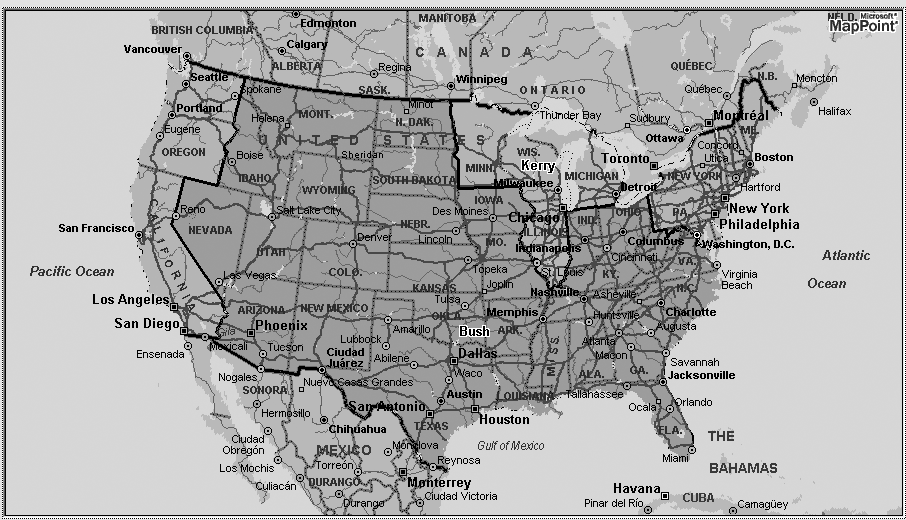
Territories are one of the most interesting features of MapPoint 2004; however, they are also a feature that has serious limitations in terms of what you can do with the MapPoint 2004 APIs. For example, if you want to query a location to determine which territory it belongs to, there is no API that can be used for this purpose. However, there is a workaround to achive this.
Determining a Location’s Territory
While there is no territory query API available in
MapPoint 2004, you can determine a location’s territory using a
combination of other APIs, specifically Map.ObjectsFromPoint and Dataset.QueryCircle methods, in MapPoint
2004.
Say, for example, you are given the location “Redmond, WA,”
and now you have to determine whose sales territory it belongs to.
In order to do that, you must import the territories into a dataset using the Datasets.ImportData method:
    //Import territories as Data
    //Using the MapPoint Sample Territory data from Xls file
    string filePath = @"C:SampleTerritories.xls";
    //Define fields
    object missing = System.Reflection.Missing.Value;

    MapPoint.DataSet dataset =
          map.DataSets.ImportData(filePath, missing,
          MapPoint.GeoCountry.geoCountryUnitedStates,
          MapPoint.GeoDelimiter.geoDelimiterDefault,
          MapPoint.GeoImportFlags.geoImportExcelSheet);
Now that your territories are available in a dataset, find the
input location using the Map.FindResults method:
    //Now find input place
    object index = 1;
      MapPoint.Location loc =
         map.FindResults("Redmond, WA").get_Item(ref index)
         as MapPoint.Location;
Using this location, use the hit-detection method to find objects from the corresponding point:
    //Get objects from the given point
    MapPoint.FindResults findres =
     map.ObjectsFromPoint(map.LocationToX(loc), map.LocationToY(loc));
For each of these objects, see whether there is any territory-representing location present in the dataset that you created at the beginning:
    //Now for each object see if there is any territory representing
    //location in the dataset
    for(int i=0; i<findres.Count;i++)
    {
       object ind = i+1;
       MapPoint.Location loc1
           = findres.get_Item(ref ind) as MapPoint.Location;
      if(loc1.Type != MapPoint.GeoShowDataBy.geoShowByRegion1)
         continue;
      double radius = 1;
      bool notfound = true;
      object fieldIndex = 2;
      while(notfound)
      {
        //Query the dataset
        MapPoint.Recordset recs
             = dataset.QueryCircle(loc1, radius);
        while(!recs.EOF)
         {
            //Found territory!
            MessageBox.Show(recs.Fields.get_Item(ref fieldIndex).Value.ToString( ));
            notfound = false;
            i = findres.Count + 1;
            break;
         }
          if(radius > 30)
           {
               //For performance and accuracy reasons
               //Don't search any further
               //Failed to find the territory
               break;
           }
          else
           {
             //Increment the radius and search
              //Dataset again
              radius = radius + 5;
           }
        }
      }
All that happens in this code is a query of the dataset around
each location (returned by the ObjectsFromPoint method) using the
QueryCircle method by increasing
the radius until we find a territory or until the radius execeeds 30
miles (a hypothetical value that can be increased or reduced
depending on your territory locations). This technique works for
most of the territories except when they are too small (for example, if you
find multiple territories in a 1-mile radius).
Where Are We?
In this chapter, you have learned how to work with native demographic data and your business data to generate data maps in different map styles. You have also seen how to import data into MapPoint from variety of data source such as text, Excel, Access, SQL, and so on. We also have examined working with shapes, drivetime zones, and territories.
Working with the DataSets and
Shapes collections can be among the
most interesting tasks of the MapPoint APIs. These two objects provide
the core of the location-based business intelligence processing power
within MapPoint 2004.
In the next chapter, I will shift the focus slightly from the core MapPoint 2004 to focus on performance, interfacing with other applications by writing Add-Ins, and making MapPoint 2004 work with GPS devices.