
The default style configuration of matplotlib is made to satisfy the requirements of a wide audience, but this means that we always have to spend some time customizing the details that we care about. In this recipe, we want to show how to create custom and reusable styles for matplotlib so that we make our changes only once.
All the styles that matplotlib can use are stored in a directory called stylelib, under the configuration directory of matplotlib. To check the path of this directory, we can use the get_configdir() method:
In [1]: import matplotlib

In [2]: matplotlib.get_configdir()
Out[2]: u'~/.matplotlib'
In this directory we will store the files that specify our custom styles.
First, we will create the file that contains all the specifications of our style:
axes.titlesize : 12
lines.linewidth : 2
xtick.labelsize : 8
ytick.labelsize : 8
figure.facecolor: white
figure.edgecolor: 555555
xtick.color: 555555

axes.color_cycle: E54A22, 3A89BE
                   # E24A33 : red
                   # 348ABD : blue

axes.facecolor: EEEEEE
This style must be saved in the matplotlib config directory under the stylelib directory with the name mystyle.mplstyle. Right after creating this file we can use the style:
import matplotlib.pyplot as plt
import matplotlib
import numpy as np
plt.style.use('mystyle')
x = np.linspace(-2*np.pi, 2*np.pi, 100)
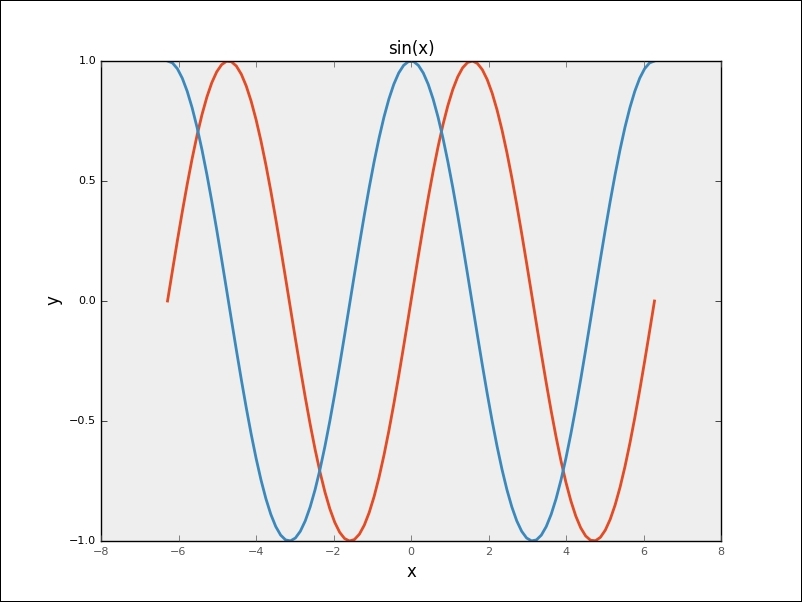
plt.title('sin(x)')
plt.xlabel('x')
plt.ylabel('y')
plt.plot(x, np.sin(x))
plt.plot(x, np.cos(x))
plt.show()The result is as follows:
Each line in the file mystyle.mplstyle modifies one of the elements of the matplotlib style. In the first line, we set the size of the font of the title of the figure to 12, in the second one we set the width of the lines to 2, and so on. The style is activated by passing a string with the name of the style to be used to the matplotlib.style.use()method, the name of the style is specified by the filename, and we can check all the styles available by printing plt.style.string.available.