
Chapter 4
Packet Capture Analysis
Abstract
This Chapter focuses on the development of P2NMAP-Analyze.py, a new Python script that performs analysis operations on .ipdict observation files that were created by the P2NMAP-Capture Script. This is accomplished by extending the ipObservationsDictionary Class to include several key analysis methods. These methods extract key information, such as observed servers and clients, as well as key server / client interactions.
Keywords
P2NMAP-Analyze.py
.ipdict files
port lookup
host lookup
geographic IP Mapping
STDOUT
client
server
port
IP Address
port description
histogram
“All great truths are simple in final analysis, and easily understood; if they are not, they are not great truths.”
Napoleon Hill
Packet Capture Analysis
Now that we have “P2NMAP-Capture.py” in hand, a Python Packet Capture Tool that performs well on both Windows and Linux platforms, along with creating a dictionary of time collected results, we now can perform some useful analysis of the collected data.
As you observed in Chapter 3, the tool produces two output files:
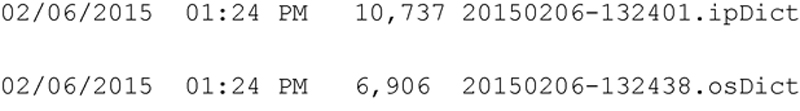
20150206-132401.ipDict contains the Internet Protocol Observations Dictionary, and 20150206-132438.osDict contains the Operating System Observations Dictionary. In this chapter I focus on the analysis of the .ipDict observations.
A key aspect of the P2NMAP approach is to passively monitor network traffic and record the results without ever placing a packet on the network. A second key is to collect data over a period of time, measured in at least hours - if not days. This approach is in direct contrast with active mapping methods that probe network devices, and there are advantages and disadvantages to both methods.
One of the key advantages of the passive approach is to be able to observe the behavior of network devices over the course of days or even weeks and map behaviors of both servers and clients over the period.
Yet another important aspect of the technical approach is the development of the ipObservationDictionary Class. Using a class for this purpose allows us to re-use the class as a starting point for the development of the analysis methods. For example, the class already contains methods to save and load IP Dictionary Files, along with methods to print out the Internet Protocol observations stored in the currently loaded dictionary. By extending the capabilities of the class and the resulting instantiated objects, we can provide a straight-forward method to advance the analysis capabilities now and in the future.
The initial set of methods that are to be added to the ipObservationDictionary Class over the capture period include:
1. Load an Observation File
2. Print out all the recorded observations
3. Print the unique list of identified servers along with ports in use
4. Print the unique list of identified clients
5. Print the unique connection list (servers to client) with port details
6. Print 24 hour histogram of activity for each unique server / client connections
In addition, to this base set of analysis items, I have also provided three special lookups to provide additional information for the analyst. They include:
1. Port Number to Port Name Conversion
2. Host Name Lookup based on IP Address (note this requires Internet Access)
3. Country Location based on the IP Address
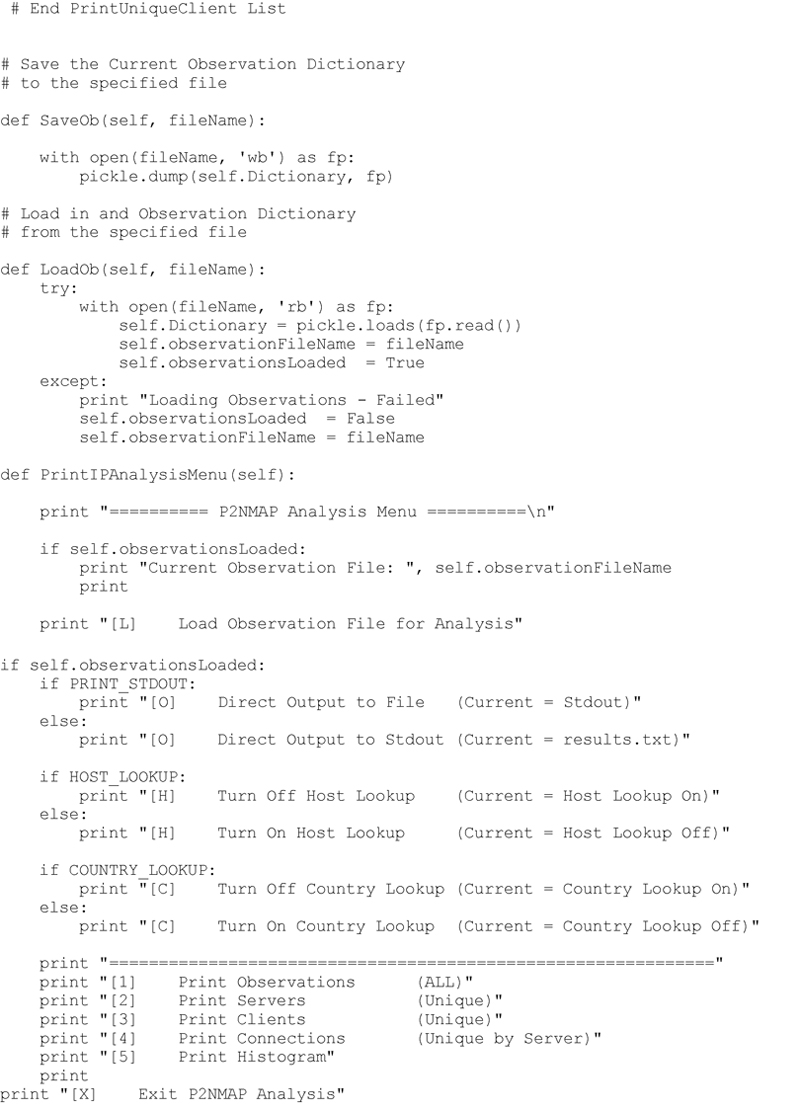
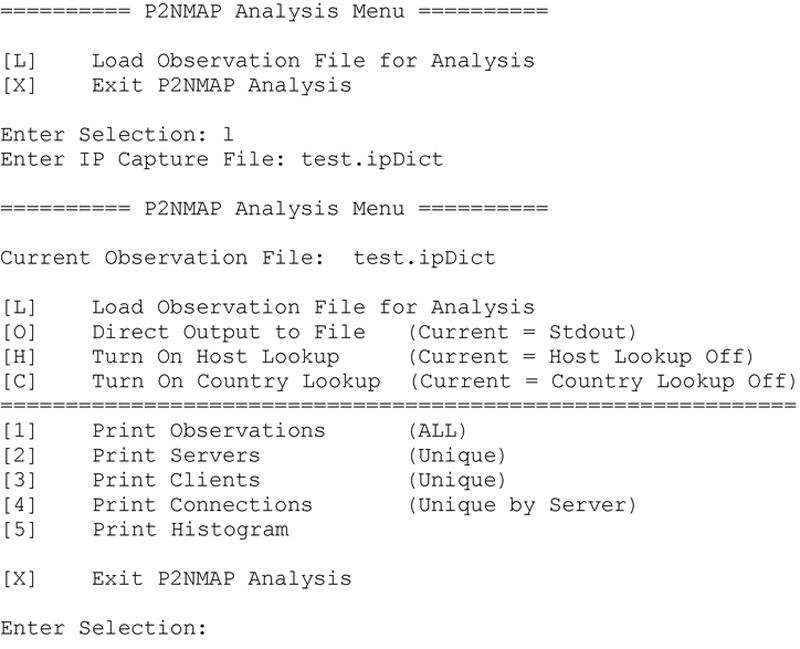
To access these capabilities I have created a simple menu driven script, P2NMAP-Analyze.py to perform the defined analysis operations. Figure 4-1 depicts the P2NMAP-Analyze.py menu.
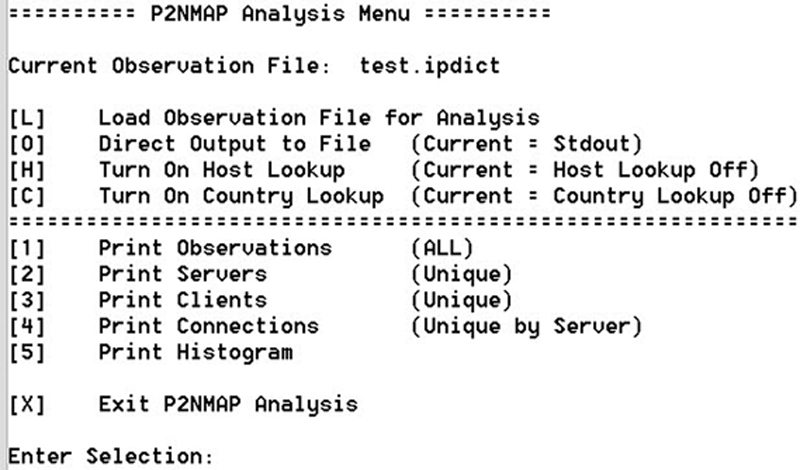
Figure 4-1 P2NMAP Analysis Menu.
In the following sections, I will discuss the operation, implementation and rationale for each menu operation.
Setting up Options for Analysis
Before we begin to execute the analysis methods themselves, several options are necessary to set within the interface. They include:
1. Loading an Observation File
2. Directing the Program Output
3. Specifying the Host Lookup Option
4. Specifying the Country Lookup Option
Loading an Observation File
Loading an observation file is quite straight-forward. During the capture process I saved the ipDict file using Python’s built in Pickle Module. The Python Standard Library module, pickle provides the ability to pickle and un-pickle an object, where pickling converts any Python object such as a list, set, dictionary or any other object into a character stream. The character stream contains all the information that would be necessary to reconstruct the object within another Python script. This is exactly what we wanted to do as I have de-coupled the capture and analysis capabilities of P2NMAP. Since I wanted to provide a completely Python-based solution for Passive Network Mapping, I separated the operations in this manner.
The only two methods that are necessary to accomplish this are:

where self.Dictionary is the Dictionary object I wish to save or load. The object fp is the File Pointer to either the output or input file.
I added the following method to the class IPObservationDictionary as shown below:
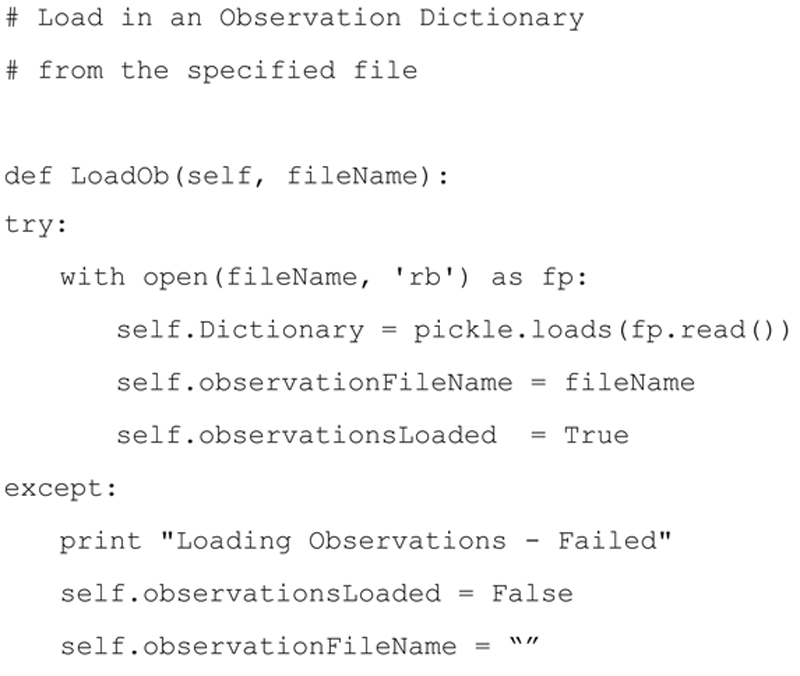
If the method is successful it sets the object attributes:
▪ self.observationsLoaded to True
▪ self.observationFileName to the file name that was loaded.
These two attributes are used by other methods within the class IPObservationDictionary.
However, if the load fails, the self.observationsLoaded attribute is set to False and the self.observationFileName is set to blank. In addition an error message is displayed to the user.
As you will see during the operation of the script, no other operations will be available to the user until a valid observation file is successfully loaded.
Direct Program Output
One of the questions that I get quite often is: How do I use the same print statement to direct output to either ‘standard out’ or to a file. The problem with using the redirect symbol, ‘ > ’ as shown here….
$ python P2NMAP-Analysis.py > results.txt
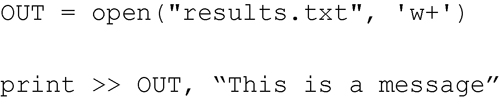
….is that all messages are sent to the results file including prompts, informational and warning messages. This can be solved using the following method in Python:
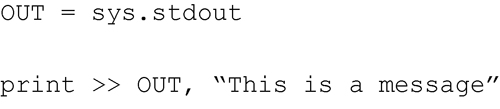
I create a variable named OUT and set it equal to the result of an open method such as the one shown below. I then preface every print message with print >> OUT, and whatever follows is then written directly to the output file, regardless of the complexity. This will ensure that the output file will look exactly like the output that would have been displayed on the screen using ‘standard out’.
The question then becomes, how do I then direct the output to ‘standard out’?
That turns out to be the easy part if you know your way around the Python Standard Library module. If the OUT variable is global, then by allowing the user to change the variable, the output will be directed to the proper output, in this case either standard out or the file results.txt.
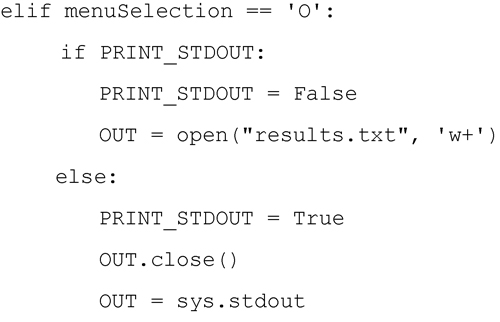
To implement this in the module, I create a toggle allowing the user to change the output direction between ‘standard out’ and a file. This way, the analyst can review the output on the screen and then once they are satisfied with the results they can toggle and have the function output directed to the file. Note, this is a good technique to use within any forensic related script. Here is the code excerpt that performs the toggle when the user selects the ‘O’ output option from the menu. Notice that I perform the close method, OUT.close() when switching from file output back to STDOUT. This ensures that the file will be closed and all data will be written to the file. Also, I open the output file using “w+”, meaning that data will be appended to the results.txt file.
Specifying the Host Lookup Option
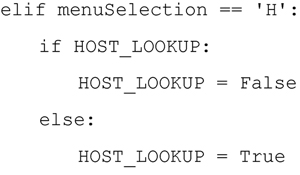
One of the important aspects of passive network capture is the mapping of IP addresses to Host Names. This is done using network address translation, in this case from IP address to Host Name. In the spirit of this book (so far), I want to perform this lookup using native Python code and Python Standard Libraries. It turns out that this is quite simple to do, but just a word of warning …. this will take time and Internet access to accomplish. Once again I will use the toggle method within the menu system to provide the user with the option of turning Host Lookup on or off, with the default being Host Lookup is off.
The HOST_LOOKUP variable is then evaluated by each of the analysis methods. If the HOST_LOOKUP is true, then the analysis methods will translate the IP address into the related host name. The code to perform this lookup utilizes the Python Standard Library Module, socket and only requires a single socket call to accomplish this:
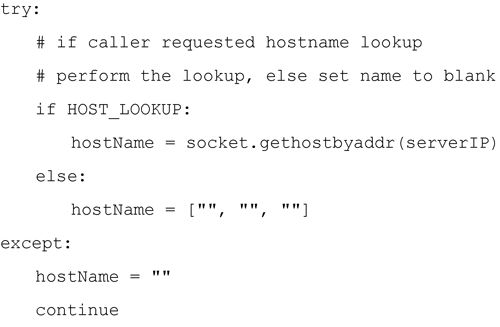
For our application we are only interested in the first element of the triple, the name of the host. If exceptions occur during the call (in other words, the host name could not be associated with a specific IP address), I fill the triple with blanks so when those elements are accessed in the code, they are simply printed as blanks.
Specifying the Country Lookup Option
When investigating server and client IP addresses, one of the typical questions that arises is “Where is the IP located geographically?“ In some cases this is difficult to confirm if the server or client are attempting to anonymize their locations, however for most cases the mapping of IP address to a general geographic region is possible.
To handle this specific lookup I’m going to use a Python 3rd Party Library and dataset. The 3rd Party Library is pygeoip.
To install the pygeoip library within your Python Environment you can use pip. Pip is the most popular Python package management system, and is used to install and manage 3rd party packages written in Python. The pygeoip library is installed from the command line; note that the pip package management system must already be installed.
Once pygeoip is installed, you must also download the latest database from MAXMIND developer website at: http://dev.maxmind.com/geoip/legacy/geolite/
For the examples in this chapter I downloaded the GeoLite Country Binary/Gzip Version as shown in Figure 4-2. I then unzipped and placed the geo.dat file in my source directory for easy access. Note, I changed the name to geo.dat as the unzip generates GeoIP.dat, this way when I download updates I can keep track of new vs old.
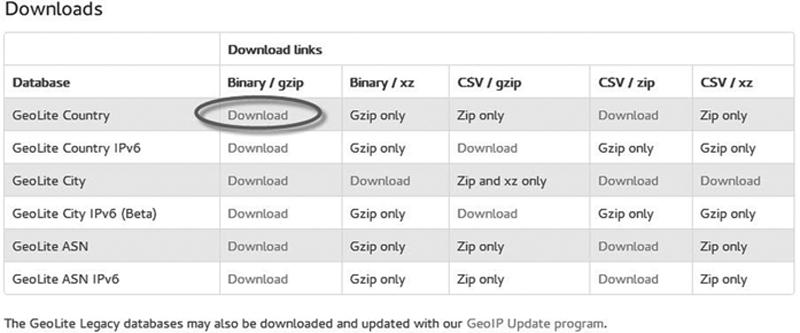
Figure 4-2 MAXMIND GeoLite Country Database Binary/Gzip Version.
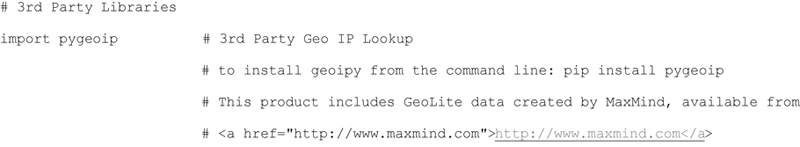
Following the instructions on the MAXMIND web site, I included the statement as required when importing the 3rd Party Library as shown below.
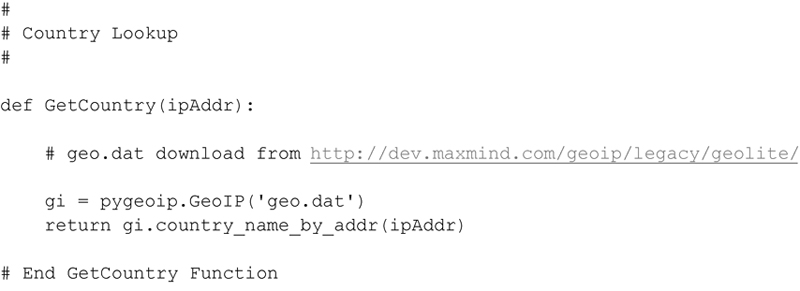
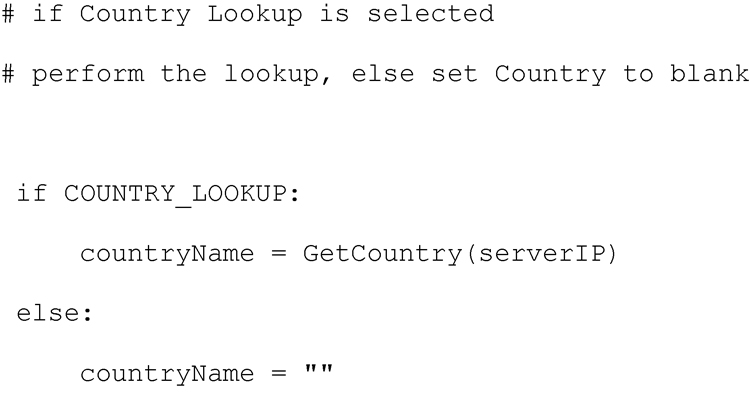
Now that the pygeoip library and associated database geo.dat are installed, I can use them to associate an IP Address with a country. I created a simple function to call and return the country name. If no country can be associated with the given IP address a blank string is returned.
As with the Host Lookup Method, I provide a toggle that will either set the COUNTRY_LOOKUP variable to True or False depending upon the current state. This is accomplished by the user specifying ‘C’ option as shown here:
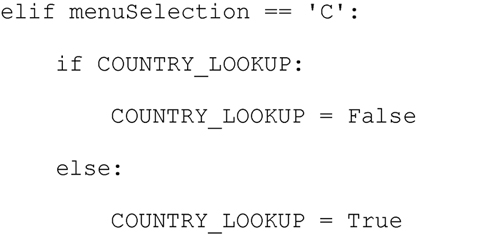
Then anywhere in the code where inclusion of the Country Name would be appropriate the COUNTRY_LOOKUP variable is interrogated and used accordingly.
Performing Analysis
Now that the perfunctory setup is complete, we can execute the individual analysis operations. They include:
1. Printing all observations contained within the loaded observation file
2. Printing the Observed Server List
3. Printing the Observed Client List
4. Printing the Observed Server to Client Connections
5. Printing the Histogram of Observations
Printing Observations All
The printing out of all the Observations simply requires extracting each dictionary entry and printing out the contents. This includes the Server IP Address, Client IP Address, Server Port Number, Port Type (TCP or UDP) along with the number of observations of this unique combination occurring during each hourly period. The method to perform this operation is shown below.
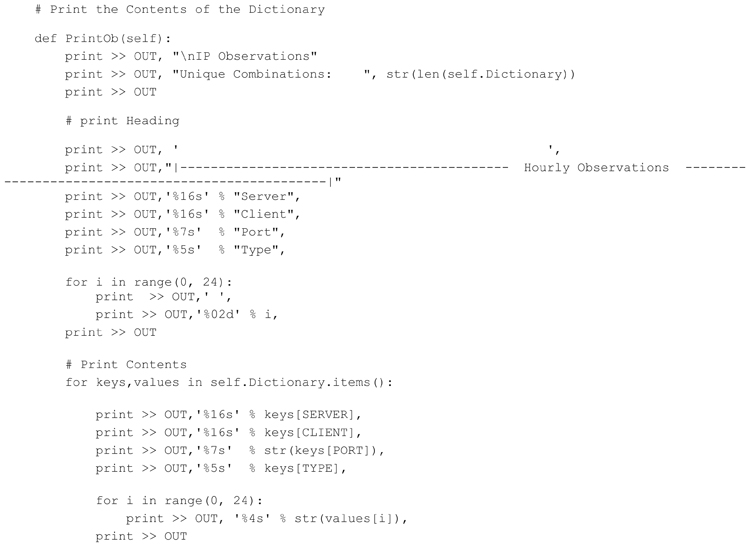
Executing this code produces the following (abbreviated) result

Printing the Observed Servers
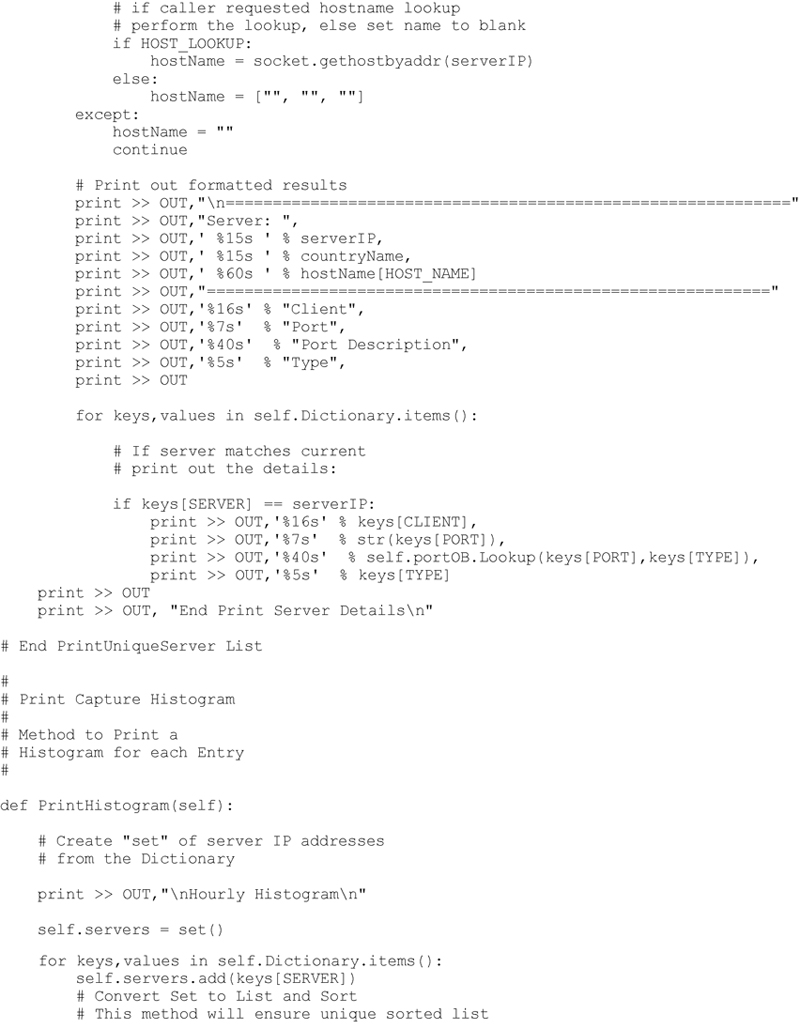
The next analysis function will iterate through the dictionary and provide a sorted list of observed servers. For each server a list of observed service ports supported by the server are also listed. In addition, details such as geolocation (i.e. country), host name and port description will be included based upon the settings specified by the user. The method developed to extract these details from the observations dictionary is shown below.
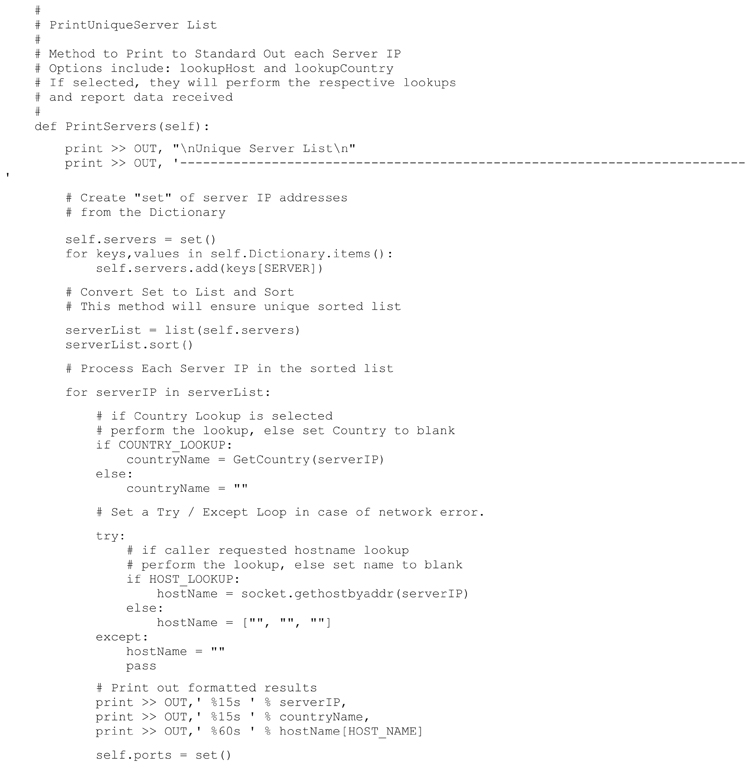
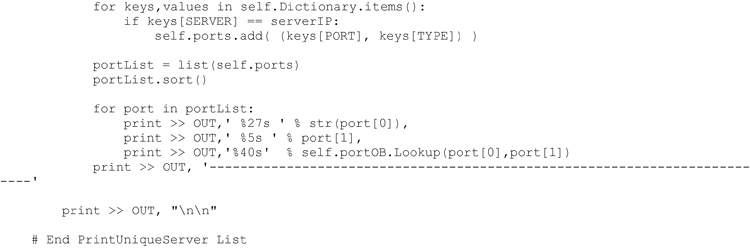
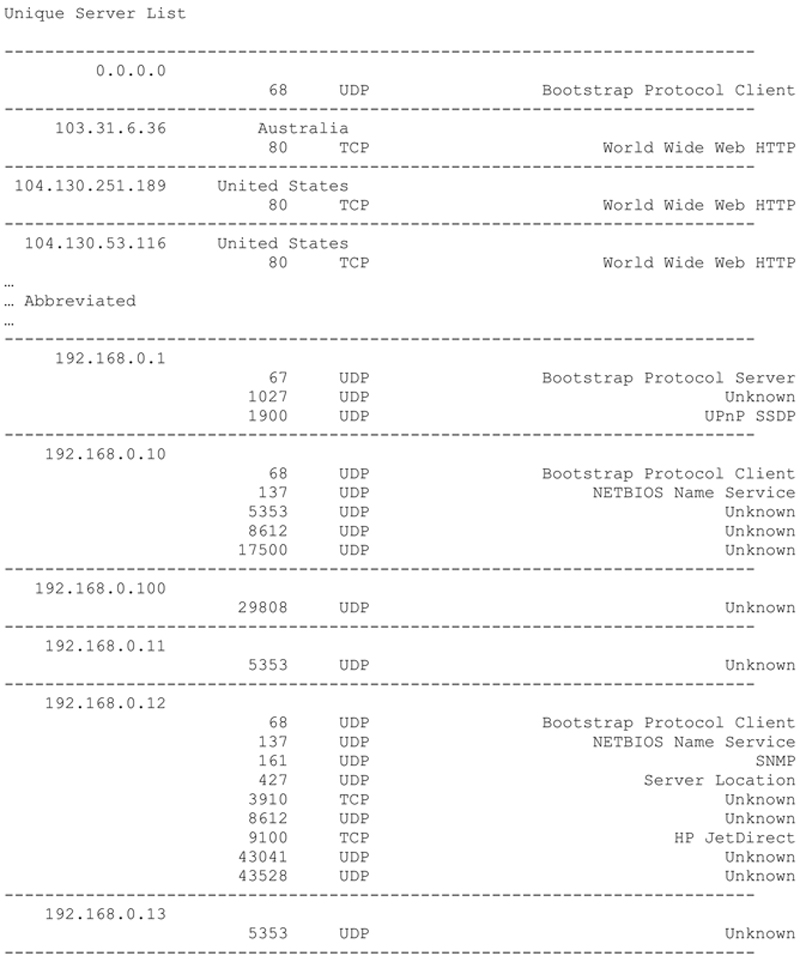
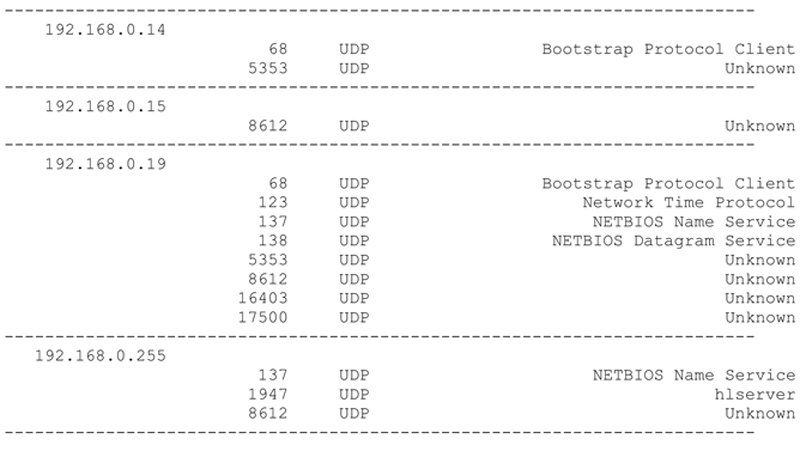
Executing this code produces the following (abbreviated) result
Printing the Observed Clients
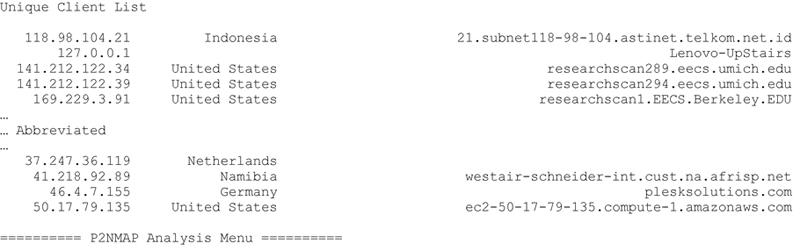
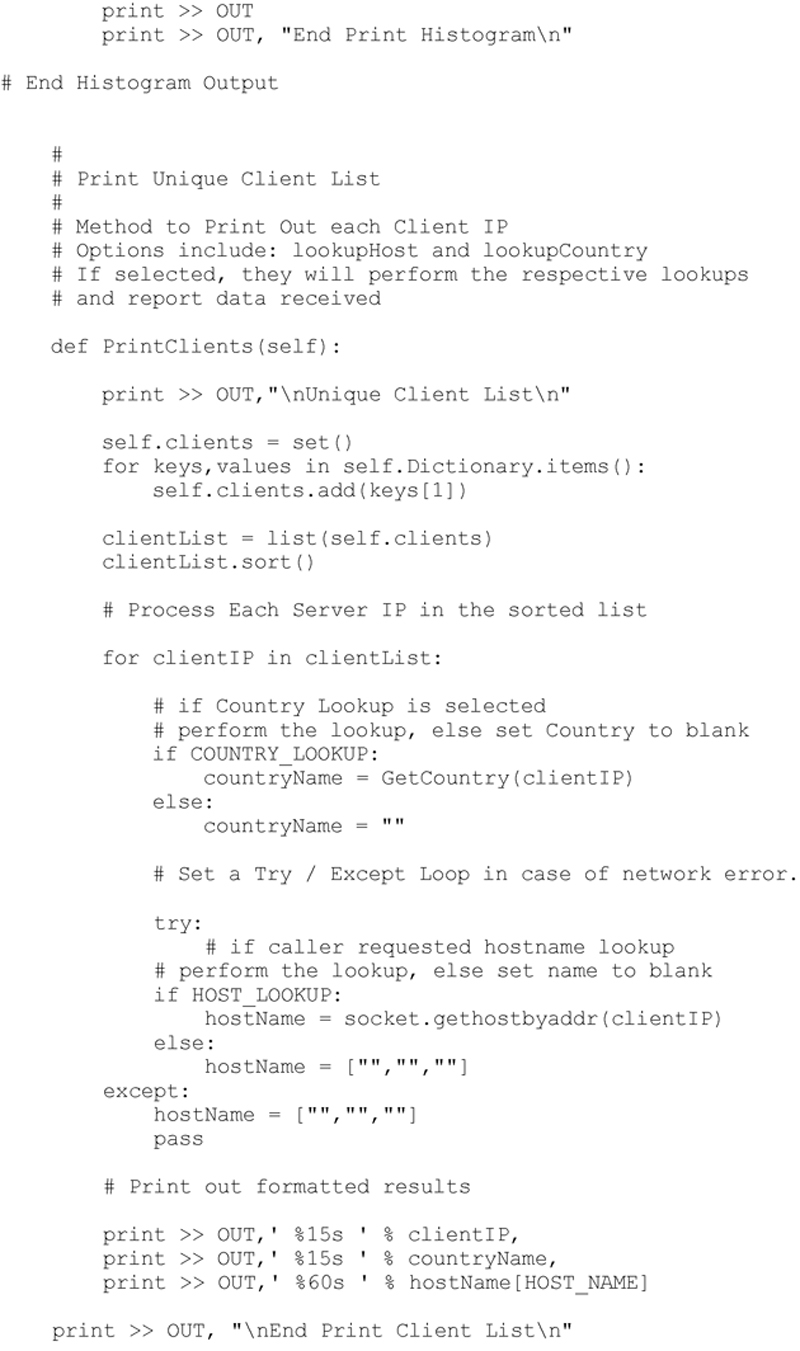
Extracting and printing the list of observed clients is accomplished in the same manner as that of the observed servers. Once again the output will include details such as geolocation (i.e. country) and host name if they are specified to be included by the user. The method developed to extract these details from the observations dictionary is shown below. One question you might ask is why is the client port not specified?
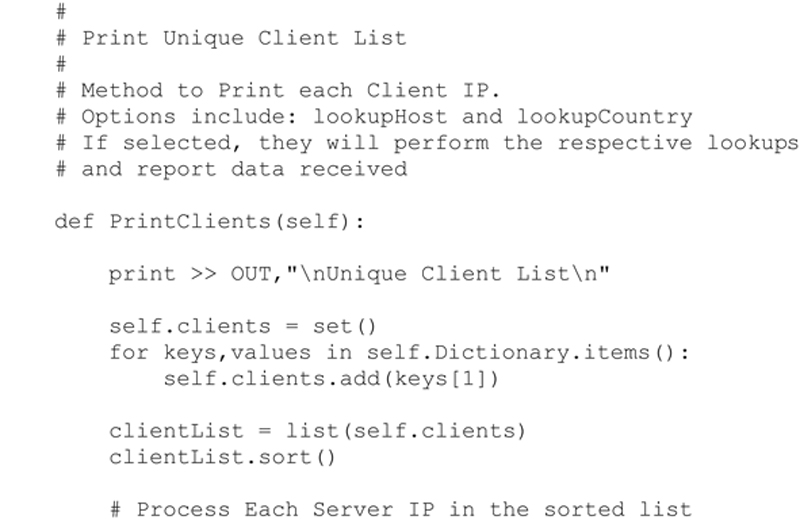
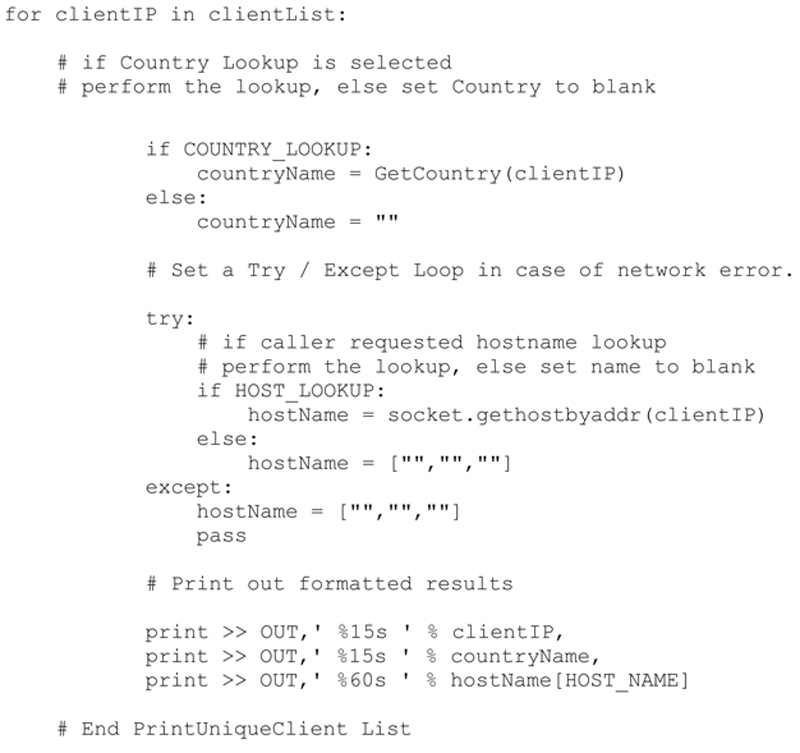
Executing this method produces the following (abbreviated) result:
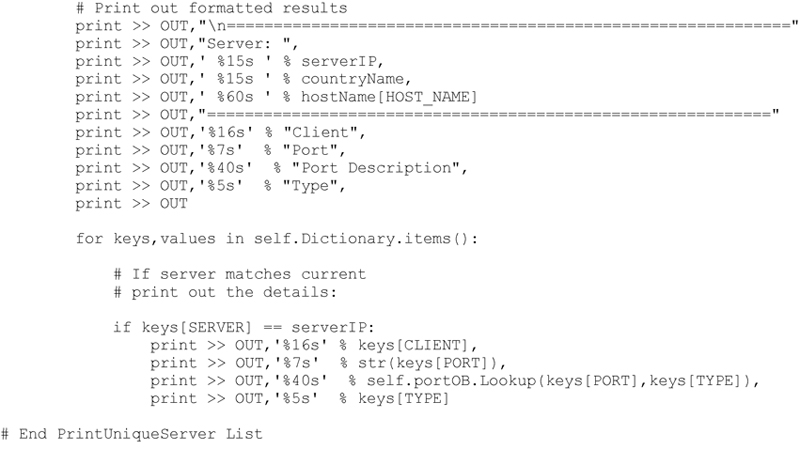
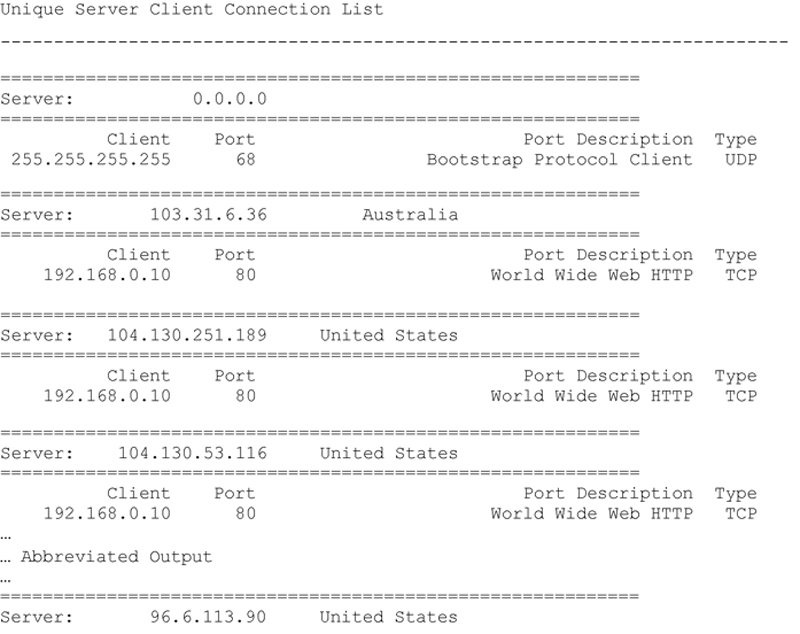
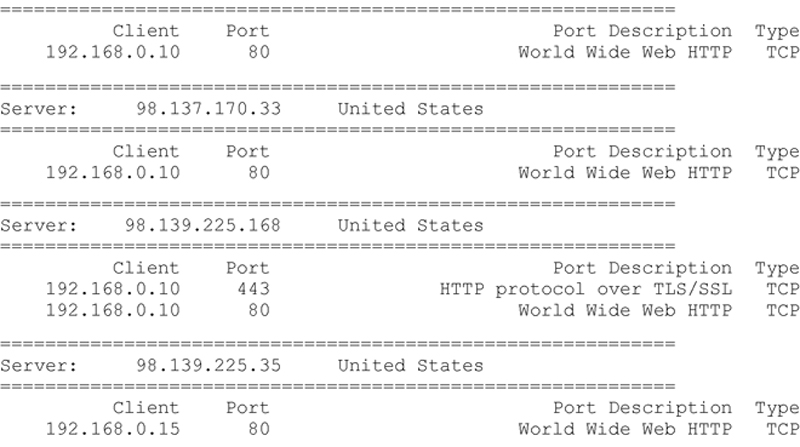
Printing the Observed Server to Client Connections
Another interesting way to view the results of the observation, is to list each server and include all client connections made to that server. This provides the comprehensive server / client connection list. This method is slightly more complex, since the dictionary must first generate the list of observed servers, and then generate a list of clients that connected over any port to that server. The method developed to extract these details from the observations dictionary is shown below.
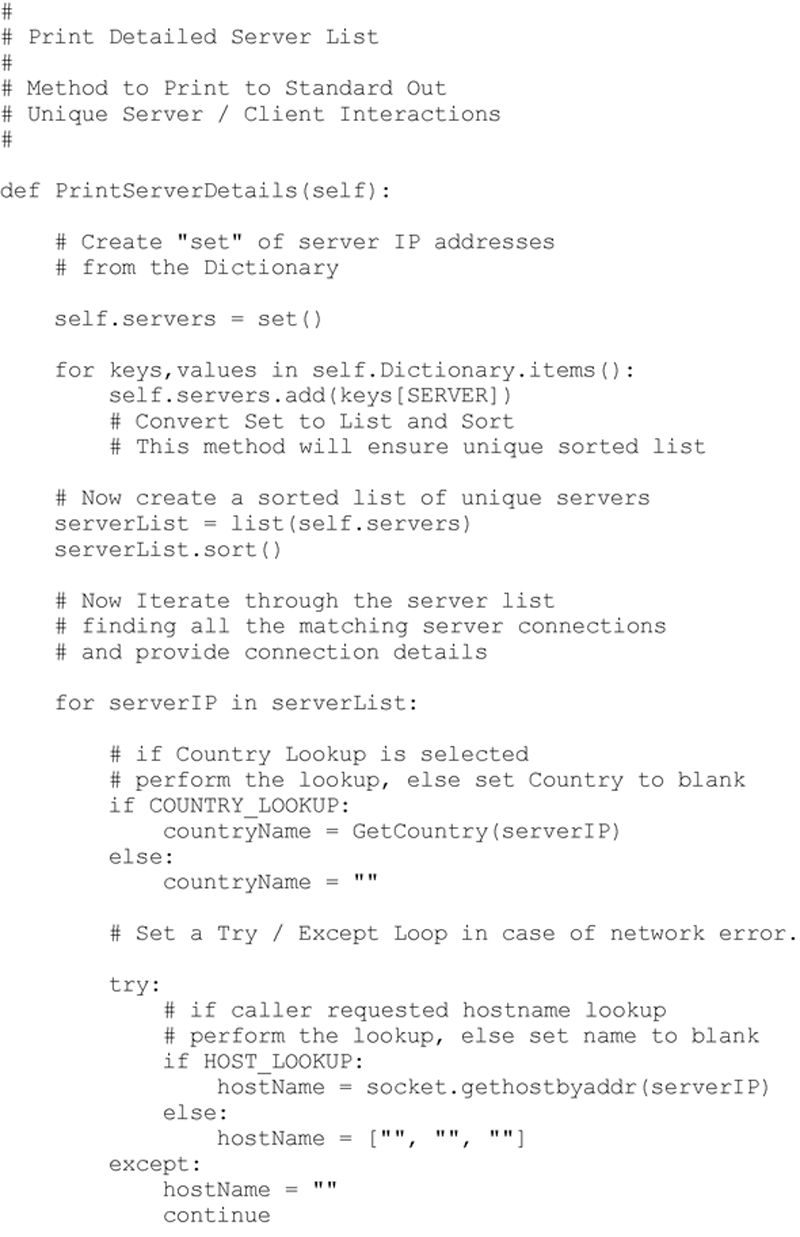
Executing this method produces the following (abbreviated) result:
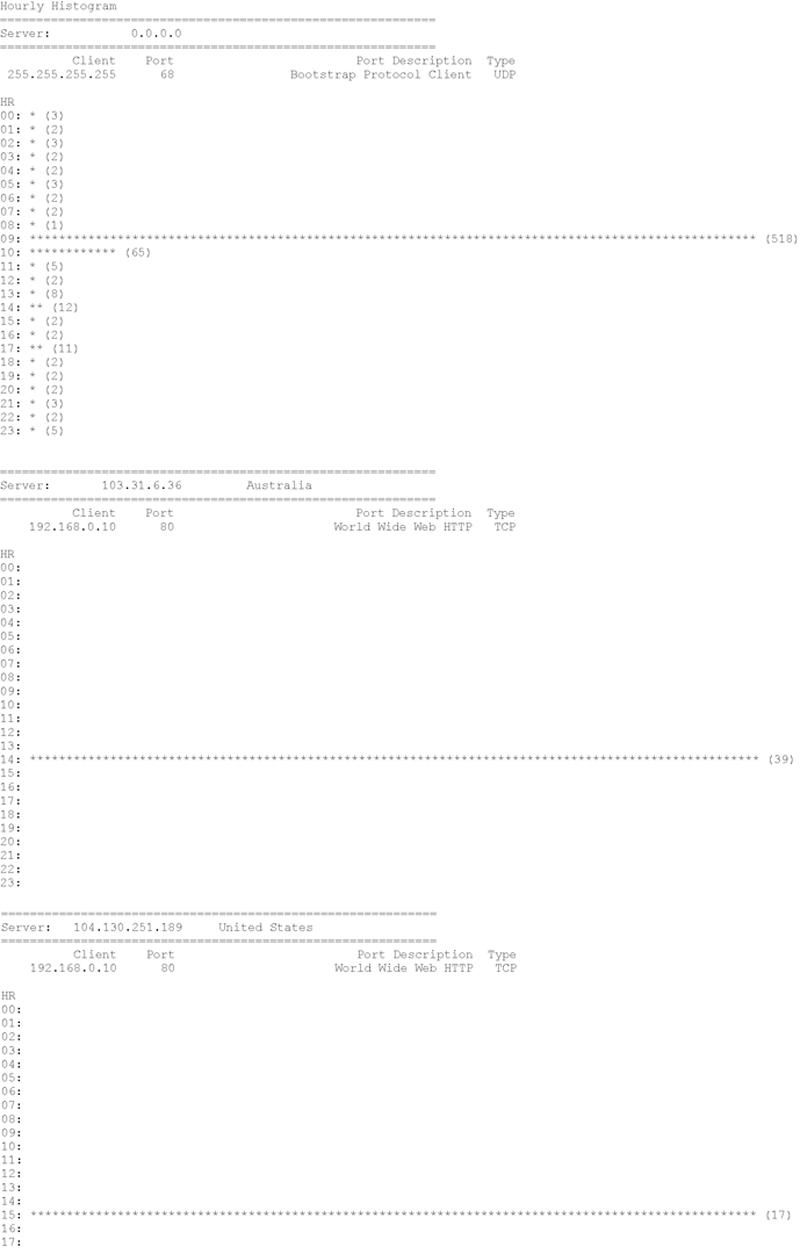
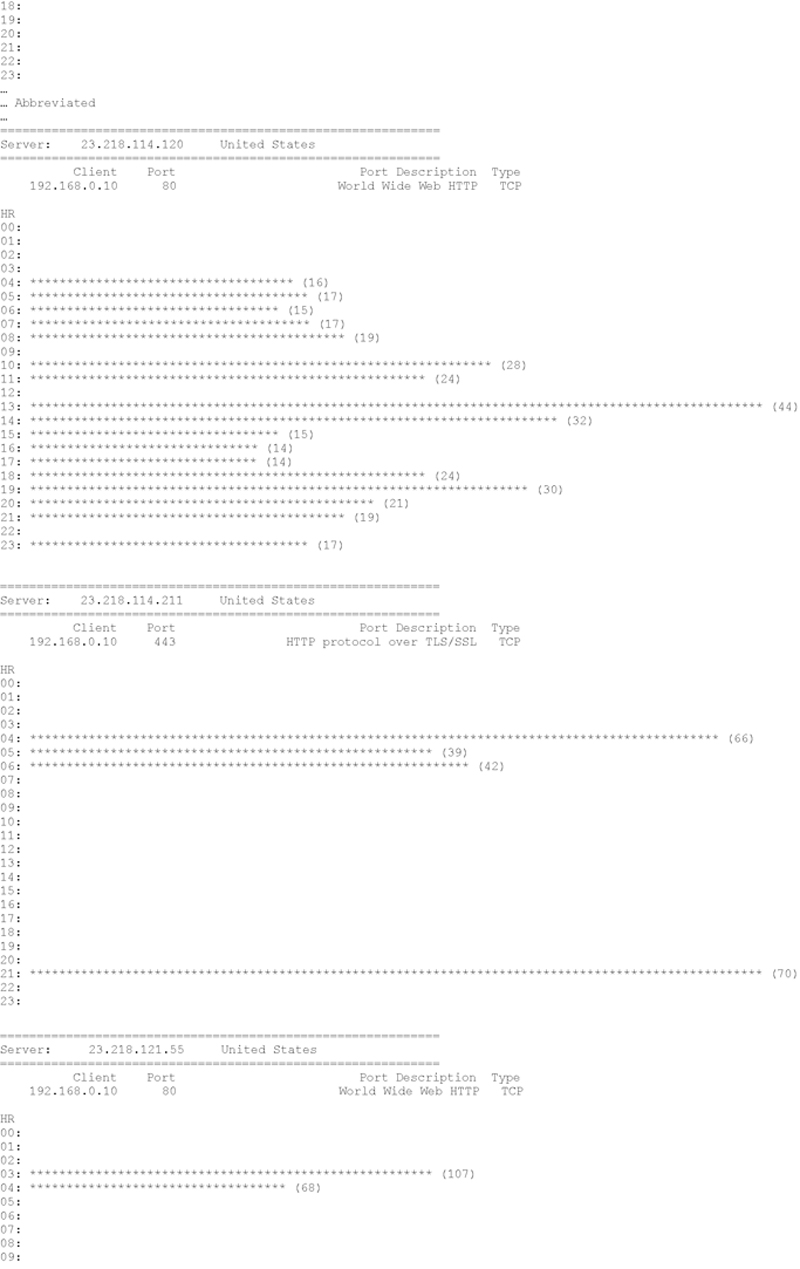
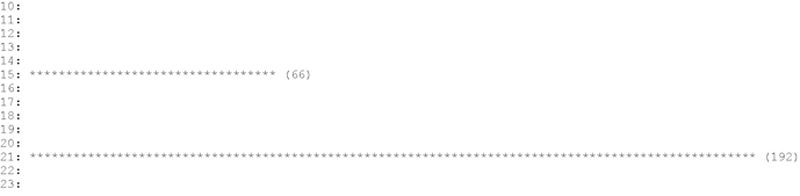
Printing a Histogram of Observations
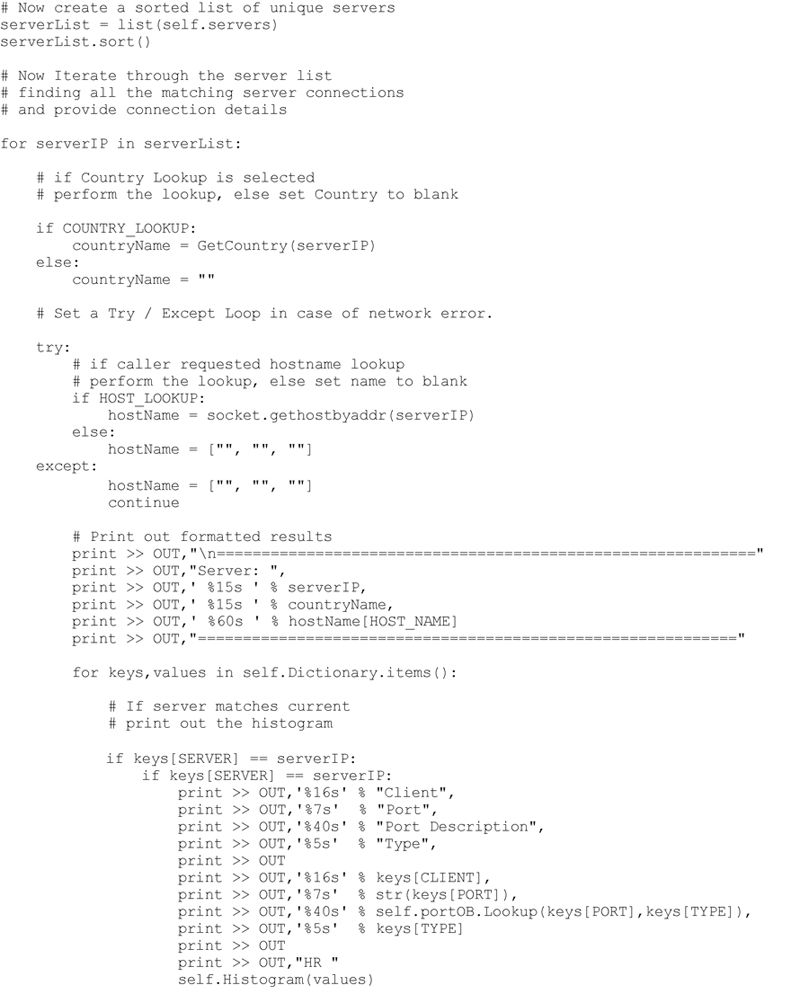
The final extraction will add to the detailed server / client connection list and provide a histogram of activities for each server and client interaction. The Histogram produced is for a 24 hour time table. If the P2NMAP-Capture script is run for multiple days the activities for each hour will be cumulative. This allows the investigator to quickly observe activities occurring at unusual times of the day, activities that occur only a small number of times, or possibly only once. This can potentially indicate a heartbeat or beacon generated by a malicious application. The method developed to extract these details from the observations dictionary is shown below.
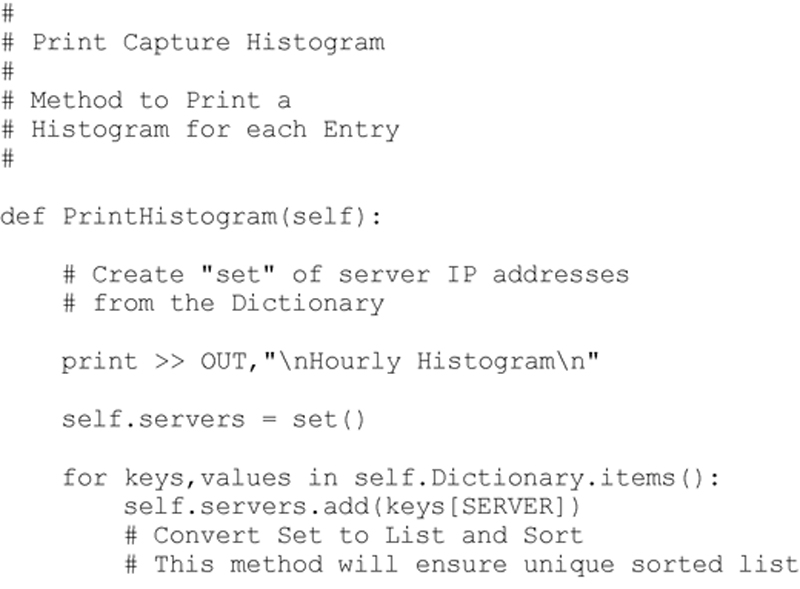
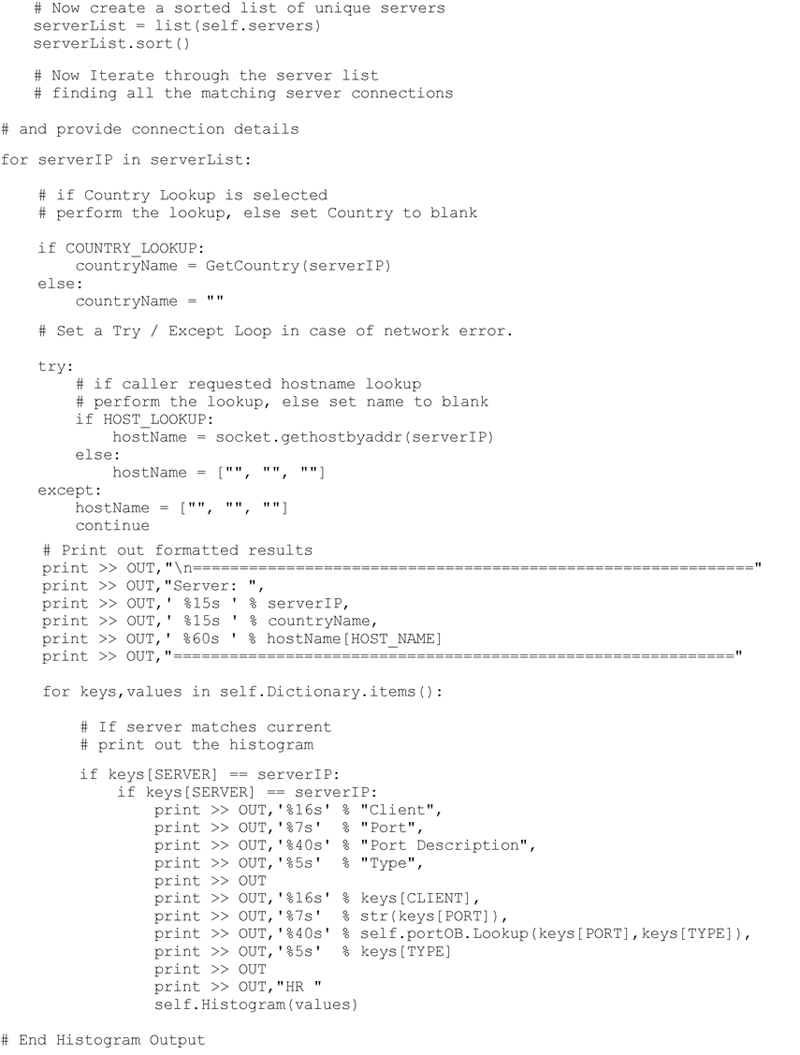
Executing this method produces the following (abbreviated) result
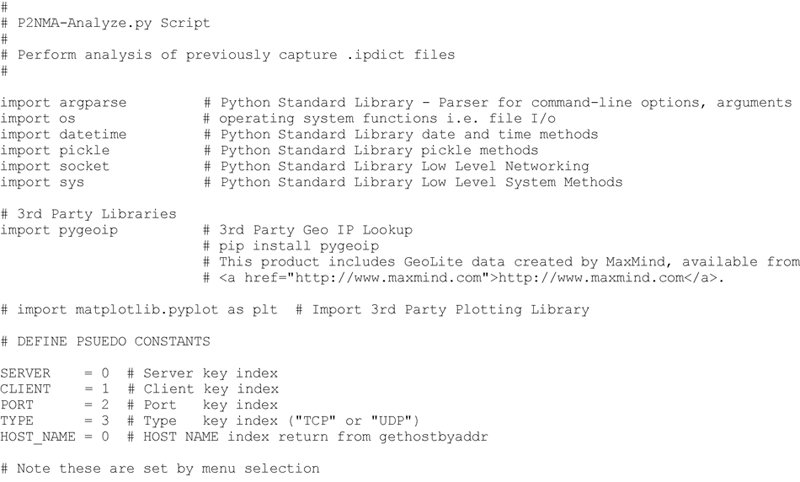
Final P2NMAP-Anaysis.py Script Complete Source Code
The final P2NMAP-Analysis.py script is shown here. Note that the entire script is a single Python file and requires no arguments to execute. However, there are a couple of assumptions.
1. The “geo.dat” file must be included in the source directory
2. The pygeoip 3rd Party Library has been installed using:
$ pip install pygeoip
or
C:> pip install pygeoip
3. You have a populated IP dictionary file that was generated by the P2NMAP-Capture script.


Now you are ready to execute P2NMAP-Analysis.py
$ python P2NMAP-Analysis.py
or
C:> python P2NMAP-Analysis.py
This will yield the following menu selections and you can start experimenting with the differing modes of operation and analysis functions.
Review
In Chapter 4, I leveraged the .ipdict file created in Chapter 3 using the P2NMAP-Capture Script. This file contains the complete dump of the IP observations dictionary. By utilizing this observations dictionary, I created several key methods within the ipObservationsDictionary Class. These methods perform operations including: Printing the complete IP Observations Dictionary, Generating a Comprehensive Server and Client List, Generating a detailed Server / Client Connection List and a detailed histogram of the observation data. In addition, I extrapolated key information from the observed data including Host Name based on the Observation IP Address, Detailed Port Descriptions based on the server ports in use and geographic location of many of the observed servers and clients. Finally, I created a simple menu driven interface that can be used to experiment with the newly created analysis methods.
Summary Questions
1. What additional analysis methods could be created from the observed data?
2. What filters could be created that would reduce the output and allow the analyst to focus in on targeted data? For example, “Generate a Histogram of any connections that occur less than n times during the observations. Or generate a server / client list for those devices operating outside the U.S.
..................Content has been hidden....................
You can't read the all page of ebook, please click here login for view all page.