
13
Forecast the ROI
The most reliable way to forecast the future is to try to understand the present.
JOHN NAISBITT
Six students in a row hurried into Konstantin Gonyshev’s small tattoo parlor one day this month with identical requests to ink a domino, and quick. Days earlier, Domino’s Pizza in Russia had announced a promotion that was supposed to run for two months offering lifelong free pizza to anyone who showed up with the company’s logo in a tattoo. But that morning, Domino’s posted on social media that it was ending the promotion—although those who were being inked right then could still make the midday cutoff.1
“More than a million people would have come to demand pizzas” if the promotion had lasted the full two months, guessed 24-year-old Natalia Koshkina, who got a small Domino’s logo tattooed above her left kneecap, just below a skull embellished with roses and butterflies. “After all, this is Russia,” she said.
Bargains and freebies are powerful draws here. The Soviet period—where foodstuffs were often cheap but in short supply—and the economic hardships of the 1990s have conditioned many Russians to pounce on a good deal. A stagnant economy has left average disposable incomes stuck around $500 a month, and Ms. Koshkina said the free pizza would help her put aside a bit of money from her salary working at a piercing and tattoo parlor. “Who doesn’t want free food?” she said.
Russia is also a country of citizens with multiple tattoos. They love tattoos, and an iconic American brand is a desirable option. Some individuals, when informed that it was too late to meet the deadline, even got the tattoo anyway. Tattoos in Russia have long been associated with criminals who have used them to depict status in the underworld. But in recent years, they have become part of a broad assimilation of American hipster culture that includes craft beer, skateboards, and boutique barbershops.
A spokesman for Domino’s Pizza Inc., the US-based owner of the Domino’s Pizza brand, said the Russian franchisee had been overwhelmed by the response, receiving more applicants in days than it had expected in months.
Social media campaigns have become a staple of marketers looking to generate online buzz—and, in this case, turn people into lifelong walking advertisements. But the efforts can go awry. McDonald’s, for example, pulled a Twitter campaign with the hashtag #McDStories in 2012 after consumers used it to complain about the company.
US fast-food brands poured into Russia after the Soviet Union collapsed, and they quickly gained popularity in a country where people had grown used to standing in line for basic foodstuffs. Domino’s first opened a store in Russia in 1998, and master franchisee DP Eurasia NV now has more than 100 restaurants, predominately in Moscow.
Now, brands such as Yum Brands, Inc.’s KFC and Restaurant Brands International Inc. unit Burger King are common and are facing a crowd of competition from local fast-food companies and firms that deliver orders from restaurants placed via apps on smartphones.
Domino’s announced the launch of its tattoo promotion named “Domino’s Forever” on VKontakte, the Russian equivalent of Facebook, on August 31. The conditions were minimal: Applicants should post a photo on social media of a real tattoo in a visible place with the hashtag #domino’sforever. They would receive a certificate allowing them to receive 100 free pizzas a year of any size for 100 years, the company said.
When the campaign was halted, 381 people had qualified for free pizza. The lifelong pizza was defined as 100 pizzas a year of any size for 100 years. Just for the four days of the campaign, it could cost the franchise as much as $15 million over that period.
• • •
This marketing campaign went astray and turned into a near disaster. Understanding what went wrong is a good exercise. We will explore this following the process that is presented in this book.
1. What was the reason for doing the marketing campaign? This is not so clear. It could be that it was to drive business, create loyal customers, build the brand, or some other reason. The key to any project is to have a clear understanding of the business measures desired.
2. Given that the correct business measures are identified, the next question is whether this is the right marketing campaign to deliver the objectives. In this case, it is not clear that this project was the correct solution.
3. Expect success by ensuring that the objectives are set for the project along the way and that everyone understands the desired impact. There are no indications that this was achieved.
4. It is not clear that a forecast was made for this marketing program.
5. When forecasting, it is important to have experts estimate the amount of improvement in the impact measure that will be connected to the solution. For example, how much of the additional sales would be generated from this solution? In this situation, a good forecast would have made a difference in this program.
Someone has suggested that maybe Domino’s implemented this campaign as a marketing gimmick to bring attention to the brand, realizing it would stop the campaign early. Even if that was the goal of the program, it is not clear that was accomplished.
The Importance of Forecasting ROI
Confusion sometimes exists about when to develop the ROI. The traditional approach, which we described in previous chapters, is to base ROI calculations on the business impact obtained after the marketing project is implemented. This chapter focuses on ROI calculated at earlier stages—even before the project is initiated. Forecasting may be appropriate when projects are expensive or when they demand costly changes. Forecasting may also be appropriate when dealing with high risks and uncertainty. Forecasting may provide additional benefits. For example, comparing actual results with a forecast helps evaluate the success of a marketing program. If the forecast becomes a reliable predictor of the post-project analysis, then the forecast ROI might substitute for the actual ROI and save money. In certain industries, various regulatory, legal, and managerial forces require organizations to forecast ROI before undertaking major programs. In other situations, forecasting ROI can be a powerful marketing tool.
The Trade-Offs of Forecasting
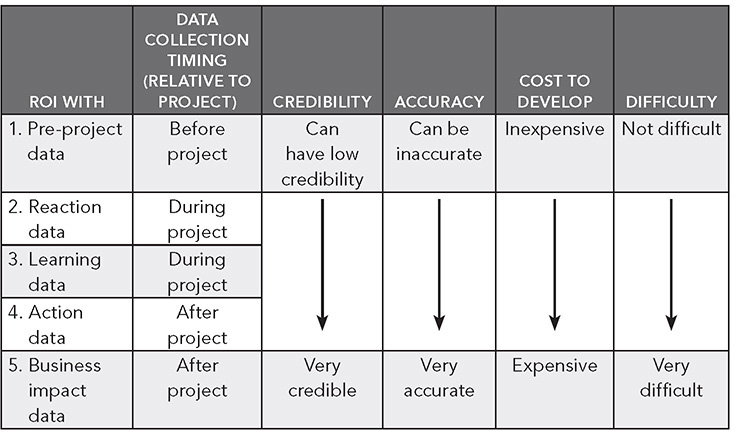
Forecasting is never perfect and always involves trade-offs. In the case of ROI forecasting, the ease, convenience, and costs involved in capturing an ROI forecast often create trade-offs in accuracy and credibility. As shown in Table 13.1, the ROI can be developed at different times and with different levels of data. The figure also shows the relationship between the timing of the ROI and the factors of credibility, accuracy, cost, and difficulty. Five approaches to developing ROI include:
• Pre-project ROI forecasting approach. The least expensive and least difficult approach to forecast ROI is the pre-project approach. Although sometimes lacking credibility and accuracy, the pre-project forecast can be an easy-to-use and cost-efficient tool for marketers to forecast the ROI of their marketing programs. We discuss this approach in detail in the next section of this chapter.
• ROI forecasting approach using reaction data. Marketers can use reaction data collected at Level 1 to forecast ROI. To use this approach, marketers ask customers and participants to anticipate the chain of impact as a marketing program is implemented. While accuracy and credibility increase from the pre-program basis, this approach still lacks the credibility and accuracy desired in many situations. However, the data can be easily collected, and the goal can be readily accomplished. It is a low-cost option to forecast ROI. We will discuss it in detail in the next section together with the pre-program approach.
• ROI forecasting approach using learning data. In marketing programs that involve a significant learning component—for example, a complex marketing message—learning data can be used to forecast the ROI. This approach is applicable only when there is a relationship between knowledge learned and subsequent impacts. When this correlation is available (it is usually developed to validate the test of knowledge), knowledge data can be used to forecast subsequent purchases, and the ROI can be calculated. This approach has less potential as a forecasting tool and will not be discussed in subsequent sections.
• ROI forecasting approach using action data. When the actions of customers and participants are linked to business impact, the actions can predict the impact. For example, a desired action of a marketing program is to have potential customers view a product website through a specific link. If the analysis shows that 10 percent of potential customers who remain on the site for over five minutes will actually purchase the product, then this action becomes a predictor of sales. While this is particularly helpful in situations where appropriate analyses have been developed, it may have limited applications in other programs.
• ROI estimating approach using impact data. Finally, the ROI can be developed from business impact data converted directly to monetary values and compared with the cost of the project. This is not a forecast. It is a post-program evaluation and the basis for the ROI calculations in this book. It is the preferred approach. However, considering the pressures presented earlier, marketers may find examining ROI calculations at other times and with other levels of data is sometimes necessary.
TABLE 13.1 Time intervals when ROI can be developed
In the following sections, we will review in detail the pre-project ROI forecasting approach and the ROI forecasting approach based on reaction.
Pre-Project ROI Forecasting
Forecasting the ROI of a marketing project is probably one of the most useful ways to convince an executive or a sponsor that a project is beneficial and deserves resources and support. The forecasting process is similar to the post-project analysis except that the extent of the impact must be estimated along with the project costs.
Basic Model
In Figure 13.1, we demonstrate the basic model for capturing the data necessary for a pre-project forecast. This basic model is a modified version of the post-program ROI process model presented in Chapter 4. When forecasting ROI using the pre-project approach, we estimate the project outcomes, rather than collect actual data after project implementation. Data collection with the pre-project approach is simple and relies on subjective approaches such as interviews, focus groups, or surveys of experts. It may also be helpful to tap into benchmarking studies or locate previous relevant studies.2
FIGURE 13.1 Pre-project forecasting model
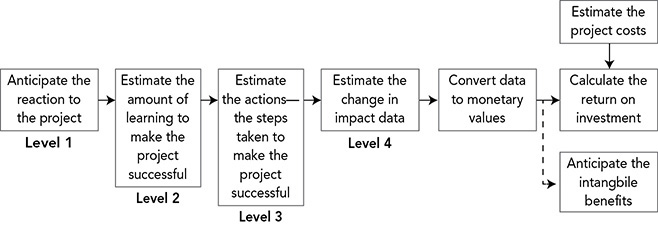
Beginning at the reaction level, we capture anticipated or estimated reaction data. Next, we develop the anticipated learning and anticipated actions that must occur. Here, the estimates focus on what must be accomplished for the project to be successful and may be based on the objectives set at each of these levels. Finally, the impact data are estimated by experts, which may include specialists, managers, or potential participants in the project. In this basic model, the levels build on each other. Having data estimated at Levels 1, 2, and 3 enhances the quality of the estimated data at Level 4, Impact, which is needed for the ROI forecasting analysis.
Notably, in the basic model, there is no need to isolate the effects of a project as in the post-project model. Instead, we ask the individual experts providing the impact data the following question: “How much will the impact measure change as a result of the project?” Because this question ties the anticipated change in the business impact measure directly to the marketing project, isolation is not needed here.
Consequently, this approach makes the forecasting process easier than the postevaluation model, where isolating project impact is always required. It is a straightforward process to convert data to monetary value using the techniques described in Chapter 9. The specific steps to develop the forecast are detailed next.
Basic Steps to Forecast ROI
We highlight 18 detailed steps in this section, which are necessary to develop a credible pre-project ROI forecast using expert input:
1. Understand the situation. Both the individuals providing input to the forecast and those conducting the forecast must have a good understanding of the situation and task. This is a typical requirement for selecting the experts.
2. Predict the present. Many measures in marketing projects often lag the present situation and may be based on data taken several months ago. Due to the dynamic influences in the marketplace, it may be beneficial to estimate where the measure is now. For example, market share data are often several months old. Looking at trending market share data and examining other influences driving market share can help marketers understand the current situation.
3. Observe warnings. We need to observe warning signs and red flags, which are signals that something is going against the measure in question, causing it to go in an undesired direction or otherwise not move as it should. We must factor these warning signals into the situation as the forecasts are made.
4. Describe the new process, project, program, or solution. We must describe the project completely and clearly to the experts so they fully understand the mechanics of what will be implemented. Typically, we need to include the project scope, the individuals involved, time factors, and whatever else is necessary to express the magnitude of the program and the profile of the solution.
5. Develop specific objectives. Objectives provide clear direction toward the project’s end. These objectives should mirror the levels of evaluation and should include reaction objectives, learning objectives, action objectives, and impact objectives. The cascading levels represent the anticipated chain of impact that will occur as we implement the project.
6. Estimate how customers or participants will perceive the project. In this step, the experts are trying to determine how customers or participants will react to the offering of the project. Will they find the offering to be valuable? Important to them? Will they support the project? Answers to these questions help determine reaction.
7. Estimate what the customers or participants will learn. Every marketing project involves learning, and the experts will estimate what and how learning occurs, identifying specific knowledge, skills, and information. Using the learning objectives, the experts will determine what marketing message the customers will acquire and how participants will learn as they become involved in the project.
8. Anticipate what customers or participants should do because of the project. In this step, the experts will identify what actions the customers or participants will take as the project is implemented successfully. This step details specific actions taken, tasks followed, processes implemented, and technology used.
9. Estimate the improvement in business impact data. This is a critical step, because the impact data generated are needed for the purpose of the financial forecast. The experts will provide the estimate, in either absolute numbers or percentages, about the change in the business impact measure (∆P) as a result of the marketing project.
10. Apply the confidence estimate. To ensure the accuracy of the estimate attained in the previous step, we need an error adjustment. We develop it by deriving a confidence estimate on the value identified in the last step. Specifically, the experts are asked to indicate the confidence they have in the previous data. The confidence level is expressed as a percentage, with 0 percent indicating “no confidence” and 100 percent indicating “certainty.” This becomes a discount factor in the analysis, denoted by c.
11. Convert the business impact data to monetary values. Using one or more methods described in Chapter 9, we can convert the data to money. If the impact measure is sales, the value represents the gain obtained by having one more unit of the measure. If the impact measure is what the organization is trying to reduce, such as product returns, errors, or customer complaints, then the value is the cost that the organization incurs as a result of one incident. For example, the cost of product returns may be 5 percent of sales. This value is noted by V.
12. Develop the estimated annual impact of each measure. The estimated annual impact is the first-year improvement directly related to the marketing program. In formula form, this is expressed as ∆I = ∆Pc × V × 12 (where ∆I = annual change in monetary value, ∆P = monthly change in performance of the measure, c is the confidence factor – error adjustment, and V = the value of that measure). If the measure is daily, weekly, or monthly, we must convert it to an annual amount. For example, if three product returns will be prevented each month, the number avoided represents a total of 36.
13. Factor additional years into the analysis for programs that will have a significant useful life beyond the first year. For projects with a significant useful life beyond the first year, the factor should reflect the diminished benefit of subsequent years. Marketers should use the best data and information sources available to determine the amount of the reduction and the values developed for the second, third, and successive years. Consistent with the ROI Methodology principles, it is important to be conservative by using the smallest numbers possible.
14. Estimate the fully loaded project costs. In this step, use all the cost categories described in Chapter 10 to estimate the fully loaded costs, and denote the value as C when including it in the ROI equation. Include all direct and indirect costs in the calculation, as guided by the ROI principles.
15. Calculate the forecast ROI. Use the total projected benefits and the estimated costs in the standard ROI formula to calculate the forecast ROI as follows:

16. Show variation. It is beneficial to use sensitivity analysis to develop several potential ROI values with different levels of improvement (∆P). When more than one measure is changing, the analysis may take the form of a spreadsheet showing various output scenarios and the subsequent ROI forecasts. The break-even point will be identified from this analysis.
17. Identify potential intangible benefits. Anticipate intangible benefits using input from the individuals who are most knowledgeable about the situation, based on assumptions from their experience with similar projects. As discussed previously, the intangible benefits are those benefits not converted to monetary value but are connected to the project and possess value.
18. Communicate the ROI forecast and anticipated intangibles with caution. The target audience must clearly understand that the forecast is based on assumptions. Although the assumptions are clearly defined and the values represent the best possible estimates, they may include a degree of error. Use with caution.
Following these 18 steps will enable an individual to forecast the ROI with confidence in a systematic way.
Forecasting Can Prevent Problems
A good forecast can avoid the problem of missing the mark, which can be expensive and devastating. The opening story in this chapter explored a very expensive snafu made by Domino’s with its franchise in Russia. This, perhaps, could have been easily avoided if a serious approach had been taken to forecasting the ROI before the project was implemented. Using the process outlined in this chapter could have produced a credible forecast that might have prevented or radically altered the promotional offer that was communicated to the Russian public.
Sometimes a marketing campaign involving TV advertisements can miss the mark on the positive side and be very successful. Consider this example of a series of television ads for the state of Utah to increase visitors to the national parks in that state.
Six years ago, Utah tourism officials launched a “Mighty 5” marketing campaign to entice more visitors to the state’s spectacular national parks. State officials got more than they bargained for.3
Frustrated locals are now dealing with the consequences of the explosive growth that followed. The number of visitors to the five parks—Zion, Bryce Canyon, Capital Reef, Canyonlands, and Arches—has soared to 10.6 million visitors in 2018 from 6.3 million in 2013, a 68 percent increase that state officials say was due in large part to the advertising. Other factors, they say, included the national economic recovery and social media.
Few places have seen the impact more than Moab, Utah, a city of 5,300 that sits beneath towering red rock cliffs near the entrances to two of the parks, Arches and Canyonlands. Once known as a relaxed getaway for mountain biking and four-wheeling, Moab is being swarmed by 3 million visitors annually. On peak days, visitors create hour-long waits at restaurants, are responsible for empty store shelves, and turn the city’s quaint Main Street into a parking lot. With infrastructure and facilities strained, officials in the parks and their gateway communities have pushed back on both state and local promotion efforts. Grand County, which includes Moab, in June opted not to pursue a $250,000 state grant to aim more marketing at prospective visitors in Texas and Illinois. After hearing the complaints, the Utah Office of Tourism, which ran the Mighty 5 campaign, put on the brakes.
This ad campaign was too successful, generating more tourists than the cities could handle. This success turned out to be a disaster for some of the local areas. The key question is, could this success have been predicted? If so, the campaign could have run for a shorter period, or the cities could have been given more notice to prepare for the increase in visitors. The key issue is that you can control the outcomes of projects if there is an understanding and a forecast of those outcomes. The challenge is to determine if the process outlined in this chapter can be used to forecast the success.
Some experts understand this type of tourism ad and also the environment in which such ads are being offered. This campaign was launched in the face of a great economic boom, and social media often attracts people to tourism as well. So perhaps some indication of these other factors could have been helpful. Certainly, there must have been some experts who could have examined history to offer some estimates of the program outcomes. If so, the planning could have been much better.
For some organizations, having too many results from an ad campaign is a good thing. But for others, when it causes bottlenecks and other problems, advertising can do more harm than good. The critical point is that a good, credible forecast can make a difference.
Forecasting with a Pilot Project
To deal with the inaccuracies inherent in a pre-project forecast, marketers may choose a better approach by developing a small-scale pilot project with the ROI based on post-project data. This approach involves the following steps:
1. As introduced previously, develop Level 1, 2, 3, and 4 objectives.
2. Select a small-scale sample to implement the pilot project. Exclude all the bells and whistles to keep the project costs low without sacrificing integrity.
3. Fully implement the project with one or more target segments or groups.
4. Develop the ROI using the ROI process model for post-project analysis as outlined in previous chapters.
5. Use the results of the pilot project to decide whether to implement the project throughout the organization or in the national market.
Estimating ROI with a pilot project provides less risk than developing an ROI forecast. For example, large organizations such as Walmart can use this method to evaluate a pilot project to reduce the risk of implementing a project throughout its chain of stores.
ROI Forecasting with Reaction Data
Another possibility is to develop a forecast based on reaction data. The reaction data are collected after the customers or participants are involved in the project. To forecast ROI at this level, marketers need to ask customers specifically what actions they will take and what results they anticipate. The actions could include signing up to be a new customer, purchasing the product, or agreeing to an upgrade. We can easily convert these actions to monetary values. Customers can provide a confidence factor with their responses, which is used for the next step when adjusting estimates for the confidence level. When tabulating data, the confidence levels are multiplied by annual monetary values to produce a conservative estimate for use in data analysis.
Forecasting ROI Using Reaction Data
Transoft is one of the largest software companies for the trucking industry. With more than 12,000 users, Transoft dominates the trucking landscape. Transoft provides software solutions for carriers, brokers, logistics companies, and shippers. A variety of software solutions are available, including products for financial operations, fleet management, document systems, dispatch operations, freight management, and broker management. Its most popular software, ProfitPro, integrates a variety of software solutions, all aimed at improving the efficiency and profitability of the trucking company. The trucking industry is highly competitive, often producing low margins. Having an efficient operation is usually the difference in profit or loss. ProfitPro has a reputation for helping trucking companies meet profit goals.4
Transoft has just completed an upgrade on ProfitPro and has released it to the sales team to begin selling the upgrade. An upgrade costs the client from $1,000 to $3,000, depending on the scope of operations. For the client, the upgrade provides some new features and streamlines some of the previous processes. It should help make clients more profitable by reducing the time to complete certain documents, ensuring on-time filing, reducing invoicing errors, and improving other operating efficiencies.
To support the campaign, the marketing department created an email message with a link to a four-minute video that will be sent to all the ProfitPro users. The email encourages the users to take just four minutes and view the details of the new upgrade of this important software. The thinking was that the users of the system would be curious about the upgrade and that some users would welcome an upgrade. A high percentage of customers were expected to click on the video and watch it. Then, the users were sent another email containing two questions with a reward of a $25 Starbucks gift certificate for answering the questions. The two questions are:
1. “As a result of what you saw in the video about this upgrade, on a scale of 1 to 10, what is the likelihood of you purchasing the upgrade?”
2. “On a scale of 1 to 10, where 10 is complete confidence (meaning your previous estimate is 100 percent accurate), and 1 indicates no confidence, please provide an assessment of your confidence in your answer to question 1.”
This was all the data the customers had to supply in return for the $25 gift certificate, and the rate of questionnaires returned was high.
The analysis was conducted as follows: For the first survey question, an answer such as 8 on the likely-to-purchase scale translated into 80 percent of the sale. However, the confidence adjustment was the way to adjust the estimate for error, as described in Chapter 9. For example, if someone answered 8 for the likely-to-purchase question and also answered 8 on the scale of confidence, those two numbers would be multiplied together to equal 64. This meant that the person was 64 percent likely to purchase this upgrade. This was then multiplied by the purchase price to obtain the actual monetary amount.
Those who did not respond to the email asking for these two data items were considered to be zero, meaning that they will not purchase the product. This approach was very conservative and followed Guiding Principle 6 of the ROI Methodology.
When the numbers were multiplied and the total monetary value was developed, the monetary value was multiplied by the profit margin, which was 20 percent. These values were totaled and compared with the cost of the four-minute video, including design, development, production, and implementation costs as well as the cost of the gift certificates for those who responded. When the total costs were compared with the monetary benefits, the ROI was calculated. In this case, the ROI turned out to be over 200 percent. Essentially, this was the ROI on the marketing video about the upgrade based on reaction data from the customers.
This forecast was completed before the sales team took the mobile learning course and helped increase sales. This example shows how forecasting is a great way to get an early indicator of the marketing campaign.
Forecasting Guidelines
Compared with today’s enterprise, the enterprise of the future will be more likely to implement and utilize continuous analysis of past business performance and events to gain forward-looking insight to drive business decisions and actions.5 With the different forecasting time frames outlined in this chapter, we propose the following guidelines known to drive the forecasting possibilities within an organization. These guidelines come from our experiences in forecasting in a variety of projects and programs.6 More discussions are available in the books and papers we published.7
1. If you must forecast, forecast frequently.
2. Make forecasting an essential part of the evaluation mix.
3. Forecast different types of data to develop an overall assessment.
4. Secure input from those who know the process best.
5. Forecasting works best when it covers a short time frame.
6. Expect forecasts to be biased, and understand their limitations.
7. Manage the effort of serious forecasting.
8. Review the success of forecasting routinely.
9. Communicate the assumptions clearly.
10. Use the forecasting to achieve important organizational goals.
Final Thoughts
Most marketers focus only on impact data for ROI calculations. In this chapter, we illustrated that ROI calculations can be developed at different times and at different evaluation levels. There is a growing need to forecast impact and ROI earlier in the process. It is possible to satisfy this need by forecasting ROI using reaction, learning, and action data, as well as using a pre-project approach. Although pre-project ROI forecasts have an image of low credibility and accuracy, they also have the undeniable advantage of being inexpensive and relatively easy to develop. ROI forecasts developed before a marketing project begins and during implementation can be useful to executives, sponsors, customers, and participants. The reality is that forecasting is an important part of the measurement mix and should be pursued routinely and used regularly in decision-making. Using the guidelines introduced in this chapter, marketers can make their ROI forecasts based on estimates of impact data more credible and accurate.