
11
BETTER METRICS
Now that you know how to improve your engagement score, let’s add new and better metrics for further motivation. Then you can better measure the impact of your work and also pioneer fresh thinking about engagement for your organization.
The current metric, your department’s engagement score, has limitations. One is that it presumes everyone thinks identically because anonymous responses cause us to see all scores in a lump. Our knee-jerk, toxic response is if they all think the same, then they all want the same, so let’s make a list of things we can do for all of them . . . and then our score will rise.
We know that employees do not all think the same. We could in fact argue mathematically that not one of your employees thinks precisely like your department score, which usually represents an average of the average scores for each survey item. But more importantly, anonymous surveys cause your top performers’ opinions to be buried amongst the crowd, and these employees provide up to four times more productivity than the rest.1 These are the employees you need to further motivate and retain, and you cannot rely on “team fixes” to achieve this.
A second shortcoming is that we report survey results in scores that have no stand-alone meaning, leading us down the backwoods road to benchmarks. CEOs like benchmarks because they provide a relative scale to give these scores a context, but often the result is that we cheer meeting a benchmark or beating it by a hair. Never would your CEO be pleased that sales or service equal but don’t exceed the industry average, and average is a synonym for mediocre. Why should we feel good about being mediocre?
Without correlations to profitability, shareholder returns, or other business metrics, most companies don’t take engagement scores seriously outside of the one-month period when score results and improvement plans are due. In their current form, survey scores are intangible, mysterious numbers that are kept in the shadows 11 months of the year because few really understand their gravitas. Instead, these scores should merit a top-5 performance metric status across your organization. You now know this based on the data presented in chapter 1.
A third shortcoming is that most companies survey way too infrequently. The simple test here is to ask: Would you wait a year or two to resurvey customers or patients who told you a major revenue-producing section of your company was broken? The obvious answer is no. Yet we survey employees with time gaps of 12 or 24 months. Why? Because surveys take too much time? Because we need many months to implement solutions? Because outside survey providers cost money? Because we don’t really want to know?
The downside to infrequent surveys is that no feedback causes momentum to slip, and employees with poor managers get the short end of the stick for even longer periods of time.
So let’s introduce three new metrics with ways you can apply them to improve your department’s scores and, more importantly, your department’s productivity. Think of these tactics as expert recommendations, which should spark you to improve employee engagement with your team.
 NEW METRIC #1
Conduct Your Own Quarterly Engagement Survey
If feedback, as they say, is the breakfast of champions, take a heaping bowl at least every 90 days. Here’s how:
1. Select the five or so most important questions from your company survey; Human Resources can help you choose these, or they might tell you that a few questions are weighted more strongly and, if so, these are the ones to use.
2. Weight each item equally.
3. Place your questions into a tool like Survey Monkey, and ask your team to rate their own engagement each quarter.
4. Use the same response scale that your company’s survey includes, which is usually but not always a 5-point scale.
5. For simplicity, ensure response scales result in the first-listed response being the most positive and the last-listed response being the most negative.
6. Then develop an average score for your team’s responses based on the average response for your five or so questions. As an extreme but illustrative example, if all employees choose the second response choice for each survey item, your department’s score is a 4.
7. Use this simple method to keep tabs on your progress, then wait until your company’s next survey to learn if you’ve successfully moved more employees into the top box.
Here’s a script for introducing the interim survey to your team:
“As you know, our company conducts a periodic employee engagement survey to measure how strong our efforts are to do our jobs. These survey results are very important to me, so I’ve organized a way to measure your engagement more frequently so I can gauge my own effectiveness at engaging you and the others on our team. You can be sure I will share the results with all of you. Here’s how that survey will work . . .”
NEW METRIC #2
Establish Department Stretch Goals
Chapter 1 taught us that increasing engagement leads to improvement in the following metrics: profitability, productivity, customer ratings, quality defects, safety incidents, patient safety incidents, absenteeism, shrinkage, sales growth, cost of goods sold, customer focus, employee turnover, customer spending, and earnings per share.
This long list tells us that improved engagement drives literally every business metric, that everything you are expected to do you will do better when your team is more engaged. So a new, very appealing challenge is: What stretch goals should you set for yourself and your team?
Let’s use sales as an example. Until now you likely have been schooled that getting your team to sell more product was about sales skills and product knowledge. You gave feedback after joining a sales call, sent salespeople who needed help back to product knowledge training, and maybe directed some who meet with large groups to get specialized presentation skills training. Each of these interventions is definitely a positive step to improve how your team sells your products.
But now you know improving engagement alone will improve sales, too. And depending on your industry, we should rightly assume that it will also improve customer service, product quality, manufacturing errors, HCAHPS scores in hospitals, billable hours for law firms, product delivery times for software engineers . . . and much more.
So if improved engagement lights the fire for all metrics, write down your stretch goals for the metrics that are most important for your department. Base these metrics on the solid assumption that more employees will move into the top box. Then share these stretch goals selectively with those above you, or at least post them in a private place and make them your new targets.
NEW METRIC #3
Translate Your Department’s Score into Dollars
If setting an engagement goal is Business 101, then this is the graduate-level metric.
Several years ago, Watson Wyatt, a global survey and consulting company now called Towers Watson, announced that their publicly traded client companies showed a consistent correlation pattern between engagement survey results and revenues over a multiyear period. Specifically, they said:
Analyses show that a significant improvement (one standard deviation) in employee engagement is associated with a 1.9 percent increase in revenue per employee.
Further, Watson Wyatt said:
Organizations that improved their employee engagement by one standard deviation were associated with a revenue increase of $4,675 for each employee. For a typical S&P 500 organization, this amounts to $93.5 million in additional revenue each year.2
This broad-reaching study grabbed our attention because it opened the door to a dollar-translating calculator for engagement survey scores. So we built one and asked mathematical experts if it truly measured engagement in dollar terms. Here’s one of the analyses we got back from Dr. Gary Borich at the University of Texas at Austin:
The C-Suite Analytics Engagement Calculator is a welcomed, one-of-a kind tool to help organizations fully grasp the value of engaged employees as well as the huge number of dollars left on the table when employees don’t give their best. Perhaps its greatest value is that it distinguishes managers who influence engagement from those who do not, in specific dollar values.
This calculator is based on broad-based research and its algorithms have a solid statistical foundation. It can work with any engagement survey and assumes that survey measures engagement in a valid way.3
To rephrase Dr. Borich’s words, the calculator provides a valid dollar value for each unit’s survey score.
Calculating your department survey score’s dollar value requires three things:
1. Your department survey score in your company’s usual format
2. A company-wide survey goal, and if none is available, collaborate with Human Resources to identify a reasonable goal
3. Mathematical skills to calculate standard deviation, which you can possibly find in Human Resources or an analytical department, or with the help of a local community college professor
Here, then, is the method to calculate your department’s engagement value in dollars. We will first calculate your company’s engagement survey performance in dollars, and then calculate your department’s engagement survey performance in dollars, based in part on your department’s value to your company. Your department’s value to your company will be measured by the percentage of total company compensation that is paid to your department.
Let’s consider as an example the following organization:
![]() The company earns $100 million in annual revenue.
The company earns $100 million in annual revenue.
![]() It conducted an engagement survey that reported scores on a scale of 1 to 10.
It conducted an engagement survey that reported scores on a scale of 1 to 10.
![]() The company’s targeted score was 8.
The company’s targeted score was 8.
![]() Its actual organization score was 7.
Its actual organization score was 7.
![]() The distribution of scores indicated a standard deviation of 1.
The distribution of scores indicated a standard deviation of 1.
We can then chart the company’s outcome and apply the formula to determine its engagement survey impact in dollars, as shown in Figure 11.1.
FIGURE 11.1 TOTAL ORGANIZATION’S ENGAGEMENT DOLLAR VALUE
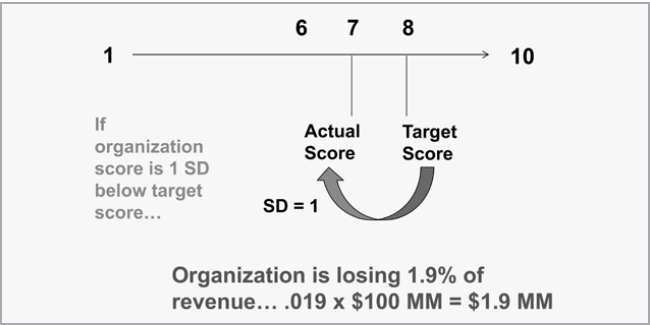
As the graphic in Figure 11.1 indicates, this organization lost 1.9 percent of its annual revenue because its overall survey score was 1 standard deviation below its targeted score. This caused a loss of a total of $1.9 million. These are dollars completely left on the table, dollars that CEOs and most CFOs would never consider when reviewing employee survey results. That is, unless they know the research behind the cost of engagement or have seen this chart.
Let’s now use this same method but adapt it to one department within this organization. Our example will be the technology department, as shown in Figure 11.2. Here’s the scenario:
![]() This is the same organization, and it earns $100 million in annual revenue.
This is the same organization, and it earns $100 million in annual revenue.
![]() This organization conducted an engagement survey that reported scores on a scale of 1 to 10.
This organization conducted an engagement survey that reported scores on a scale of 1 to 10.
![]() The organization’s targeted score was 8, which was the targeted score for each department, too.
The organization’s targeted score was 8, which was the targeted score for each department, too.
![]() The actual technology department score was 9.
The actual technology department score was 9.
![]() Distribution of scores indicated a standard deviation of 1.
Distribution of scores indicated a standard deviation of 1.
![]() The technology department’s salaries and benefits are equal to 10 percent of the organization’s total salaries and benefits.
The technology department’s salaries and benefits are equal to 10 percent of the organization’s total salaries and benefits.
FIGURE 11.2 INDIVIDUAL DEPARTMENT’S ENGAGEMENT DOLLAR VALUE

The graphic in Figure 11.2 tells quite a different story. Because the technology department’s score was 1 standard deviation above the targeted score, its dollar value is positive rather than negative. The method to determine this value begins the same way as our calculation for the entire organization, by determining the dollar value for the total company if it had achieved this score of 9. In this example, that value is a positive $1.9 million. Next, we multiply this positive value by the percentage of company compensation and benefits paid to the technology department, which is 10. The mathematical equation is:
(Company engagement value) X (technology department compensation and benefits as a percentage of total company compensation and benefits) = dollar value $1.9 million x 0.10 = $190,000
The result is the technology department is bringing in the equivalent of $190,000 of revenue, entirely because the employees there are more engaged in their work than the target level. This $190,000 in revenue value is in addition to the expected performance of the technology department.
Why did we use each department’s total compensation and benefits rather than its number of employees to determine the department’s engagement values? Because some departments have a greater impact on revenue than others, and the model assumes that top management designs compensation to reward those employees and those departments that affect revenues the most. For example, an administrative department could achieve the same survey score as the technology department and might also have the same number of employees, but a logical assumption would be that the technology team would have a greater impact on revenue than the administrative team. The model accommodates this assumption.
Our examples are designed to use simple computations to make understanding clear. Most standard deviations will likely be in fractions and not in whole numbers, but they will work just as effectively in this model.
Why have I suggested four new and better metrics here? To motivate you to work harder to improve your score and therefore your productivity. Think of these metrics in this way:
![]() Establishing your own engagement survey goal gives you . . . ahem . . . a goal.
Establishing your own engagement survey goal gives you . . . ahem . . . a goal.
![]() Surveying your department quarterly pushes you to achieve your goal in the short term, with urgency.
Surveying your department quarterly pushes you to achieve your goal in the short term, with urgency.
![]() Establishing stretch goals on operations metrics shines light on your awareness that engagement drives each metric you are accountable for—and drives your career.
Establishing stretch goals on operations metrics shines light on your awareness that engagement drives each metric you are accountable for—and drives your career.
![]() Converting your results into dollars makes engagement more real and more relevant . . . and it gives you something incredible to tell the people above you.
Converting your results into dollars makes engagement more real and more relevant . . . and it gives you something incredible to tell the people above you.