Chapter 3
Metallgesellschaft AG
Illusion of Profits and Losses, Reality of Cash Flows
The story of Metallgesellschaft AG39 (MG) is not one of unabashed success or unmitigated failure. It is, instead, the tale of a first-rate company that became an industry leader in energy derivatives40 by introducing innovative and much needed hedging products, only to have the venture collapse because of a failure to understand and an inability to manage risks. During 1993, MG’s U.S. affiliate, Metallgesellschaft Refining and Marketing (MGRM), lost $1.33 billion on energy derivatives, despite an enthusiastic customer base, rapidly increasing sales, a dominant industry position, and highly valued products. MG’s story is important on many levels but especially for emphasizing the need to properly identify key risks before starting a venture and to actively manage and communicate them afterward.
Metallgesellschaft: Evolution of the Company and Its Product Lines
In the early 1990s, with approximately $15 billion in annual sales generated by 43,000 employees working in 250 domestic and foreign affiliates, MG was one of Germany’s largest multinational conglomerates. It had an established reputation in the dirty, slow-moving businesses of mining and smelting nonferrous metals, but growth was difficult in these slumbering industries, and high price volatility made planning decisions precarious.41
In 1989, MG selected Austrian-born Heinz Schimmelbusch as its new chief executive officer and, almost immediately, he and his management team developed a strategy to increase sales growth and profitability. Their approach was to diversify into high value-added lines of businesses and to prune deadwood from existing activities by means of divestitures.
Schimmelbusch started by splitting MG into three parts: raw materials, services, and industry, focusing particular attention on trading, foreign sales, and the rapidly growing pollution-abatement industry. By the early 1990s, MG had already spent more than a billion German marks to acquire fresher lines of business, which expanded the company’s enterprise portfolio to include a wide variety of products, ranging from energy derivatives, to pollution-abatement equipment, to explosives, to oil.
Schimmelbusch’s diversification strategy came under immediate pressure because sales growth and profitability in MG’s core business lines continued to deteriorate. One of the main reasons for declining sales was a sharp drop in metals prices (e.g., aluminum, nickel, and lead), which was caused, in large part, by former Soviet countries selling metals on world markets at bargain-basement prices. Rising costs also eroded profits. Germany’s expensive labor force, the strong German mark, and MG’s inability to use a few of its new smelters added fuel to the fires of distress. The company also fell victim to its own timing mistake, choosing the early 1990s to upgrade many of its production facilities with costly, state-of-the-art, low-emission equipment. Together, these influences reduced sales, increased costs, and battered MG’s profitability. Pressure mounted for its new lines of business to pick up the slack.
Energy Derivatives at MGRM
During the 1980s, MG made a strategic decision to develop a fully integrated U.S. oil business (i.e., exploration, extraction, refining, storage, and transportation). In 1989, it purchased a 49 percent ownership interest in Castle Energy, a U.S. oil and gas exploration company, which later developed into an oil refiner. The deal came with MG’s 10-year commitment to purchase all of Castle Energy’s production and guarantee its margins.42 A promising addition to this business line was MGRM, which was tasked with creating a market for long-term, fixed-rate forward energy contracts. The hope was MGRM would diversify MG’s revenue streams and build cross-selling opportunities with other energy business lines.
In 1991, MG hired W. Arthur Benson, a former Louis Dreyfus Energy (LDE) executive, to run MGRM. The German parent wanted to connect Benson’s industry understanding and management skills to MG’s huge financial resources. Benson accepted the challenge and brought with him about fifty of his former LDE colleagues.
Benson had made his name at LDE in the jet fuel market during an era of rising energy prices, but any doubts as to whether he could identify opportunities in this new, declining-price environment were soon laid to rest. He and his team offered a palette of popular energy derivatives. Heavy sales began during the summer of 1993, when energy prices were relatively low and falling. By the fourth quarter of 1993, MGRM had already sold 160 million barrels43 of its fixed-rate, long-term forward contracts to about 100 independent heating oil and gasoline retailers.44
Energy Markets on a Roller Coaster
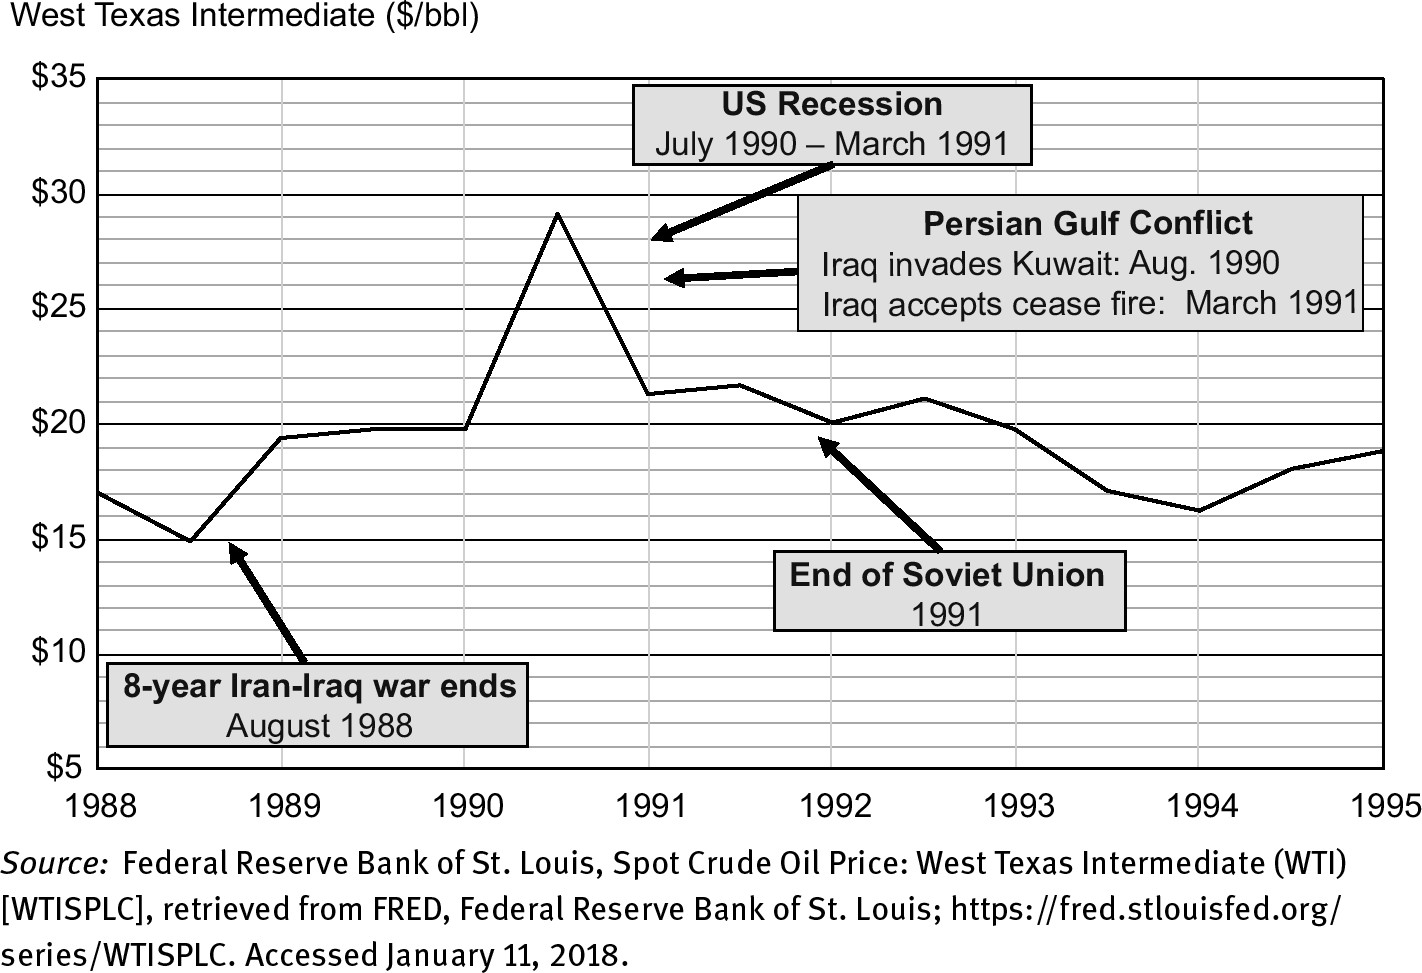
Between 1988 and 1994, energy prices changed dramatically (see Figure 3.1) and so did the relationship between spot and forward energy prices. As a result, hedges that were supposed to protect MGRM’s long-term forward oil and gas deals hemorrhaged cash, causing the company’s trading strategy to appear wildly speculative. Supply and demand conditions changed absolute and relative energy prices. These price changes had strong, direct effects on MGRM’s hedging strategy that caused massive cash outflows.
Rising Energy Prices and Backwardation
From 1988 to 1990, just prior to Benson’s move to MGRM, energy prices rose. The increase was stimulated from both demand- and supply-related factors. On the demand side, a long global economic expansion encouraged energy consumption, which raised energy prices. On the supply side, the double-barreled effects of turmoil in Eastern Europe (e.g., the Berlin Wall fell, there were mass uprisings in Czechoslovakia, and the Soviet Union began to collapse) and fear of a Persian Gulf War created oil line disruptions that helped to escalate oil prices to more than $20/bbl.
Due to uncertainty over a possible Gulf War, energy users put a premium on holding physical inventories of oil and gas rather than having claims on future deliveries. These forces helped to raise spot energy prices above forward energy prices. When this happens, the markets are in backwardation, and a convenient way to discuss backwardation is in terms of an asset’s (in this case, oil and gas) basis. Basis is the difference between an asset’s spot price and forward price. When a market is in backwardation, the asset’s basis is positive (see Table 3.1). When the reverse is true, the market is in contango, which means the spot price is less than the forward price, and basis is negative.
Table 3.1: Backwardation and Contango Defined

Falling Energy Prices and Contango
From mid-1990 to 1994, energy prices fell dramatically due to a combination of macroeconomic and industry-related factors. One of the major reasons for the reduction in energy demand was an eight-month recession in the United States that began in July 1990. The recession reduced real U.S. gross domestic product (GDP) by 0.5 percent, but, fortunately, it was not matched by a global recession (the world economy grew by nearly 3%). Therefore, the decline in energy prices was gradual rather than abrupt. At the industry level, the decline in oil prices was exacerbated by overproduction due to post–Gulf War quota disputes among the Organization of Petroleum Exporting Countries (OPEC) members.
Normality returned to the oil and gas markets after United Nations forces defeated Saddam Hussein’s army in Kuwait during February 1991. Lower levels of global risk reduced or eliminated the premium that energy users put on the physical possession of oil and gas relative to owning energy contracts for future delivery. With fears of a global energy shortage gone, the spot demand for oil and gas fell relative to forward demand, causing the energy markets to move from backwardation to contango, which meant the basis moved from a positive to a negative value (see Table 3.1).
Risk Notepad 3.1
What Is the Difference Between Contango and Backwardation?
Should there be a difference between the spot price and forward price of a commodity, such as oil? If so, should the spot price be greater than or less than the forward price? When the forward price of an asset is greater than the spot price, the market is said to be in contango. When the reverse is true (i.e., the spot price is greater than the forward price), the market is said to be in backwardation.
Interest Earnings
Common sense might lead us to believe that the forward price of a commodity should, virtually always, be greater than the spot price, but this is not always the case. To understand the relationship, consider a company trying to increase its oil reserves and deciding whether to purchase them on the spot market or one-year forward market.
Suppose the spot and one-year forward prices of oil were both $20/bbl, and the one-year Treasury bill rate was 5 percent. Our company wishes increase its oil reserves by an additional 100,000 barrels of oil. In considering whether to purchase in the spot or forward market, the person in charge might reason as follows: “Why should I buy 100,000 barrels of oil today for $20/bbl, when I could enter into a long forward contract that locks in the one-year delivery price at $20/bbl? During the next year, I could use my $2,000,000 (i.e., 100,000 bbl × $20/bbl = $2,000,000) to invest in a risk-free government security earning 5 percent. At the end of the year, I would have $2,100,000 (i.e., my $2,000,000 principal plus 5% interest). I could use $2,000,000 of it to settle my forward purchase obligation and still have $100,000 left. This seems like a much better alternative than purchasing 100,000 barrels of oil now for $2,000,000 and next year having only the 100,000 barrels of oil (i.e., with no extra cash).”
The rule-of-thumb to draw from this example is when markets are in backwardation, rational individuals and institutions wishing to stockpile should purchase commodities in the forward markets and not in the spot markets.
Sacrificed interest earnings can be a significant factor influencing the relationship between spot and forward prices, but other influences should also be taken into account, such as the cost of carry and convenience yield.
Cost of Carry
Storage, insurance, and financing costs are important when deciding whether to buy an asset on the spot or forward market. If our company bought oil on the spot market, it would have to finance the purchase, pay for storage, and insure the inventory, which would reduce profits. Companies that purchase commodities in forward markets do not directly incur these costs. Some assets, such as stocks and bonds, have trivial or no storage costs, but others, such as oil or precious metals, involve significant storage costs.
Net financing, insurance, storage, and other handling costs are typically combined and called the cost of carry (or carrying costs). Due to these expenses, you would expect the forward price to be higher than the spot price by the compound value of these costs. For example, suppose the spot price of oil was $20/bbl, forward oil price was $20/bbl, and yearly cost of carry was $1/bbl (paid up front). Given these conditions, a company looking to purchase oil for inventory would prefer to buy in the forward market. Buying a barrel of oil now would mean spending $21/bbl for the purchase and carrying costs of this asset. Purchasing a barrel of oil in the forward market would cost only $20.
Convenience Yield
Convenience yield reflects the value an individual attributes to having, on hand, an asset that has some inherent practical use in trade, production, or consumption. It is the advantage of possessing an asset and not just having rights to buy it in the future. In this regard, there is a big difference between assets lacking inherent practical use, such as government securities or corporate bonds, and assets such as oil, copper, silver, or gold. Ready supplies of needed products ensure that companies (e.g., oil refiners) have available inventories of materials for their operations and also provide flexibility to take advantage of opportunities, as they appear from time to time.
The benefit from having an asset on hand is called its convenience yield or convenience value. Taking into account cost of carry and convenience value, the relationship between the spot and forward prices of an asset should be as shown in Equation 3.1.
Where:
“Cost of Carry” is the compound value of all interest expenses minus the compound value of all investment returns plus the compound value of all storage and insurance costs. “Convenience Yield” is the compound value that individuals attach to having an asset on hand and their expectations about its future availability.
MGRM’S Innovative Energy Derivative Products
MGRM was an innovator in offering much-needed, energy-related financial derivatives to its customers. Demand for these contracts came from unbranded independent oil and gas retailers, along with some large manufacturing firms and government entities, all of whom were interested in establishing long-term supply contracts at relatively low prices.
During the 1980s and early 1990s, intense competition in U.S. petroleum retailing pitted independent fuel oil companies and filling stations against large brand companies and their distributors, but the independents were losing the war.45 As a result, the influence of unbranded independent filling stations and oil retailers was declining. The relative success of the brand distributors was largely because their supplies were guaranteed, and, during lean times, they could count on financial support from their large multinational parents. In the end, it came down to a battle of margins (i.e., the difference between the retail price of oil products and the wholesale price paid by filling stations and oil retailers), and the unbranded independents could not compete.46
MGRM’s forward contracts offered these independent retailers an opportunity to stabilize their future margins by locking in relatively low oil prices for periods as long as ten years.47 The problem with the industry before MGRM entered the picture was the demand for long-term, forward, fixed-rate oil contracts was not matched by counterparties who were willing and able to supply them. The forward and futures markets were mainly used to hedge (or to speculate) in short-term maturities. Approximately 90 percent of the contracts in the oil futures market expired within four months, which meant that any sizeable change in the demand for (or supply of) long-dated contracts would result in significant price changes.48 Insufficient liquidity in long-dated energy derivatives also caused prohibitively large bid-ask spreads. In this environment, MGRM felt confident that it could use its energy market expertise, hedging knowledge, and huge financial resources to make a profitable business by selling long-term, fixed-rate, forward energy derivatives.49 To protect itself from customer credit risks, MGRM tried to keep its supply contracts to only a small portion of each customer’s total demand.
Due to the energy industry’s need for long-term hedging products and the relative absence of viable alternatives, MGRM was able to generate substantial increases in sales of its forward products. These sales were stimulated, as well, by the bargain prices at which MGRM offered its forward products. Because MGRM did not account for all the risks of its derivative products (especially liquidity risk), it failed to properly value the contracts, and customers responded to these underpriced contracts with enthusiasm.
The resulting exposures put MGRM in a position where even the smallest error could (and did) result in considerable losses. The risks that MGRM overlooked or failed to consider seriously were not trivial, and, as a result, when market conditions changed disadvantageously, significant cash outflows occurred.
MGRM’s Embedded Options
Many of the forward contracts MGRM sold had embedded (“cash-out”) options, which gave customers the right, but not the obligation, to liquidate their forward agreements prior to maturity and take up-front cash payments. The option was activated only if the price of the nearest maturity futures contract on the New York Mercantile Exchange (NYMEX) was greater than the fixed price negotiated in MGRM’s forward contract. When a customer cashed out, the option required MGRM to pay the customer one half of the difference between the futures price and the fixed forward price times the total barrels of oil remaining to be delivered on the customer’s forward contracts with MGRM.
For example, suppose MGRM’s customer agreed to purchase 100,000 barrels of oil for each month during the coming ten years at a fixed forward price of $24/bbl. After the first month, if the futures price on NYMEX rose to $30/bbl, the retailer would have the right, but not the obligation, to exercise the embedded option. As a result, the customer would receive one half of the difference between the futures price ($30/bbl) and the fixed forward prices ($24/bbl) times the total volume remaining to be delivered on the forward contracts (11.9 million barrels), which equals $35.70 million (see Table 3.2).
This option was appealing to many customers because it gave them a chance to cash out their forward deals, with a handsome cash gain, at some point during the ten-year life of the fixed-price contract. The termination option was appealing to other customers because it permitted opportunistic bankruptcy (i.e., if customers no longer needed the hedge, they could get out of their contracts).50
Table 3.2: Customer Exercises the Embedded Option after One Month When the Futures Price Rises Above the Forward Price

Hedging MGRM’s Forward Energy Exposures
Arthur Benson was hired to energize MG’s sales growth and to help revitalize the company’s bottom line. Customers welcomed the derivative products offered by MGRM, but many market analysts were concerned about the speed with which the company had increased sales and net exposures. Did MGRM have the expertise to hedge such large net positions? Where could MGRM lay off its massive unwanted risks?
Payoff Profile of a Short Forward Position
To understand these risks, you need to evaluate MGRM’s hedging strategy. MGRM sold fixed-rate, forward oil and gas contracts with maturities that stretched out monthly for as long as 10 years. “Fixed-rate” means it charged customers one constant monthly price for 10 years, which equaled the spot price at the contract’s initiation plus a premium between $3 and $5. Figure 3.2 shows the downward-sloping payoff profile of a short forward position. Unhedged, this exposure results in losses if the spot price at maturity exceeds the forward price. Profits result if the reverse occurs.
For example, suppose the forward price is $24/bbl (see point A in Figure 3.2), and the spot price rises to $26/bbl. MGRM is committed to selling oil for $24/bbl, but, to satisfy customer demand, must purchase it in the spot market for $26/bbl, which results in a $2/bbl loss. Conversely, if the spot price fell to $22/bbl, MGRM could purchase oil in the spot market for $22/bbl and sell it under the forward contract for $24/bbl, thereby earning $2/bbl.

Figure 3.3 is a depiction of MGRM’s position in 1993, with its numerous short forward exposures represented by the series of (monthly) downward-sloping lines (payoff profiles) that extend from July 1993 to June 2003.

The Ideal Hedge Was Not Available
The ideal hedge for this 10-year series of short exposures would have been for MGRM to offset them by entering into long forward or futures contracts with identical notional values and maturities (see Figure 3.4). That was impossible because the forward markets and futures markets were illiquid beyond a few months. Therefore, these markets could not accommodate MGRM’s massive needs.

The absence of hedging counterparties in the long-dated oil and gas markets was not hard to understand. After all, offering long-dated forward contracts was supposed to be MGRM’s novel contribution to the industry.
Physical Storage Hedge
One safe way MGRM could have hedged its long-term exposures was to purchase oil in the spot market and store it until delivered to customers, but this alternative was deemed much too expensive. To understand why, suppose the cost of carry was just 5 percent per year.51 If the spot price in 1993 was $20/bbl, storage costs would add more than $11 to the price tag by the beginning of the tenth year.52 This was much higher than the $3 to $5 margin MGRM had in mind. If MGRM was sure energy prices would fall, this strategy might be feasible.
Stack-and-Roll Hedge
MGRM tried to mitigate its long-term forward exposures with stack-and-roll hedges, which were combinations of short-term energy futures contracts and over-the-counter swaps.53 These hedges take considerable bets on movements in oil’s price and basis. For MGRM, the best results would have occurred if oil’s price and basis had increased, but they both fell.
A stack-and-roll hedge involves stacking enough futures contracts in near-dated maturities to offset the total exposure of a long-term series of forward contracts.54 For example, suppose an independent oil refiner signed a contract with MGRM in July 1993. The ten-year contract called for 100,000 barrels of oil a month, which is 1.2 million barrels a year or 12 million barrels for the ten-year period. Suppose further that MGRM hedged this commitment-to-deliver by purchasing 12,000 futures contracts in the nearest maturity. Because each oil futures contract is for 1,000 barrels, MGRM’s commitment to buy 12,000 oil futures contracts for next-month delivery equaled its long-term (ten-year) forward commitment to sell and deliver 12 million barrels of oil.
In Figure 3.5, a stack of long, near-dated futures contracts is represented by the block of upward-sloping lines that are front-loaded in July 1993. For each short forward contract (i.e., downward-sloping line) stretching out over the ten-year period, there is a long futures contract (i.e., upward-sloping line) in the stack.

At the end of each month, three important transactions take place.
–First, one of MGRM’s short forward contracts matures, thereby requiring MGRM to purchase oil in the spot market and deliver it, at the agreed forward price, to the customer.
–Second, the entire stack of MGRM’s futures contracts matures, requiring MGRM to close out these contracts by reversing its position (i.e., entering into short contracts).
–Finally, MGRM re-hedges its position, but because one of its forward contracts matured, the new stack of long futures positions is lower by the amount delivered. In Figure 3.6, the stack moves forward one month and is smaller by one long forward contract. One short forward contract from the ten-year series vanishes, and so does one long futures contract.

Cash Flow Effects of a Stack-and-Roll Hedge
An example of a stack-and-roll hedge clarifies the tactic. Kendrick Oil Company (KOC) is an unbranded independent oil supplier headquartered in Friona, Texas. Suppose in July 1993, MGRM and KOC signed a ten-year oil forward contract. Under the deal, MGRM agreed to deliver 100,000 barrels of oil per month at a fixed price of $24/bbl, which was $4/bbl above the current spot price of $20/bbl. Assume MGRM hedges its cumulative open exposure by using the nearest month’s futures market contract and waits until expiration to unwind (i.e., offset) its futures positions. Because the deal was struck in July, the company purchased 12,000 August futures contracts, which was equivalent to 12 million barrels of oil.
To understand the mechanics and results, Table 3.3 shows four scenarios, with different sets of price and basis assumptions.
- Scenario #1: Price of oil falls and basis falls for two consecutive months;
- Scenario #2: Price of oil falls and basis rises for two consecutive months;
- Scenario #3: Price of oil rises and basis falls for two consecutive months, and
- Scenario #4: Price of oil rises and basis rises for two consecutive months.
Scenario #1 reflects the market conditions that MGRM confronted when it lost $1.33 billion. Therefore, we will cover thoroughly this particular case and post results for all four scenarios in Table 3.4.
Table 3.3: Example Assumptions: Stack-and-Roll Hedge (figures in dollars)

Scenario #1: The Price of Oil Falls and Basis Falls for Two Consecutive Months
Using the information from Table 3.3, the price of oil falls from $20/bbl, in July, to $19/bbl, in August, to $18.50/bbl in September, and the basis on one-month futures contracts falls from +$0.50/bbl in July, to –$0.25/bbl in August, to –$0.50 in September. Here is a summary of what happens in each month.
July 1993
–Contract with KOC Signed
- MGRM agrees to supply 100,000 barrels of oil per month to KOC for ten years at a fixed price of $24/bbl. Therefore, its total commitment is for 12 million barrels of oil. No payment is made at the initiation of these forward contracts, and no margin is deposited.
–MGRM Hedges
- To hedge, MGRM purchases 12,000 August futures contracts, which is equivalent to 12 million barrels of oil. The futures price is $19.50/bbl. MGRM deposits margin with the exchange, which is more like a performance bond than an actual payment.
August 1993
–Cash Flows from the Forward Contracts
- The spot price of oil falls from $20/bbl in July to $19/bbl in August. Therefore, MGRM pays $1.9 million (i.e. 100,000 bbl × $19/bbl = $1.9 million) to purchase oil in the August spot market and then delivers it to KOC.
- Earnings on this forward contract equal $500,000 because MGRM sells oil to KOC for the forward price of $24/bbl and buys it on the spot market for $19/bbl.55
–Cash Flows from the Futures Contracts
- When the August futures contract matures, the spot oil price and August futures oil price are identical (i.e., SA=AFA*). Otherwise, arbitragers could simultaneously purchase oil in one market, sell it in the other, and earn risk-free profits. To unwind its long August position, MGRM sells 12,000 August futures contracts for $19/bbl. The original August futures contracts, which MGRM opened in July, committed it to pay $19.50/bbl. Therefore, it incurs a net loss equal to $6 million (i.e., 12 million × ($19.00/bbl – $19.50/bbl = $6,000,000).
–Net August Result
- MGRM incurs net cash outflows, in August, equal to $5,500,000 (i.e., $500,000 – $6,000,000).
–Re-hedge
- After the August delivery of 100,000 barrels of oil to KOC, MGRM’s total exposure is now 11.9 million barrels (i.e., 12,000,000 barrels – 100,000 = 11,900,000). It purchases September futures contracts amounting the 11.9 million barrels at a price of $19.25/bbl. MGRM deposits margin with the exchange.
September 1993
–Cash Flows from the Forward Contracts
- The price of oil falls from $19/bbl in August to $18.50/bbl in September. MGRM pays $1.85 million (i.e. 100,000 bbl × $18.50/bbl = $1.85 million) to purchase 100,000 barrels of oil in the spot market and delivers it to KOC for $24/bbl. The forward sales price of $24/bbl was set in July. Therefore, MGRM has net cash inflows equal to $550,000 (i.e. 100,000 bbl × ($24/bbl – $18.50/bbl).
–Cash Flows from the Futures Contracts
- To unwind its long September futures position, MGRM sells 11,900 August futures contracts (i.e., 11.9 million barrels of oil) at $18.50/bbl (i.e., SFS*).56 The September futures contract, which MGRM opened in August, commits it to pay $19.25/bbl for 11.9 million barrels of oil. MGRM incurs a net loss equal to $8.925 million (i.e. 11.9 million × ($18.50/bbl – $19.25/bbl = –$8,925,000).
–Net September Result
- Adding cash flows from its forward and futures contracts, MGRM incurs net losses equal to $8.375 million (i.e. $550,000 – $8,925,000 = –$8,375,000).
–Re-hedge
- Because MGRM delivered 100,000 barrels of oil in September, its total exposure to KOC is now 11.8 million barrels (i.e., 11,900,000 bbl – 100,000 bbl = 11,800,000 bbl). To re-hedge, it purchases 11.8 million barrels of oil in the October futures market at $19.00/bbl. MGRM deposits margin with the exchange.
Summary: August and September
–During August and September, MGRM incurred losses equal to $5.5 million and $8.375 million, respectively. Therefore, Scenario #1 (i.e., a falling oil price and falling oil basis) causes total cash outflows equal to $13.875 million.
Table 3.4 summarizes the cash-flow results from the four possible scenarios. The worst case is Scenario #1 (falling oil price and falling basis), where MGRM’s net cash outflows equal $13.875 million. The best-case scenario is the opposite (Scenario #4: rising oil price and rising basis), where net cash inflows equal $33.425 million.
Table 3.4: Stack-and-Roll Hedge: Cash Flow Results for All Four Scenarios

MGRM’s stack-and-roll hedge may appear to have been wildly speculative, but energy market data, for the period from 1983 to 1992, revealed three important facts. First, energy markets were in backwardation more than contango, especially for crude oil. Second, gains during periods of backwardation exceeded losses when markets were in contango. Finally, backwardation and contango were seasonal, with backwardation occurring during times of shortage, when the convenience yield was high. As a result, MGRM may have reasoned that using futures markets to hedge was like storing oil with negative carrying costs. By actively trading in these markets, it could take advantage of favorable price opportunities if they appeared.57
Stack-and-Roll Hedge Ratios
A company’s “optimal” hedge ratio depends on its financial goals. For instance, the ratio used to minimize the variance of cash flows is likely to be very different from the ratio that hedges long-term or short-term profits. If hedging was MGRM’s true intent, its financial goal appears to have been hedging long-term profits. It chose a one-to-one hedge ratio for its stack-and-roll hedges, which means it tried to match each barrel of long-term forward contracts (extending out ten years) with a barrel of short-term futures contracts. The long-term forward contacts were sell positions, and the short-term futures contracts were buy positions.
A one-to-one hedging ratio is generally most appropriate for companies that evenly match both the amounts and maturities of their hedges and underlying exposures. That was not the case for MGRM, which matched the amounts but not the maturities. This mismatch had toxic cash-flow implications because futures contracts (i.e., the hedges) are marked to market on a daily basis and forward contacts are usually not. By employing a more conservative hedge ratio that considered this maturity mismatch, MGRM’s liquidity problems could have been significantly reduced. In fact, its one-to-one stack-and-roll hedge ratio may have been more speculative than a totally unhedged position. Post-crisis analyses have shown that MGRM should have used hedging ratios that were half (or less) than the one-to-one ratio it used.58
Adjusting its hedge ratio to reflect the maturity mismatch created by its stack-and-roll hedge is just one way MGRM could have improved its risk mitigation performance. Another tool it could have used was tailing its hedges, which means adjusting the hedge ratio for the expected interest paid (or earned) on losses (or gains) from marking futures contracts to market on a daily basis.
MG Calls It Quits
By the fourth quarter of 1993, MGRM held positions amounting to 160 million barrels of unleaded gasoline, No.2 Heating Oil, and West Texas Intermediate crude oil. Of them, 55 million gallons (i.e., 55,000 contracts) were on NYMEX, and 110 million barrels were OTC contracts.59 Futures and OTC markets with sufficient liquidity for MGRM’s needs were very short term (e.g., fewer than four months). MGRM’s positions were a relatively large portion of daily exchange volume but a relatively low percent of total open interest. Nevertheless, there were fears that the company’s buy orders might have been substantial enough to raise futures prices relative to spot prices. It did not help that market participants knew MGRM had to enter the futures market each month as a massive buyer. Clever traders may have used this knowledge to their own benefit by intentionally distributing their buy and sell orders throughout the month to take advantage of any MGRM-induced spikes in futures prices.60
The reduction in energy prices and shift from backwardation to contango caused MGRM’s stack of futures positions to hemorrhage cash, as they were marked to market daily at substantial losses and then rolled over. Because the company was hedging 160 million barrels of forward contracts, margin calls in some months approached $90 million.61 The combined effect of margin calls and MGRM’s reported losses sent an alarm through MG that served as a wake-up call for the company’s management board, board of directors, and major shareholders.62 To stem the tide of red ink, Heinz Schimmelbusch, MG’s CEO, and Ronaldo Schmitz, Chairman of MG’s board, decided to liquidate MGRM’s futures positions.63
MGRM Butts Heads with NYMEX and the CFTC
MGRM’s cash woes became a concern not only to MG’s board of directors (supervisory board) but also to NYMEX and the Commodity Futures Trading Commission (CFTC). To transact its volume of business, MGRM needed permission from NYMEX to exceed the exchange’s trading limits. When MGRM’s positive cash flows turned massively negative, the exchange tightened the reins by imposing super margin requirements, which only added to the company’s liquidity problems.
The CFTC charged MGRM with illegally selling off-exchange, energy-related futures products (i.e., contracts that had the attributes of futures contracts but were not listed on any exchange, which meant they were not regulated by the CFTC). The CFTC labeled MGRM’s contracts “speculative” because delivery of the physical assets rarely took place.64 These charges increased the perceived risk of MGRM’s future business prospects and challenged its entire business line.65
To many observers, the CFTC’s charges were absurd. Of course, MGRM was selling off-exchange, energy-related, futures-like derivative products. That was its strategy and the value-added MGRM brought to the market.
MGRM’S Profitability: It’s All in How You Account for It
Declining prices and the shift from backwardation to contango had asymmetric effects on reported earnings of U.S.-based MGRM and German based MG. German companies followed lower-of-cost-or-market (LCM) accounting rules, which required companies to report material gains and losses on derivative transactions when they occurred. When absolute and relative oil and gas prices moved unfavorably, MG was required to report immediately the losses from its stack of near-dated futures contracts (i.e., the hedges) but could not offset them with the expected gains (at current prices) on MGRM’s ten-year string of forward contracts. In the United States, “qualified companies”66 could use hedge accounting standards, which allowed them to net the losses/gains on their hedges (e.g., MGRM’s stack of futures contracts) with the gains or losses on identified transactions (e.g., the ten-year string of forward energy contracts). The symmetry created by combining the effects of these offsetting transactions stabilized company earnings.
As a result, evaluating the performance of MGRM differed greatly depending on the accounting lens used. To the German parent, MGRM had become a huge anchor dragging down quarterly profits, but to U.S.-based MGRM, profitability was hardly affected by changing market conditions. These accounting differences help to explain MG’s reaction (or overreaction) to MGRM’s trading strategy.
MGRM’S Credit Rating
The market did not react well to the losses reported by the German parent and to the U.S. affiliate’s excessive cash outflows. Consequently, MG’s credit rating was lowered, which increased the company’s borrowing costs and resulted in many of its counterparties (i.e., swap and forward) requiring increased collateral and margin to back MG’s transactions, now perceived as riskier. Because MGRM was suffering from a liquidity problem and not a long-term profitability problem, the downgrade of MG’s credit rating could not have come at a worse time. It added to the company’s cash flow troubles.
The Effects of an Itchy Trigger Finger
It is unclear whether MG’s management board and board of directors understood that Arthur Benson’s strategy added less risk to MG’s long-term profitability compared to its effect on short-term liquidity. MGRM became a market maker in long-dated energy derivatives, and in doing so, it staked out a position that required the company to accept commodity price risk in crude oil, gasoline, and heating oil.
Unfortunately, when the smoke cleared and the situation could be assessed under calmer conditions and in the light of better perspective, MG’s reaction to MGRM’s losses and cash outflows appears to have been blunt and draconian. Schimmelbusch and his team (supported by the MG board of directors) appear to have overreacted, resulting in considerable self-inflicted injuries.
What MG’s management failed to grasp was stack-and-roll hedges, with properly weighted hedge ratios, could have been an effective defense against volatile price fluctuations. The team also failed to appreciate that MGRM’s cash outflows and losses were short term, and not a reflection of the affiliate’s long-term profitability. Illiquidity was the main problem, and not long-term viability or asset quality. This conclusion should have the ring of common sense. After all, MGRM was hedging a long-term series of short (i.e., sell) forward contracts with a stack of short-term, long (i.e., buy) futures contracts, which meant that any losses on its futures positions were expected to offset, as closely as possible, the profits incurred on the company’s forward positions (and vice versa).
Was MGRM Hedging or Speculating?
What was in the minds of Arthur Benson and his MGRM colleagues? Were they consciously betting on rising prices? Were they wagering that the oil market would remain in backwardation, or were they ignorant of the risks inherent in their strategy and simply hedging forward transactions at what they thought would be profitable margins?
In retrospect, it appears that MGRM tried to hedge its ten-year chain of monthly, fixed-rate forward contracts. The problem was these hedges were effective mainly at stabilizing U.S. profits and not the company’s cash flows, which meant that MGRM was still exposed to the risks associated with rollovers and liquidity, as well as changing price structures and funding rates. By not hedging, or at least mitigating, the risks connected to its long-term derivative contracts, MGRM would have been speculating with shareholder funds. To the extent that MGRM over-hedged its position (i.e., using a one-to-one hedge ratio instead of something smaller), it was also speculating.
The opinion that these losses were the result of unintended, passive speculation is a possible explanation, but not an excuse, for Benson’s oversight because he and his team at MGRM were supposed to be experts at using state-of-the-art knowledge to offer customers forefront risk management products. As experts, they should have been aware of these cash-flow risks and communicated them to MG’s managers and board of directors so that upper management could have made informed decisions about the levels of risk to bear. At the same time, MG’s management team should not have felt blindsided by the cash flow effects of changing economic conditions (i.e., declining oil prices and contango).
Corporate Governance Issues
Who in MG should have had ultimate responsibility for controlling MGRM’s activities? The answer to this question addresses the issue of corporate governance and the role played by MG’s board of directors and management committee. If MGRM’s transactions were speculative, the board of directors (i.e., the MG supervisory board) was culpable for not having established risk management systems that would have brought exposures of significant magnitude to light. Its management committee was also to blame for not monitoring more closely the trading activities of MGRM. The most embarrassing aspect of the episode was that losses of $1.33 billion seem to have come as a surprise to MG’s board of directors and management committee. If the board was deceived, as it claims, then there is an explanation for the surprise, but not an excuse for it.
Boards of directors are not supposed to be involved in the operations of companies. They are there to protect shareholders by ensuring that early warning systems are in place to identify risks and catch exposures before they become too large. Such systems do not appear to have been in place, and, on these grounds, MG’s Board can be criticized. The Board can also be criticized for its knee-jerk response to the MGRM problem once it became known. In retrospect, a slower, more considered reaction would have been preferable.67 Fearing that MGRM’s losses might reach $50 billion (yes, that’s billions), MG’s board of directors fired Benson and Meinhard Forster, MGRM’s CFO, and put new management into place. The marching orders for the new management team were to liquidate, as soon as possible, the company’s huge exposures and rescue the company from bankruptcy.
The quick action of MG’s board and MGRM’s new management was controversial. Some leading financial experts68 and many industry analysts criticized MG for compounding the problem by acting impulsively and hurting long-term profitability for the sake of temporary liquidity relief. Liquidating MGRM’s futures positions left the company with unhedged, short forward positions, extending ten years into the future. These critics had a good point; after all was said and done, MGRM’s competitive advantage was supposed to emanate from its experienced, talented staff, hedging know-how, and the substantial financial resources of MG. If the critics were correct, MG realized greater losses than if it had done nothing.
The new management of MGRM liquidated most of its positions between December 20 and 31, 1993, when oil and gas prices were at their lowest levels. Therefore, futures market losses were at their highest levels. As illustrated, in December 1993, when much of the liquidation took place, WTI69 oil prices were approximately $14.50/bbl. By July 1994, they had increased to nearly $19.65/bbl. Gasoline and heating oil prices followed the same pattern. Had MG found a way to finance its liquidity problems and unwind its positions gradually over an extended period, many of its sizeable losses would have turned into sizeable gains. In the board’s defense, everything is obvious in hindsight, but if the board had a stronger understanding that MGRM’s troubles were related to short-term liquidity rather than long-term profitability, it might have acted differently.
In December 1993, MGRM declared losses of approximately $1.33 billion. They almost exhausted MG’s equity capital. The company survived only after negotiating a $1.9 billion rescue with about 150 German and international banks.70
Conclusion
MGRM’s financial debacle taught some important lessons, such as hedging is important, the type of hedge employed matters, and take extreme caution when assuming the future will be like the past. It also taught that applying an effective hedge is not enough. Management must also fully understand and transparently communicate the effect these hedges have on cash flows and profitability. MGRM failed to do this.
There is an old adage that profit is an opinion but cash is a fact; MGRM learned the hard way the truth of this aphorism. Metallgesellschaft AG has been placed on many analysts’ Wheel of Misfortune, but its predicament was related more to illiquidity than it was to long-term profitability problems. In the end, MGRM failed because it violated three of the most fundamental rules of risk management, which are: (1) identify all the risks inherent in the products you offer; (2) limit the variety of risks to those you can efficiently manage; and (3) keep the risks you are willing to bear to reasonable levels.
Review Questions
- What major risks did MGRM identify? What major risks did MGRM fail to identify?
- Was MGRM’s decision to use stack-and-roll hedges the reason for its colossal losses? What risks cannot be hedged with stack-and-roll hedges?
- Would MGRM have had the same cash-flow problems if it had been able to buy and sell long-term energy derivatives in the forward market (i.e., rather than using the futures market to cover its net forward positions)?
- What are contango and backwardation, and why were they important to MGRM’s situation? Why is there often backwardation in the oil markets?
- Why is the size of the stack so important to the cash-flow effects of the stack-and-roll hedge but less important to the profit-and-loss effects when hedge accounting is used?
- In common-sense terms, explain why the profit-and-loss effects of a stack-and-roll hedge do not depend on the direction of change in oil prices when hedge accounting is used.
- What corporate governance changes could MG’s management have made to reduce the chances of being surprised in the future by mishaps, like MGRM?
- What should the MG’s board of directors have done differently? Did corporate governance fail?
- On what grounds, if any, can the CFTC be criticized for aiding and abetting the MGRM disaster?
- Was MGRM hedging or speculating?
Bibliography
Anonymous. “Dreaming of Butterflies.” The Economist 327(7817) (June 26, 1993), 65–71.
Anonymous. “Metallgesellschaft: Germany’s Corporate Whodunit.” The Economist 334 (7900) (February 4, 1995), 71.
Culp, Christopher and Miller, Merton. “Hedging in the Theory of Corporate Finance: A Reply to Out Critics,” Journal of Applied Corporate Finance 8(1) (Spring 1995), 121–127.
Culp, Christopher and Miller, Merton. “Metallgesellschaft and the Economics of Synthetic Storage.” Journal of Applied Corporate Finance 7(4) (Winter 1995), 62–76.
Culp, Christopher and Miller, Merton. Corporate Hedging in Theory and Practice: Lessons from Metallgesellschaft. London: Risk Publications, 1999.
Culp, Christopher L. and Hanke, Steve H. “Derivative Dingbats.” International Economy 8(4) (July–August 1994), 12–19.
Edwards, Franklin R. and Canter, Michael S. “The Collapse of Metallgesellschaft: Unhedgable Risks, Poor Hedging, or Just Bad Luck?” Journal of Applied Corporate Finance 8(1) (Spring 1995), 86–105.
Group of Thirty Global Derivatives Study Group. Derivatives: Practices and Principles. Washington, D.C.: The Group of Thirty, July 1993.
Jacque, Laurent L. and Avsen, James. “When a Hedge Is a Gamble: An Empirical Investigation (1993 – 2002) of Metallgesellschaft’s High Stake Debacle,” Financier 11/12, 2004–2005.
Krapels, Ed. “Re-examining the Metallgesellschaft Affair and Its Implications for Oil Traders.” Oil & Gas Journal (March 26, 2001), 70–77.
Lorsch, Jay and Graff, Samantha Kate. Governance at Metallgesellschaft (A). Product number: 9-495-055. (Harvard Business School, July 10, 1996), 13.
Mello, Antonio S. and Parsons, John E., “Maturity Structure of a Hedge Matters: Lessons from the Metallgesellschaft Debacle.” Journal of Applied Corporate Finance 8(1) (Spring 1995), 106–120.
Order Instituting Proceedings Pursuant to Sections 6 and 8a of the Commodity Exchange Act and Findings and Order Imposing Remedial Sanctions. CFTC Docket No. 95-14 (July 21, 1995).
Pirrong, Stephen Craig. “Metallgesellschaft: A Prudent Hedger Ruined, or a Wildcatter on NYMEX?” The Journal of Futures Markets 17(5) (1997), 543–578.
Shirreff, David. “In the Line of Fire.” Euromoney 299 (March 1994), 40–49.
Taylor, Jeffrey and Sullivan, Allanna. “German Firm Finds Hedges Can Be Thorny.” The Wall Street Journal, Eastern Edition (January 10, 1994), C1.
W. Arthur Benson vs. Metallgesellschaft Corp. et. al. Civ. Act. No. JFM-94-484. U.S. District Court for the District of Maryland (1994).
Wolfert-Elmendorff Deutsche Industrie-Treuhand GmbH und C&L Treuarbeit Deutsche Revision. Special Audit of Metallgesellschaft Aktiengesellschaft (1995).