
Chapter 5
Orange County
The Largest Municipal Failure in U.S. History
In December 1994, Orange County, California filed for bankruptcy. Reporting a $1.5 billion loss on a net investment portfolio of $7.6 billion, the county earned the ignominious distinction as the largest municipal bankruptcy in U.S. history. During the six weeks after bankruptcy was declared, administrators sold off Orange County’s portfolio of investments at fire-sale speed, turning its unrealized losses of $1.5 billion into realized losses of more than $1.6 billion.
News of the insolvency shocked national and international financial markets, which were already reeling from previous derivative-related failures, such as Metallgesellschaft111 and Procter and Gamble.112 Many feared that if Orange County, a rich, thriving, conservative community of 2.6 million people, could default, who was safe?
Even though the Orange County debacle was similar, in many ways, to the other derivative-related failures of the 1990s, it maintained its own special character because a county government, not a company, had failed, and the rules governing such bankruptcies were nebulous. In addition, the Orange County failure was disconcerting because it materialized quickly, almost from nowhere—like a massive submarine surfacing next to an unsuspecting rowboat—and challenged common perceptions of what “safe” meant.
Robert Citron and the Orange County Board of Supervisors
Most observers believed that Orange County’s investments were being managed wisely and well by treasurer–tax collector Robert Citron, a thirty-five-year resident of Orange County and an elected, seven-term incumbent with twenty-four years of experience as treasurer. Citron was considered a levelheaded, hard-working public official, who lived a comfortable but modest life and derived pleasure from providing his constituency, the people of Orange County, with financial rewards beyond their expectations. Citron lacked a formal university degree, but he was far from uneducated. He learned on the job, and his professional ascent in Orange County was rapid.
Hired as Orange County’s deputy tax collector in 1960, Citron was elected in 1970 as tax collector; in 1973, the tax collector and treasurer positions were combined. Citron was not an articulate speaker, and his written explanations of Orange County’s investment strategies were opaque, but most people in Orange County were willing to forgive these failings and let his performance do the talking for him. After all, his results were impressive: For the first twenty-two years of his tenure as Orange County’s treasurer–tax collector, Citron earned an average return of 9.4 percent compared to the 8.2 percent return on the state of California’s pool. For the twelve-year period prior to the collapse in 1994, Citron’s return was nearly double the return on the state of California’s portfolio (7.8% vs. 4.2%).113
Orange County had no mayor, chief executive officer, or chief financial officer; so Citron reported, but was not directly accountable, to the Orange County Board of Supervisors, a group of five popularly elected officials (see Table 5.1). He also reported to the Orange County Administrative Officer. Although supervision appeared to be adequate, in fact, it was relatively weak. Of the five board members, only one had any formal training in finance, and some of them were convinced (incorrectly) that the board had no legal supervisory powers over the treasurer–tax collector.114
Most of the Orange County Board thought that Citron’s financial reports lacked timeliness (Citron reported only yearly) and quality, but no one was willing to rock the boat and challenge his record of success. The Chairman of Orange County’s Board of Supervisors summarized the feelings of the group in 1994 when he said: “[Citron] is a person who has gotten us millions of dollars. I don’t know how in the hell he does it, but he makes us all look good.”115
Whether by dint of success or by virtue of familiarity, Citron gradually assumed the role of Orange County’s authoritarian, albeit benevolent, financial godfather. Unopposed in six elections, he was regarded as a man who would go out of his way to support good projects and worthy causes. Having been in the treasurer–tax collector’s job as long as he was, Citron must have been very familiar with the county’s assets and liabilities, as well as the back alleyways between various accounts. At times, he used these alleyways in creative ways to extinguish occasional financial fires. “I’ve tried to run my office like it was my own personal business, for profit, for the taxpayers of Orange County,” said Citron in 1994.116
Table 5.1: Orange County Board of Supervisors: 1994
| Name | Background | |
| 1 | Thomas Riley | Riley was a twenty-year incumbent on the Orange County Board of Supervisors, who was due to retire in January 1995. |
| 2 | Roger Stanton | Stanton was the longest-serving member of the Orange County Board of Supervisors. A full professor of Management at California State University, Long Beach, he was elected in 1980 after serving seven years on Fountain Valley’s City Council. Stanton was Chairman of the Board of Supervisors at the time of the bankruptcy. |
| 3 | William Steiner | Steiner was appointed to the Orange County Board of Supervisors in March 1993 and elected in 1994. Formerly, he was an Orange County council member, president of the Orange Unified School District, and head of the Orangewood Children’s Home for abused and neglected children. Steiner also taught a class on child abuse at Chapman University. |
| 4 | Gaddi Vasquez | Vasquez was hired in 1960s as an Orange County police officer. He was later appointed executive assistant to Bruce Nestande, Orange County Supervisor (1980–84). Vasquez also worked as an executive at Southern California Edison (1984–85). In April 1987, he was appointed to the Orange County Board of Supervisors, and, in 1988 and 1992, he won election to the Board. Vasquez was widely recognized as one of the most prominent Hispanic politicians in the United States with bright political prospects. |
| 5 | Harriet Weider | Weider was a long-standing incumbent due to retire in January 1995 |
Citron acquired the reputation as one of the most capable county treasurers in the United States; yet, as his standing grew, Citron’s tolerance for criticism fell. He came to resent challenges to his authority in financial matters, and he took personal umbrage at any form of criticism. This disdain for confrontation and criticism was evident in 1994 when John Moorlach117 ran for treasurer–tax collector against Citron, just as Orange County’s portfolio began to decline in value. Moorlach’s election platform focused on the speculative risks Citron was taking with public funds, as well as the lack of supervision and oversight exercised by the Orange County Board of Supervisors.
From April until the election in June, Moorlach hammered relentlessly on themes of Orange County’s declining portfolio value and shrinking profit margins. “This listing is junk,” said Moorlach, as he railed against Citron’s inventory of investment holdings because it was impossible to determine their value or risks.118 News stories of these criticisms were reported and embellished in national publications, such as The Wall Street Journal, and in more specialized business periodicals, such as Derivatives Week and Bond Buyer.
By contrast, Citron’s re-election platform took the spotlight off risk and focused on return. Citron characterized Moorlach as a reckless proselytizer, whose slanderous statements could cost Orange County millions of dollars in added expenditures by raising borrowing costs. Regarding Moorlach’s contention that profit margins were shrinking, Citron explained that, during the past fifteen years, spreads between borrowing costs and reinvestments had been as low as 0.25 percent and as high as 3 percent. Therefore, the current spread, about 1.5 percent, was still quite healthy.119
Citron assured the public that any losses pointed to by Moorlach were “paper losses” that never would be realized because the assets purchased were regulated by the State and by Orange County’s charter. Only securities with the lowest default risk, like U.S. government securities, U.S. agency securities, and investment-grade corporate debt were approved. Citron explained that Orange County’s portfolio bore almost no default risk, and so long as the securities could be held until maturity, their full value could always be recovered. A forced sale of assets was a remote possibility, but only if cash was insufficient to meet the margin calls of brokers and dealers, as well as the day-to-day demands of investors; again, Citron reassured voters that Orange County had more than sufficient liquidity to meet any and all demands. In short, voters had nothing to worry about. In the June election, Moorlach won nearly 40 percent of the Orange County votes, but it was not enough. Citron had won the confidence of voters, media, analysts, the investment community, state officials, city supervisors, and regulators. He seemed to be above suspicion and beyond reproach, which explains much of the reason why he was able to accumulate such massive speculative positions and carry them as long as he did.
The Orange County Investment Pool
The Orange County Investment Pool (OCIP) was a $7.6 billion portfolio, managed by Citron for the benefit of Orange County and about 200 other municipal entities, such as cities, school districts, special agencies, water works, a regional transportation agency, pension funds, and sanitation authorities (see Table 5.2). OCIP was the portfolio into which these municipal entities deposited excess funds and the pool from which they made their operating and capital expenditures.
Table 5.2: Investors in the Orange County Investment Pool: November 30, 1994
| Municipal Entity | Percent of OCIP Portfolio |
| Orange County | 37 |
| Orange County Transportation Authority | 15 |
| School districts (60) | 14 |
| Cities (37) | 14 |
| Water districts (11) | 7 |
| Orange County Sanitation District | 6 |
| Transportation corridor agencies | 4.5 |
| Orange County Employee Retirement System | 2 |
| Other | 0.5 |
| Total | 100% |
Source: Based on figures in Philippe Jorion with the assistance of Robert Roper, Big Bets Gone Bad: Derivatives and Bankruptcy in Orange County, Academic Press, 1995, p. 124.
For many of these municipal investors, OCIP was the mandatory investment vehicle for their surplus funds,120 but Citron’s accomplishments attracted other participants (e.g., Orange County Transportation Authority, Orange County Sanitation District, and Irvine Water District), which voluntarily invested funds to enjoy the benefits of his investment success.121 A few of them (e.g., four school districts, like Irvine and Newport-Mesa, and water boards, like Irvine Ranch Water District) went even further and leveraged their positions by borrowing funds to invest in OCIP.
Centralizing the investments of these relatively small municipal groups made good investment sense. It enabled them to enjoy professional fund management, including all the cost-saving benefits that come from purchasing investments in bulk and the risk-reducing benefits that come from portfolio diversification. These municipal entities relied on Citron to make wise investment decisions, and under normal circumstances, one would expect “wise investment decisions” to be those that put top priority on preserving investors’ capital base and ensuring adequate liquidity to meet their needs for funds. By contrast, Citron put his highest priority on earning above-average returns because California municipalities, including Orange County, were feeling the pinch of insufficient tax revenues.
A primary cause of the lack of tax revenue was Proposition 13, an act passed in 1978 and generally viewed as a visible manifestation of California taxpayers’ revolt against high and rising property taxes. Due to the surge of inflation during the 1970s, California property values and the taxes on these properties soared. Unable to meet the rising tax demands, some voters were forced to sell their homes. Voters reacted by passing Proposition 13 with nearly a two-thirds majority, cutting California’s notoriously high property taxes drastically by limiting them to no more than 1 percent of a property’s assessed value or fair market value, and limiting the annual increase of a property’s appraised value, unless the property was sold.122 The resulting decreased tax revenues, in conjunction with a short recession in the early 1990s and growing public expenses, led to burgeoning deficits and drastic cutbacks of state funding to municipalities in 1993.
In this environment, Robert Citron became the source of desperately needed public funds and a hero to many Orange County residents. The average return on his portfolio was significantly above the return earned by many private portfolio managers and appreciably above the returns earned by the state of California. In 1993 (prior to the collapse), Citron could have boasted that, while he was treasurer–tax collector, his investment decisions had earned Orange County residents about three-quarters of a billion dollars more than they would have earned if their funds had been invested in the state government fund.123
In 1994 (the year of the election), 12 percent of Orange County’s revenues came from interest income on investments, as compared to the average of 3 percent for all other California counties, and in his fiscal budget for 1995, Citron promised to increase the portion of Orange County’s interest earnings to 35 percent of its revenues.124 Citron’s efforts to increase OCIP’s portfolio returns were encouraged by the state, which decided in the early 1990s to relax restrictions on the types of investments municipal entities could make, allowing Citron to invest in some riskier assets that could bring higher returns.
The Major Risks Facing Assets in the OCIP Portfolio
Endemic to all investment portfolios are three major risks: credit risk, market risk, and liquidity risk. Unfortunately, Citron, his supervisors, and state and federal regulators focused most of their attention on credit risk and trivialized OCIP’s vulnerability to market risk and liquidity risk.
Credit Risk
Credit risk is the chance that the issuer of a security will be either unable or unwilling to repay its debts. The full benefits of owning investments with low credit risk are derived if these investments can be held to maturity. Under such circumstances, owners are ensured that they will receive back, not only the principal of their investments but also, the full investment yield. On these grounds, the OCIP portfolio was rock-solid safe because the assets Citron purchased were restricted to securities issued by the U.S. government, U.S. government agencies (e.g., Import-Export Bank), and high-quality companies (e.g., Bank of America and Ford Motor Company), all of which had a very low chance of declaring bankruptcy.
Market Risk
Market risk is the variation in the price of an asset (or liability) due to changes in financial variables (e.g., interest rates, exchange rates, stock prices, and/or commodity prices). There is an inverse relationship between the price of a fixed-income security and its yield, and the longer an asset’s maturity, the greater is its potential price variation for each percentage change in yield. Market risk has nothing to do with whether borrowers can or will repay their debts, but rather it captures the possible change in an asset’s value if it is sold prior to maturity. The issuers of this debt (i.e., the borrowers) are under no obligation to repay their liabilities before maturity; so, if investors want their funds back early, they must sell their securities for what the market bears. As interest rates rise, the prices of fixed-income securities fall, and these investors incur capital losses. Likewise, if interest rates fall, the prices of these securities rise and investors earn capital gains.
Table 5.3 shows how the prices of four zero-coupon securities with different maturities vary when interest rates rise from 3.5 to 7 percent (as they did during 1994). Notice that the one-year bill changes in value by only –3.3 percent, but the five-, ten-, and twenty-year securities change by about –15, –28, and –49 percent, respectively. The longer the maturity, the greater is the decline in the price of a fixed-rate note when interest rates rise. Portfolio managers, who are caught in a position where they have to sell fixed-income assets as interest rates rise, could lose a considerable amount of capital.
Table 5.3: Change in Price of Zero Coupon Securities with One-, Five-, Ten-, and Twenty-Year Maturities When Yields Rise from 3.5 to 7.0 Percent (Face Value = $1,000)

Orange County faced substantially more market risk than credit risk because OCIP was invested mainly in medium-term securities, and it was highly leveraged (i.e., large amounts were borrowed to finance the purchase of securities). As a result, the value of the OCIP portfolio varied significantly with changes in market yields.
Liquidity Risk
Liquidity is the ability to turn an asset into cash quickly and without substantial loss of value. Liquidity risk for a fund manager is the chance of not having sufficient cash on hand to meet demand. With regard to liquidity risk, investment funds are like banks. If a large number of customers suddenly demand their deposits, no bank or fund would have enough cash on hand to meet that demand. This means, even if a fund’s assets were safe from credit risk, it could fail for lack of liquidity.
Liquidity risk can be tied directly to market risk because if interest rates rise and the value of a portfolio falls, investors could decide to withdraw their funds, thereby forcing portfolio managers to sell investment assets at their low current-market prices, resulting in losses that could threaten the fund’s solvency. By outward appearances, OCIP had more than enough cash assets to meet normal demands by customers, brokers, dealers, and creditors. Nevertheless, in a crisis, cash demands become amplified, magnifying liquidity risk.
Although Citron and the Orange County board believed OCIP was protected from credit risk due to the constraints on the types of investments Citron could make, it was vulnerable to the confluence of all three risks. An overview of OCIP’s assets and funding sources demonstrates this vulnerability.
OCIP’s Assets and Funding Sources
In December 1994, OCIP’s portfolio consisted of 206 non-cash assets, most of which were high-quality (i.e., low credit risk), fixed-income securities and structured notes. Table 5.4 separates the assets in OCIP’s portfolio into two groups. The assets in Group 1 were the major causes of Orange County’s collapse; therefore, they are the focus of this section. The assets in Group 2 had a relatively small impact on OCIP’s financial health and, therefore, are explained briefly in Risk Notepad 5.1: Other Assets in the OCIP Portfolio. When U.S. interest rates rose precipitously in 1994, two major asset types accounted for more almost 84 percent of the OCIP portfolio’s losses: inverse floating-rate securities, which are a type of structured note, and fixed-income securities.
Table 5.4: Balance Sheet of Orange County Investment Pool: December 1, 1994 (Millions of Dollars)

* Figures in parentheses represent the number of securities purchased in each asset and liability group.
** Percentage figures in parentheses represent the portion of assets or liabilities.
Structured Notes
Almost 40 percent of the OCIP portfolio was invested in structured notes.125 Structured notes are customized investments with periodic payments that depend on future changes in market variables, such as interest rates, exchange rates, stock prices, and commodity prices. Brokers and dealers like structured notes because they are customized and earn greater commissions and fees than straight bond or note issues; investors like them because they offer opportunities not readily available in the market. Robert Citron responded to the incentives of structured notes by investing almost $8 billion in these securities. Such investments would have posed no problems had Citron fully understood their risks, but therein was the problem.
Despite a lack of understanding, Citron invested heavily in four types of structured notes with varying degrees of risk. Of the four types, inverse floating-rate notes were the largest category and a major source of OCIP’s losses.
Risk Notepad 5.1
Other Assets in the OCIP Portfolio
The assets listed in Table 5.4 under the heading Group # 2: Other Assets in OCIP’s Portfolio were a relatively small portion of the total investment.
Cash and Collateralized Mortgage Obligations
About 3 percent of the OCIP portfolio was invested in low-interest earning cash assets, consisting mainly of overnight repurchase agreements and money market accounts, and about 1 percent was invested in collateralized mortgage obligations (CMOs). CMOs are investment-grade securities, backed by pools of mortgages with fixed maturities. They separate monthly cash flows from their mortgage pools into future payments based on their interest, principal, or a combination of principal and interest. CMOs offer investors benefits, among which are an assortment of maturities (short-, medium-, or long-term), a broad secondary market providing liquidity (which mortgages alone would not supply), and can have very high credit ratings (e.g., AAA), due to their collateral backing.
Structured Notes
Besides inverse floaters, the OCIP portfolio was composed of three other types of structured notes: dual-index notes, floating-rate notes, and index-amortizing notes.
Dual-Index Notes
Less than 1 percent of OCIP’s assets was invested in dual-index notes. These are securities with coupon rates that depend on the difference between two different indexes, such as the constant maturity rate on U.S. Treasury securities and LIBOR. The maturities of dual-index notes can vary, but typically, they offer a fixed rate of return in the short term (e.g., the first two years) and a variable rate thereafter. For example, the coupon on a dual-rate note might begin with a fixed rate of 5 percent for the first two years and then change to a floating-rate equal to the ten-year U.S. Treasury bond rate minus the 6-month LIBOR. Dual-index notes are often used to bet on changes in the shape of the yield curve.
Floating-Rate Notes
Less than 3 percent of Orange County’s assets were invested in floating-rate notes. Floating-rate notes (FRNs) are securities whose returns vary directly with a particular money market instrument or money market index. Because these rates vary frequently, FRNs have very low market risk (i.e., their values do not change substantially with time).
Index-Amortizing Notes
Slightly more than 8 percent of the OCIP portfolio was invested in index-amortizing notes (IANs). Similar in design to collateralized mortgage obligations, index-amortizing notes are debt instruments for which payments on the (notional) principal are tied to changes in a short-term money market rate, such as LIBOR or a money market index. As interest rates rise, the maturities of IANs increase; as market interest rates fall, the maturities of IANs decline. Because IAN maturities are generally less volatile than the maturities of CMOs, IANs appeal to many risk-averse investors, who want to carry the type of risks inherent in CMOs.
Inverse Floating-Rate Notes
Most of OCIP’s structured notes and more than 26 percent of its total assets were placed in inverse floating-rate notes (also called inverse floaters or reverse floaters). As the name suggests, inverse floaters are financial instruments whose returns vary inversely with market interest rates, rather than directly, as would be the case with floating-rate notes. When market rates rise, inverse floaters earn lower returns; when rates fall, the returns on inverse floaters rise.
An example demonstrates how the return on an inverse floater varies with market rates. Suppose on January 1, 1993 a portfolio manager purchased an inverse floater that earned an annual return equal to 7 percent minus the six-month LIBOR. If the six-month LIBOR rate on January 1 were 4 percent, then the inverse floater would earn a 3 percent annual return (i.e., 7% – LIBOR of 4% = 3%), which means it would earn just 1.5 percent for the six months from January to June (i.e., 6/12 × 3% = 1.5%). On July 1, six months later, the return would change. If LIBOR rose to 5 percent, the annual return on the inverse floater for the following six months would fall from a 3 percent to 2 percent (i.e., 7% – LIBOR of 5% = 2%), earning 1 percent from July to December; if interest rates fell to 3 percent, the annual return on the floater would rise to 4 percent (i.e., 7% – LIBOR of 3% = 4%), earning 2 percent for the second half of the year.
Robert Citron was betting on falling U.S. interest rates; so, it is easy to understand why inverse floaters were appealing to him. Inverse floaters also could be tailored to fit his risk specifications, and Citron’s inverse floaters were often structured to carry an extra wallop when interest rates changed. Some of his super-charged inverse floaters were designed to pay off at twice the change in LIBOR (e.g., 8% – 2 × LIBOR, rather than 8% – 1 × LIBOR), but there was a flip side. As interest rates rose, the earnings on these structured notes fell at twice the rate of a normal inverse floater.
Fixed-Income Securities
Fixed-income securities were the meat and potatoes of the OCIP portfolio. Constituting nearly 58 percent of the pool’s assets, these securities paid either a fixed rate of interest or a rate that varied according to a predetermined schedule. They carried virtually no credit risk because the issuers were high-quality borrowers, such as the U.S. government, U.S. agencies, and first-class corporations. The average maturity of OCIP securities was under three years, but because these investments were leveraged, the impact of changing market rates on their values was amplified. As U.S. interest rates rose, the value of these securities plunged.
OCIP’s Funding Sources
In addition to concern about the composition of OCIP’s assets, there was also concern about the structure of its funding sources. Investors contributed only $7.6 billion to OCIP, but, as Tables 5.4 and 5.5 show, the pool held assets equal to $20.5 billion. The difference between OCIP’s total assets and investors’ funds (i.e., almost $13 billion) was the amount Citron borrowed to finance additional assets. The ratio of OCIP’s total assets to its equity, 2.7, was the leverage of OCIP’s portfolio (see Table 5.5).
Table 5.5: Orange County Investment Pool Portfolio: December 1, 1994 (Millions of Dollars)
| Book Value | Percent of Portfolio | |
| OCIP assets purchased with investors’ funds | 7,550.4 | 37% |
| OCIP assets purchased with borrowed funds (i.e. reverse repurchase agreements) | 12,988.1 | 63% |
| Total Assets | 20,538.5 | 100% |
| Leverage factor = Total Assets ÷ Equity | 20,538.5 ÷ 7,550.4 = 2.7 |
Source: See Table 5.4.
Reverse Repurchase Agreements
To borrow such vast amounts, Citron made extensive use of reverse repurchase agreements (reverse repos, for short). To understand what went wrong at OCIP, it is crucial to understand what reverse repos are and how they can be used to leverage an investment portfolio. It is helpful to start with a short explanation of repurchase agreements (i.e., repos).126
A repo agreement is the spot sale of an asset with a simultaneous agreement to buy it back at a fixed price in the future. Usually, the asset sold and repurchased is a fixed-income security, and when the term repurchase agreement is used, securities dealers are the borrowers (i.e., the security sellers) and their customers are the lenders.
On one hand, repos are just like collateralized loans, but on the other hand, they are like forward contracts. Repos are like collateralized loans because borrowers pledge assets (e.g., fixed-income securities) that back their promises to repay principal and interest in the future. For the counterparty who sells a bond and agrees to repurchase it in the future (i.e., the borrower), a repo transfers possession of the security in return for hard cash. When the security is repurchased, the difference between the original sale price and the higher repurchase price is the effective interest paid.
When repo borrowers repay their debts (which is normally the case), they become owners of the pledged collateral and receive all the interest and capital gains accruing to these assets. But if repo borrowers are unable or unwilling to meet their contractual obligations, lenders take possession of the pledged collateral, and they can sell it to extinguish the debts. To lenders in a repo deal, credit risk depends more on the quality of the collateral than it does on the quality of the borrowers.
Repos are also like forward contracts because the repurchase prices of the pledged assets are identical to forward prices. The difference between the spot price (the current sale price of the security) and the forward (repurchase) price is like the capital gain earned on a derivative instrument. To borrowers, repos are like long forward contracts because they are agreeing to purchase assets in the future at prices agreed upon now. To the lenders, repos are like short forward contracts because they are agreeing to sell assets in the future at prices agreed upon now.
Figure 5.1 summarizes the cash flows of a repo agreement. Suppose a dealer enters into a one-year repo in which he pledges a fixed-income security in return for $100 million (see left side of Figure 5.1).127 At maturity (i.e., one year later, in this case), the dealer would repurchase the security for its principal plus the repo interest rate. Assuming the repo rate was 3 percent, the dealer would pay $103 million (see right side of Figure 5.1).

A reverse repo, which is how Citron borrowed most of his funds, is just like a repo agreement, except the roles of borrower and lender are reversed (see Figure 5.2). In a reverse repo deal, securities dealers are the lenders, who purchase securities from customers and agree to sell them back at a higher price in the future. Customers are the borrowers.
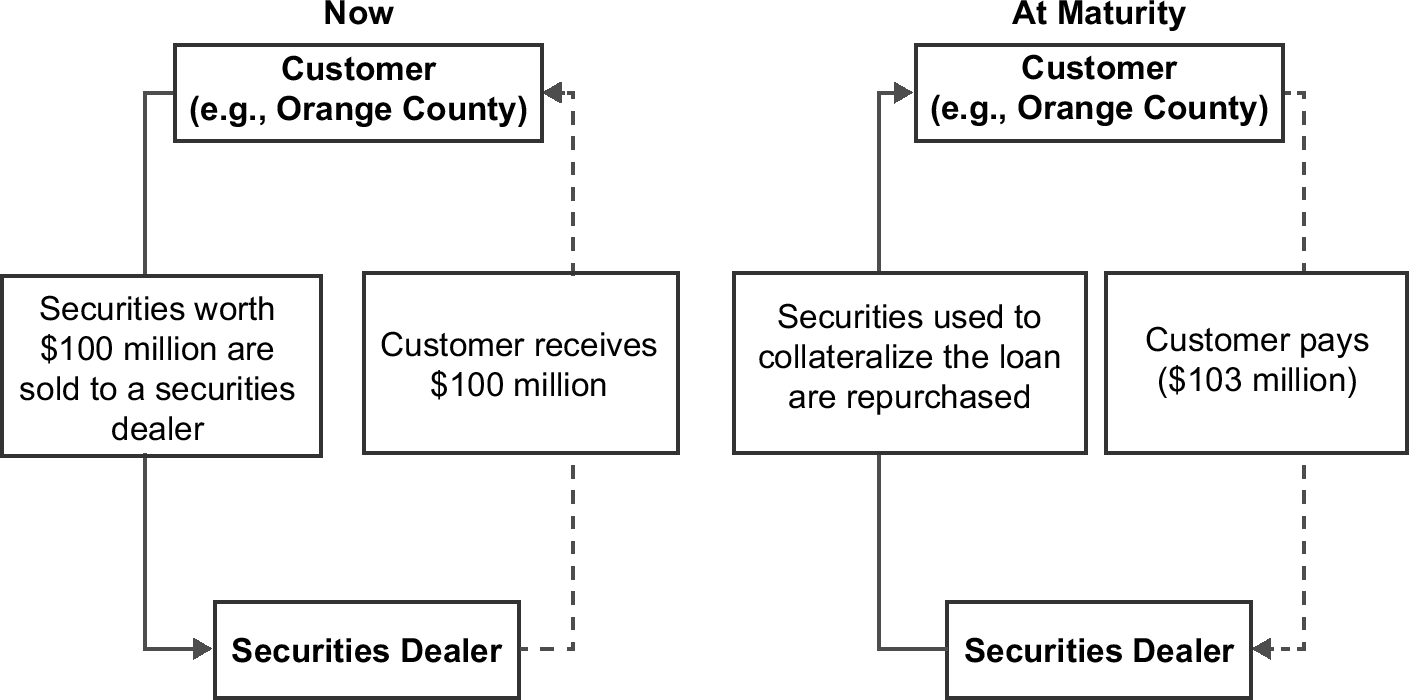
Leveraging the OCIP Portfolio
Repo and reverse repo agreements are normally low-risk, conservative ways to borrow and lend, but Citron used reverse repos to leverage the OCIP portfolio, increasing its assets from $7.6 billion to $20.5 billion. The assets he purchased carried almost no default risk. Nevertheless, due to their medium-term maturity and the leverage used to purchase them, the reduction in their market values, due to rising interest rates, was enough to cause the overwhelming majority (approximately $1 billion) of OCIP’s $1.64 billion losses.
An example clarifies the risks Citron took with Orange County’s portfolio. Suppose the portfolio manager of an investment fund purchased $100 million of five-year U.S. government bonds earning a yearly coupon of 3.5 percent.128 Not content with the return on these securities and willing to take a bit of risk with investors’ funds, suppose the portfolio manager entered, subsequently, into a one-year reverse repo agreement with Merrill Lynch.
Under the terms of the reverse repo agreement, the investment fund would sell Merrill Lynch the five-year U.S. government bonds for $100 million and agree to buy them back one year later at the prevailing one-year repo rate, which we will assume is 3 percent.129 As a result of the reverse repo deal, the investment fund would now have a fresh $100 million to invest for one year, and it would also have the obligation to repay Merrill Lynch $103 million at the end of the year. Assume the portfolio manager used the funds to purchase securities with the same maturity and yield as the ones delivered to Merrill Lynch (i.e., $100 million worth of five-year bonds with 3.5% coupons).
At the end of the year, the reverse repo would mature, and the fund would honor its reverse repo commitment by paying $103 million to Merrill Lynch. The funds used to repay its repo loan would come from selling the securities that the portfolio manager purchased at the beginning of the year. Assuming the newly acquired notes did not change in price, the investment fund would collect $103.5 million (i.e., $100 million in principal and $3.5 million from the 3.5% coupon on the securities). Because it needed only $103 million to repay Merrill Lynch, the investment fund would be left with a net gain of $0.5 million.
But the story does not end here. Having settled its reverse repo obligations to Merrill Lynch, the investment fund would receive back the securities it used to collateralize the reverse repo loan, and from these securities, it would earn $3.5 million (i.e., a 3.5% coupon on the $100 million security). As Table 5.6 shows, the reverse repo deal raises the investment fund’s return from the 3.5 percent, which it would have earned had it simply held onto the original government securities, to 4.0 percent, the return on the original securities plus the (borrow and invest) reverse repo deal.
Table 5.6: Using Reverse Repos to Enhance Investment Returns: An Example Assuming Unchanging Interest Yields

But why stop there? If the portfolio manager could guarantee investors a 0.5 percent return every time he entered into a repo agreement, then why not repeat the transaction multiple times and earn even more? This is precisely what Robert Citron did, and as long as interest rates fell or remained constant, his profits soared.
Effects of Leverage on OCIP’s Return
If you are asking yourself why falling or steady interest rates were crucial to Citron’s reverse repo strategy, the answer can be most clearly understood by seeing what happens to OCIP’s return when interest rates fall and comparing it to when interest rates rise.
OCIP’s Rising Returns: Effects of Falling Interest Rates
Even a cursory look at Figure 5.3 shows why Citron, at one time, was considered a financial genius. From 1989 to 1992, U.S. Treasury security yields fell steadily, with only minor interruptions. For example, the one-year Treasury bill rate fell from (about) 9.0 to 3.7 percent, and the five-year Treasury note rate slipped from (about) 9 to 6 percent. As a result, Citron’s heavy concentration of fixed-income securities was rewarded handsomely with capital gains, and his inverse floaters earned increasingly higher returns.

OCIP was able to profit from these falling interest rates. In 1994, OCIP’s leverage factor was approximately 3:1 (see Table 5.5), which means that for each $100 million worth of securities purchased with investor funds, an additional $200 million worth of securities were purchased with borrowed funds (e.g., via reverse repo agreements). Suppose that, on the $200 million of borrowed funds, OCIP paid an annual (reverse) repo rate of 3 percent, and on the $200 million worth of additional five-year government bonds, it earned 3.5 percent. At the end of the year, the counterparties (e.g., Merrill Lynch) would expect OCIP to repay the principal of $200 million principal on the reverse repo plus $6 million of interest (i.e., 3% of $200 million).
Robert Citron was betting that interest rates would fall, and if they did, he positioned OCIP to earn returns that were even more attractive because, in addition to the interest income, his securities would earn capital gains. Suppose at the end of the year, interest rates declined from 3.5 to 2 percent. OCIP’s original $100 million security would now be worth $107.07 million, a capital gain of $7.07 million.130 As well, the $200 million of securities purchased with borrowed funds (i.e., the reverse repo funds) would now be worth $214.14 million.131 With these funds, OCIP could repay its reverse repo debt amounting to $206 million (i.e., $200 million of principal plus $6 million of interest). As Table 5.7 shows, the effect of these capital gains raises OCIP’s total return on its $100 million of equity from 3.5 percent, which it would have earned with no leverage, 25.71 percent!
Table 5.7: Results of Leveraging Reverse Repos to Enhance Investment Returns: An Example Assuming Falling Interest Yields

In addition to the capital gains earned from falling interest rates, Citron also received another source of profits on his reverse repo agreements because from 1989 to 1992, the yield spread between medium-term and short-term interest rates rose. For example, Figure 5.3 shows that the spread between five-year U.S. interest rates and one-year rates grew from approximately 0 percent to more than 2 percent. As a result, Citron profited by borrowing, via reverse repos, from the short-term portion of the yield curve and investing in assets on the medium-term and long-term portions.
OCIP’s Return Stabilizes: 1993
During 1993, U.S. interest rates stopped their dramatic fall and stabilized. One-year rates and five-year rates hovered around 3.4 and 5.1 percent, respectively (see Figure 5.3). As a result, Citron was deprived of the capital gains he had been earning on OCIP’s fixed-income securities, and his inverse floaters no longer earned increasing returns. Profits fell, as well, because the spread between medium-term rates and short-term rates decreased, causing the net return on Citron’s mountain of reverse repo-financed securities to decline. Figure 5.3 shows that that spread between five-year and one-year Treasury bills yields fell by nearly 1 percent. The combined effect of stabilized interest rates and declining interest-rate spreads caused OCIP’s profits to fall, but they remained relatively healthy—especially compared to other funds. As a result, Citron was still considered, by many, to be a cut above the typical portfolio manager.
OCIP’s Returns Plummet: 1994—Effects of Rising Interest Rates
In the end, Citron’s bet on falling interest rates proved disastrously wrong. U.S. interest rates began to rise in February 1994, when the Federal Reserve tightened credit to reduce the threat of inflation and prevent the U.S. economy from overheating. During the span of ten months, the Fed raised U.S. interest rates six times, causing the yield on one-year U.S. Treasury bills to rise from 3.54% to 7.14 percent—more than double! As a result, OCIP’s heavily packed portfolio of fixed-income securities and inverse floaters began to spill red ink. Fixed-income securities incurred capital losses, and the spread between medium-term and short-term securities was rapidly approaching zero (see Figure 5.3).
The effect of rising interest rates combined with leverage caused returns to plummet. At the end of 1994, interest rates rose from about 3.5 to 7 percent. As a result, securities worth $300 million (i.e., the original $100 million bought with investors’ funds plus the $200 million purchased with borrowed funds) at the beginning of the year were worth $256.95 million at the end of the year—a considerable difference.
At year’s end, OCIP would still have to repay $206 million in principal and interest on the reverse repo agreement; so, as Table 5.8 shows, the effects of these capital losses would turn the safe 3.5 percent return on equity, which OCIP would have earned without leverage, into a loss of 38.55 percent.
Table 5.8: Results of Leveraging Reverse Repos to Enhance Investment Returns: An Example Assuming Rising Interest Yields

OCIP’s profitability plunged in 1994 for another reason. Like so many other finance-related failures (e.g., Barings Bank), Robert Citron began using a doubling strategy. As interest rates rose and bond prices fell, Citron saw in each interest rate up-tick an opportunity to purchase (what he believed were) increasingly underpriced assets. To finance the purchases and profit from his expectations, he borrowed vast amounts, but interest rates continued to rise, causing his doubling strategy to lose even more than had already been lost.132
The dual effect of declining profitability and tumbling asset value attracted the attention of investors and creditors, who began to scrutinize carefully Citron’s risk levels and match them with expected rates of return. The reaction of many to the bad news was to exit from the fund (or, at least, try to exit) as quickly as possible.
The main cause of Orange County’s bankruptcy was the heavy concentration of structured notes and medium-term fixed-income securities in OCIP’s portfolio, the risks of which Citron did not fully understand. Citron made what amounted to an enormous one-sided bet that the U.S. yield curve would remain steeply upward sloping (i.e., short-term interest rates would remain considerably lower than medium-term and long-term rates) and that interest rates, on average, would fall. He lost his bet, on both accounts, because the U.S. yield curve flattened, and interest rates rose in 1994. Rising interest rates led to a domino effect among the major risks facing OCIP. As the market value of fixed-income securities plummeted (market risk), demands by investors for their funds back forced OCIP to liquidate a large portion of its portfolio (liquidity risk), thereby turning paper losses into actual losses (credit risk).
The Consequences
In October 1994, Matthew Raabe, Orange County’s assistant treasurer, went to Orange County’s chief administrator, Ernie Schneider, and to Orange County’s auditor-controller, Steve Lewis, to express his concerns about the losses OCIP was suffering. Raabe explained how OCIP’s portfolio value had withered by more than a half billion dollars. News of the losses shocked Schneider and Lewis. Quick action was called for, and one of the first priorities was getting an accurate external appraisal of OCIP’s portfolio. For that, Orange County hired New York-based Capital Market Risk Advisers (CMRA). The analysis took about a week to complete, and the results were alarming. CMRA’s analysis detailed the decimation of OCIP’s portfolio. By CMRA estimates, the OCIP portfolio had lost approximately $1.5 billion in value.
Market Risk Causes Liquidity Risk
Investors, already spooked by the effects that the Fed’s tight credit policy and rising interest rates were having on earnings and portfolio values, began fearing for the solvency of OCIP. Capital flight resulted, beginning in mid-November 1994, when the Irvine Ranch Water District decided to withdraw $100 million from the OCIP portfolio. Citron and his staff (mainly, Matthew Raabe) spent the rest of the month trying to convince investors not to withdraw their funds and urging creditors not to pull their credit lines.
To stem the capital outflows and prevent a liquidity crisis, Citron tried to freeze the fund for thirty days and applied a 20 percent haircut (i.e., reduction in portfolio value) to investors wishing to withdraw their funds. The policy seemed to be fair. After all, these investors enjoyed the better years when OCIP was earning above-average returns; so, why should they not have to bear the burdens during more difficult times? Even though it is questionable whether Citron’s 20 percent haircut would have survived a serious court challenge, it seemed to work. Investors realized that withdrawing their funds would immediately turn paper losses into actual (cash-flow) losses that would have to be reported to the public.
Conversely, the haircut Citron used to stem the run by OCIP investors could not be used with creditors, and creditors were champing at the bit to get back their funds as soon as possible. As interest payments on Orange County’s outstanding debts came due, most creditors refused to roll over their credits and others demanded back existing loans. Credit Suisse First Boston (CSFB), for instance, which had lent Orange County $2.6 billion in connection with reverse repo agreements, requested the repayment of $1.25 billion.133 Orange County was having difficulties meeting the rising demand for funds, and no one was willing to lend it such amounts. As a result, finding sources of liquidity to meet the investors’ growing demands for cash became of paramount importance.
Attempts to gain the needed funds by selling OCIP’s entire portfolio were unsuccessful, and appeals to the Securities and Exchange Commission (SEC), state treasurer’s office, California attorney general, and Governor Pete Wilson all were ignored. Everywhere Orange County looked, pockets were empty, and the predominantly Democratic legislature in California had relatively little sympathy for the rich, Republican residents of Orange County.
Government Paralysis
The government of Orange County needed to act promptly, but the Brown Act, which was passed in 1953 to protect the community’s right to attend and participate in public meetings, hindered swift action. The act required seventy-two-hour notification for regular meetings, twenty-four-hour notice for special meetings, and one-hour notice for emergency meetings, but financial crises did not qualify as “emergencies.” Criminal penalties were imposed on public officials who did not follow the rules. When news of the financial crisis first broke, Orange County’s Board of Supervisors should have moved quickly, but they were caught on the horns of a dilemma. Due to the Brown Act, they had to provide the public with notification of any meetings, but if meeting announcements were made, they might fuel public fears and exacerbate the outflow of funds from OCIP.
Citron Resigns
When CMRA finished the audit of OCIP, it estimated the OCIP portfolio had lost approximately $1.5 billion. These losses were reported to the press on December 1, and on December 4, Robert Citron resigned as Orange County’s treasurer–tax collector. News of the losses and Citron’s resignation cast a dark shadow over financial markets nationwide, and capital flight from the fund became even more problematic. Municipalities tried to liquidate their deposits; counterparties to reverse repo agreements demanded additional collateral to back their outstanding transactions, or they seized billions of dollars of collateral to sell at market prices; creditors refused to roll over their loans or called them early. State, county, and national bond prices fell (i.e., yields rose) as investors attached higher risk premiums to bond issues. Orange County housing prices fell, and residents braced themselves for the effects of emergency budget cuts, higher fees, and increased taxes.
Lack of Liquidity Leads to Bankruptcy
The run on OCIP was much the same as a depositors’ run on a bank, and in an effort to meet the surging demand for cash, Citron was forced to sell assets that were rapidly declining in value. OCIP was caught in a death spiral. As assets were liquidated, further losses were realized, stimulating even greater capital flight from the fund. With nowhere to turn, insufficient cash on hand, and no white knights in sight, Orange County filed for bankruptcy on December 6, 1994. Its filing cited the need for a “centralized forum within which to resolve any and all competing claims while assuring that nothing related to the problems of the fund interferes with the county’s ability to provide any and all essential services that the residents of Orange County have come to expect from their government.”134
Fire Sale of the OCIP Portfolio
Soon after bankruptcy was declared, Orange County appointed Tom Hayes, former California state treasurer, to reorganize the county’s finances. After receiving permission from the U.S. Bankruptcy Court, Hayes set his sights on selling the portfolio with as little negative market disruption as possible and investing the recovered funds in safe, short-term assets. Hayes hired Salomon Brothers to help, and, within six weeks, OCIP’s assets were sold. Ironically, the sale of OCIP’s assets received support from an unexpected source. In December 1994, the Mexican peso crisis led to the flight of international capital from developing nations to the safety of the U.S. dollar. The increase in the demand for U.S. financial assets raised security prices, adding to Orange County’s earnings.
Monday-Morning Quarterbacking
After the crisis subsided, analysts began to reconsider if the Orange County debacle could truly be classified as a “derivative-related” failure, if a declaration of bankruptcy was really called for, if it was necessary to liquidate OCIP’s portfolio at such a rapid pace, and if there was a way the failure could have been predicted.
Was Orange County Truly a Derivative-Related Failure?
Orange County’s troubles are often referred to as a derivatives disaster. Nevertheless, even though derivative-related securities accounted for a portion of the decline in OCIP’s portfolio value, Orange County’s misfortune appears to be related more to leverage, bad management, and relatively large holdings of fixed-income securities than it was to mistakes from investing in derivative instruments. Table 5.9 shows the composition of OCIP’s portfolio on December 1, 1994, the day it reported a $1.5 billion unrealized loss. OCIP held no forwards, futures, options, or swaps. The decline in its portfolio value was due to three main causes: structured notes ($722.8 million), fixed-income securities ($635.4 million), and reverse repo agreements ($67.1 million). Of these three sources, the losses on fixed-income securities and reverse repos were not derivative-related, but due to the rise in market interest rates and the reduction in spreads. Only if you considered reverse repo agreements to be a form of forward contract could you classify these losses as derivative-related, and even then, they would account for less than 5 percent of the total decline in OCIP’s portfolio value.
Table 5.9: Orange County Investment Pool Portfolio: December 1, 1994 (Millions of Dollars)

Source: Merton H. Miller and David J. Ross, “The Orange County Bankruptcy and Its Aftermath: Some New Evidence,” Journal of Derivatives 4(4) (Summer 1997), 53.
Of the losses on structured notes, inverse floaters were the major culprits, accounting for more than three-quarters of the $722.8 million decline in portfolio value, but were all of these losses truly derivatives related? A floating-rate note (with a bullet repayment) and an interest rate swap that has double the notional principal can replicate an inverse floater. Therefore, rising interest rates caused both the floating-rate portion and the derivative portion of the structured note to change. To calculate the pure derivative-related losses from these structured notes, you would have to separate the value of the derivative from the floating rate note. Such an analysis would reduce the size of the derivative-related losses somewhat below the figures given in Table 5.9. Regardless, the loss of anywhere near $722 million (for all structured notes) is substantial by virtually any comparative measure of derivative-related failure.
Another way to address whether Orange County’s losses were mainly derivative-related is to rely on information provided by Robert Citron prior to the failure. When he was interviewed, in April 1994, Citron revealed that only 20 percent of the OCIP portfolio was invested in derivative-related assets.135 If that figure were accurate and if these derivative positions resulted in losses proportional to their share of the portfolio, then, at most, $328 million of the total $1.64 billion of losses were derivatives-related. Losses of such magnitude would put Orange County into a special class of derivative-related failures, but it also would scale back dramatically the notoriety of the failure and weaken its relationship to derivative instruments.
Was Orange County Really Bankrupt?
The U.S. Bankruptcy Court ruled that Orange County’s declaration of bankruptcy was valid, and the county deserved Chapter 9 protection from creditors wanting immediate repayment, investors trying to cash out their investments, reverse repo counterparties seeking additional collateral to back their loans, and other parties with whom Orange County had a long list of financial obligations.136 Two financial measures that can give insight into the economic health of Orange County when it declared bankruptcy are solvency (i.e., if the county’s assets exceeded its liabilities) and liquidity (i.e., if the county had sufficient cash assets to meet demand).
Was Orange County Insolvent?
After careful analysis, the court decided that Orange County was insolvent. Nevertheless, despite its thorough analysis, lingering doubts remained as to whether this decision was correct. Table 5.9 (column 3) shows that on December 1, 1994, the market value of OCIP’s assets was approximately $6.1 billion greater than the value of its reverse repo agreements, indicating that Orange County seemed far from insolvent. With a positive net value so large, it is hard to understand the basis on which the U.S. Bankruptcy Court made its determination.137
Was Orange County Really Illiquid?
On December 1, 1994, the day its catastrophic losses were reported, OCIP had almost $650 million of cash (i.e., highly liquid assets) at its disposal (see Table 5.9). These funds could not have satisfied all the cash demands for withdrawals, early pension fund redemptions, calls by counterparties for increased collateral, threats from banks to withdraw credit lines, and the payment of operating expenses (e.g., salaries). Therefore, granting Orange County relief from its creditors was probably a reflection of justifiable liquidity needs. Nevertheless, OCIP had plenty of marketable securities it could have sold, along with approximately $32 million in monthly net interest earnings and its normal cash inflows of deposits from mandatory investors. As a result, the liquidity situation at OCIP may have been bad, but it may not have been as bad as it first appeared, which raises questions about the basis on which the U.S. Bankruptcy Court made its determination.138
Was It a Mistake to Liquidate the OCIP Portfolio?
Debate concerning the liquidation of OCIP’s portfolio is moot because, to a large extent, liquidation was not a choice Orange County made on its own. As the county defaulted on its debts, OCIP assets were confiscated by counterparties and sold at market prices. Of the total OCIP portfolio, more than half was liquidated in this manner.
Suppose investors and creditors were (somehow) convinced to wait. Figure 5.4 shows that the OCIP portfolio was liquidated at precisely the worst time possible. Interest rates in December 1994 peaked at just over 7 percent, and, during the next year, they declined by nearly 2 percent. After Orange County declared bankruptcy, OCIP’s entire investment strategy changed. Previously, Citron earned his profits by exploiting the upward-sloping yield curve (i.e., borrowing short term with reverse repo agreements and investing in higher-earning, medium-term assets), betting on declining interest rates, and leveraging the OCIP portfolio. The new strategy was to liquidate all existing positions, invest funds in money market assets, and unlever the OCIP portfolio.
If the administrators of OCIP had waited, slowly reduced the portfolio’s leverage, and taken measured steps to liquidate assets, results would have been remarkably different. By one estimate, if OCIP had pursued this hold-and-slowly-liquidate strategy from December 1, 1994 to March 29, 1996, the portfolio would have recovered approximately $1.8 billion of its value—an increase that would have eliminated all the losses reported on December 1, 1994 and contributed a significant positive return.139
The problem was that no one knew in December 1994 how future interest rates would change. Had they increased, OCIP stood to lose considerably more than it already had, and further losses could have impoverished Orange County’s already cash-strapped municipalities.

Could the Debacle Have Been Predicted?
Even though the future is unknown, reasonable estimates and efforts to moderate risk can still be made. For instance, Value at Risk (VaR) analysis might have been helpful to all the affected parties, by clarifying the risks facing OCIP. Based on OCIP’s December 1994 portfolio, VaR analysis would have shown that OCIP faced a 5 percent chance of losing at least $1.1 billion (in addition to the existing losses) during the coming year.140 The same figures would also have shown that OCIP faced a 5 percent chance of earning at least $1.3 billion.141 At a 5 percent level of confidence, a VaR of $1.1 billion means that once in twenty years there should be losses greater than or equal to $1.1 billion. Ironically, twenty years was about the tenure of Citron as Orange County’s treasurer–tax collector. Even if they had known OCIP’s VaR and internalized its 20-to-1 meaning, it is still uncertain whether Orange County’s Board of Supervisors and Administrative Officer would have meaningfully challenged the risks that Citron was taking.
As it turned out, interest rates fell precipitously during 1995, thereby catapulting OCIP into the upper tail of the distribution, but OCIP administrators had no way of knowing this in December 1994. Faced with an emergency, the possibility of losing significantly more, and only the remote prospect of turning its losses into gains, the administrators decided that the risk of waiting and liquidating the portfolio slowly was too high.
Sentences, Blame, and Reform
For municipal bankruptcies, Orange County was in a class of its own. To put the Orange County bankruptcy into perspective, consider this. From 1937 to 1994 (more than fifty-five years), a total of 362 municipal bankruptcies (i.e., under Chapter 9) in the United States had been filed with total debts amounting to $217 million.142 Most of these bankruptcies involved relatively small municipalities and minor amounts of money; so, Orange County’s colossal $1.64 billion loss was a paradigm-shifting event that set a new standard for municipal failures.
Robert Citron
In large part, Orange County’s bankruptcy was the result of a recklessly large bet by Robert Citron, but it was also caused by incompetence. After the dust settled, it became clear that Citron was an inept manager of the leveraged portfolio he created. Despite twenty-four years of experience, Citron had not acquired the skills or staff needed to price, track, or hedge the speculative positions he took. In effect, Citron ran an out-of-control hedge fund, but up until the end, he believed that it was the world, and not he, that had gone mad. He was convinced that Orange County had suffered only “paper losses” that never would have to be realized.
Court testimony added to the pile of evidence that Citron was unable to manage the OCIP portfolio. Psychologists and Citron’s attorney testified that Citron, the “financial wizard,” had only seventh-grade-level math ability and performed so poorly on tests that he “bordered on brain damaged.”143 Further testimony revealed that he suffered from a form of dementia and often relied on a mail-order astrologer and a psychic for his interest rate forecasts.144 Chillingly, Ernie Schneider, Orange County chief administrator, rationalized Citron’s behavior by saying, “Bob was always very unusual, eccentric, different, but I attributed it to, you know, brilliant psychics. Chess masters are not normal people.”145
On April 27, 1995, after a fifteen-minute arraignment, Citron pleaded guilty to six felony counts and three special enhancements.146 He was led away handcuffed, booked at the county jail, and then released on his own recognizance, with bail set at $25,000. Under state sentencing guidelines, Citron faced a maximum prison stay of fourteen years and a $10 million fine. The minimum penalty was six months in jail. Most of the charges against Citron related to his misallocation of returns, misappropriation of funds, and misleading/false statements. Citron was not charged with embezzlement, conspiracy, collusion, fraud, or trading for personal gain.
In the end, he was sentenced to serve one year in the county jail, pay a $100,000 fine for his financial shenanigans (e.g., siphoning off the interest earnings from investments made by schools, cities, and some small agencies and placing them in the county-run investment account), serve five years of supervised probation, and perform 1,000 hours of community service. Citron ended up serving just nine months in a work-release program, which means the seventy-one-year-old never spent a night in jail. Rather, he worked in the prison during the day but was allowed to go home in the evening. The light sentence was due largely to Citron’s open remorse throughout the trial, his cooperation with investigating authorities, and his deteriorating health.
In the trial, Los Angeles Superior Court Judge J. Stephen Czuleger reprimanded Citron for “gambling with public money” and chastised him for failing in his oath and obligations to the community. To Czuleger, the loss of public funds bothered him less than the damage Citron had done to the credibility of public officials.
Other Players: Matthew Raabe and Merrill Lynch
In his three-page plea, Citron implicated Matthew Raabe, former Orange County assistant treasurer, claiming that Raabe assisted in falsifying OCIP’s annual financial statements and lied about the fund’s financial condition. In 1996 (nineteen months after the bankruptcy), Citron went further and testified that Raabe was responsible for conjuring up the scheme to divert funds from cities and special districts to Orange County’s budget.
On May 5, 1997, Raabe was convicted on five counts of fraud and misappropriation of $88.5 million and sentenced to three years in the state prison. After serving only forty-one days in jail, he was released, and in November 1997, his conviction was overturned on grounds that the former district attorney (Mike Capizzi) should not have prosecuted the case, due to his heavy involvement with the Orange County bankruptcy. In 2001, the California Supreme Court refused to review the overturned conviction. Raabe was free.147
Orange County filed a civil suit against Merrill Lynch, its major broker/dealer, on grounds that it sold improper and illegal securities to Citron and made false statements in its securities sales. Orange County prosecutors even recruited Citron to help develop their case. Merrill Lynch claimed that its conduct with Orange County was proper and professional and accused Orange County of “letting the real culprit off because he’s going to help you go after the deep pockets.”148 In 1998, the case was settled out of court.
Stealth Supervision: Shared Blame
Even though Robert Citron was the chief protagonist in the Orange County bankruptcy, the lack of adequate supervision and control of the risks in OCIP’s portfolio were significant contributing factors. Orange County’s Board of Supervisors, the SEC, credit rating agencies, media, and residents of Orange County were all looking in the wrong direction when the fatal blow was struck.
Many people wondered why the SEC, which met with Citron in 1994 and conducted multiple independent audits throughout 1994, found nothing unusual in the OCIP portfolio. They were also baffled that the two largest U.S. credit rating agencies, Standard and Poor’s and Moody’s Investor Service, gave Orange County’s portfolio, in 1994, their next-to-the-highest ratings (AA and Aa1, respectively). The reason for Orange County’s clean bill of health appears to be, in large part, because at each of the levels of overview, focus was put mainly on Citron’s return and credit risk, rather than on the risks that brought on the Orange County collapse (i.e., market risk and liquidity risk).
Especially disappointing was the oversight role played by Orange County’s Board of Supervisors. During the court proceedings, one Orange County supervisor admitted that his “knowledge of public finance matters was nil prior to the bankruptcy”; he never read any of Citron’s reports and resolutions requesting approval for hundreds of millions of dollars in bond issues, and he rarely asked questions because “I wouldn’t know the kinds of questions to ask.”149 In December 1995, the Orange County grand jury charged Board of Supervisors members Roger Stanton and William Steiner and auditor-controller Steven E. Lewis with willful misconduct, but these charges eventually were dismissed by the courts.
Governance Reforms
Having been burnt once and wanting to ensure it did not happen again, Orange County implemented a series of financial governance reforms. The bankruptcy spurred the establishment of a crisis management team, and the county appointed a chief executive officer and chief financial officer to make serious budget cuts and bring its financial house in order.
A package of state and local reforms was passed that mandated more transparent and timely reporting and oversight. An internal auditor was appointed, reporting directly to the Board of Supervisors. Public officials were required to make open disclosure of possible conflicts of interest. Prohibitions were imposed on oversight committee members from receiving gifts. Austere investment guidelines were introduced, which put top priority on acquiring assets with relatively low risk and high liquidity. Portfolio managers were constrained from leveraging investments (e.g., entering into reverse repo agreements), transacting derivative deals, and purchasing structured notes. The selection of brokers, dealers, and investment advisors also received greater scrutiny.
Lessons Learned from Orange County
There is a lot to be learned from financial catastrophes, and two of the major lessons learned from the Orange County crisis are (1) safety, liquidity, and high yield are an impossible combination; and (2) if you can’t explain it, then don’t do it.
Safety, Liquidity, and High Yield Are an Impossible Combination
One of the most basic relationships in finance is the direct relationship between risk and expected return. In markets where billions are invested, it is difficult to earn returns that consistently beat the market average, and investment funds that do are most likely carrying greater than average risks. For this reason, risk and return should be reported simultaneously to investors for rational choices to be made. To this end, portfolio managers should be required to communicate (and investors should demand) timely, transparent information on the risk and return profiles of their portfolios.
Value at Risk (VaR) analysis could have aided greatly in this effort because it communicates to investors the odds of losing a certain amount (or more) during a given period. So long as the investors understand these risks and are willing to bear their downside consequences, mistakes as well as the grounds for legal suits and crushed expectations are diminished.
If You Can’t Explain It, Then Don’t Do It
As financial instruments become more complex, valuing them and tracking their risks requires financial sophistication that is beyond the abilities and/or time constraints of most investors. Even though investors in OCIP and regulators can be criticized for not demanding better explanations of Robert Citron’s investment strategies, Citron is culpable for his inability to articulate them clearly. As intricate as investment strategies might be, there should always be a way of boiling them down to a short, informative overview. For instance, Citron might have explained his strategy like this:
In the past, OCIP beat the average market return because medium-term interest rates remained above the short-term rates and because interest rates fell. During the coming year, we believe these conditions will continue, and therefore the OCIP portfolio is structured to profit from these two expectations. To capitalize on our outlook, we have leveraged the OCIP portfolio by borrowing about $2 for every $1 you have invested in the pool. More specifically, OCIP now has about $20.5 billion in total assets, of which $13 billion were purchased with borrowed funds, and the rest was financed with your (investor) funds. This (nearly) 3:1 leverage factor increases substantially the amount of risk you are facing.
As far as risks are concerned, OCIP’s assets have virtually no default risk because the portfolio contains only the best creditors (like the U.S. government), but OCIP does face a significant degree of market risk and liquidity risk. Market risk is the potential for OCIP’s portfolio value to fall due to rising interest rates. Liquidity risk is the potential that we will not be able to meet the cash demands of investors, creditors, and/or investment counterparties. By our best estimates, there is a 5% chance that the currently structured portfolio could lose $1.1 billion or more during the next year and an equal chance that it could gain $1.3 billion or more during the same period. Seen another way, as of November 1994, the OCIP portfolio stands to win or lose about $550 million for every 1% change in market interest rates.
Conclusion
Orange County recovered quickly and maintained its position as a thriving community, with high-quality services and a per capita gross community product above the California average. Its credit ratings recovered lost ground, and Orange County’s budget was in the black for the remainder of the twentieth century. Nevertheless, progress came with a huge sacrifice in terms of increased debt levels and the loss of numerous municipal jobs. In the end, it was the combination of a healthy California economy and Orange County’s willingness to make tough decisions that saved the day. Orange County learned a valuable lesson, but the price tag on this lesson was higher than any community would want to pay.
The chances of a financial catastrophe like this happening again are remote because Orange County and the state of California made significant financial reforms, focusing on transparency, overview, and timely reporting. Nevertheless, in any complex structure (e.g., a municipal government or company), there is always the chance of a catastrophe springing from a totally unexpected source. Risk management systems protect against the risks we see, but these systems also add an additional dimension of complexity to an already complex organization. The fear of many is that this increased complexity could, itself, be the source of the next disaster.
Review Questions
- On what grounds can a case be made that the Orange County bankruptcy was not a derivative-related failure? On what grounds can a case be made that it was a derivative-related failure?
- Explain how Robert Citron was able to earn above-average returns when U.S. interest rates fell.
- Explain whether the Board of Supervisors was culpable for Orange County’s bankruptcy. Given a second chance, what should the board have done differently?
- Explain why credit risk alone is not a sufficient measure of a portfolio’s overall risk and loss potential.
- What role did Proposition 13 play in the Orange County failure?
- Explain how reverse repo agreements allowed Robert Citron to leverage the OCIP portfolio. Then explain how this leverage led to mammoth OCIP losses.
- Explain the bet Robert Citron made with Orange County’s funds and how it went bad.
- Explain how Orange County’s market risk led to liquidity risk and credit risk.
- Was it a mistake to liquidate the bulk of OCIP’s portfolio within six weeks of bankruptcy?
- Was Orange County really bankrupt?
Bibliography
Anonymous. “County Official Lists Securities: Derivatives Attracted Criticism.” Wall Street Journal (April 20, 1994), C21.
Anonymous. “OC Finance: Financial Issues, Restructuring.” May 20, 1997. Orange County homepage available at: https://www.ocgov.com/. Accessed on January 20, 2018.
Anonymous. “The 4/95 Plea/Sentencing Agreement of Bob Citron Re: His Criminal Role in the Orange County Bankruptcy.” Lectric Law Library, Available at: http://www.lectlaw.com/files/cur12.htm. Accessed on January 20, 2018.
Baldassare, Mark. When Government Fails: The Orange County Bankruptcy. Berkeley: Public Policy Institute of California and the University of California Press, 1998.
Fleming, Michael J. and Garbade, Kenneth D. “The Repurchase Agreement Refined: GCF Repo.” Current Issues in Economics and Finance. Federal Reserve Bank of New York, 9(6) (June 2003), 1–7. Available at http://www.newyorkfed.org/research/current_issues/ci9-6.pdf. Accessed on January 20, 2018.
Glassman, James K. “From Orange County, Eight Survival Lessons.” The Washington Post. January 1, 1995. H1.
Jorion, Philippe. “Lessons from the Orange County Bankruptcy.” Journal of Derivatives 4(4) (Summer 1997), 61–66.
Jorion, Philippe. “Philippe Jorion’s Internet Case Study: Orange County Case—Using Value at Risk to Control Financial Risk.” Available at: https://www.coursehero.com/file/6825587/Orange-County-Case/. Accessed on January 20, 2018.
Miller, Merton H. and Ross, David J. “The Orange County Bankruptcy and Its Aftermath: Some New Evidence.” Journal of Derivatives 4(4) (Summer 1997), 51–60.
Orange County Press Releases. Various. Orange County homepage. Available at: https://www.ocgov.com/. Accessed on January 20, 2018.