
CHAPTER 8
Case Study #4: 3D Systems (DDD) in 2014
Nobody disputes the phenomenon of the Internet as a truly disruptive technology that has changed the way we do many things, from buying goods and services to keeping tabs on our friends and, in some cases, making new ones. For consumers and investors alike it has served as an obtuse example and demonstration of what is meant by the term disruptive technology. When a hitherto obscure industry like three-dimensional (3-D) printing suddenly saunters into investors’ fields of vision and collective consciousness as a “disruptive technology,” magic happens, as the weekly chart of 3-D printing leader 3D Systems (DDD) in Figure 8.1 shows. DDD actually came public at the end of March 1988, just a few months after Black Monday and the October 1987 Market Crash. The stock had one quick, three-month, 142 percent upside move from an IPO base in the latter half of 1989 and then sank back into obscurity for the next two decades, at one point reaching a low of 50 cents a share in 1992.
In 2012 that all changed, as 3-D printing suddenly came of age as a disruptive technology, spawning big price moves in other names that made up what became known as the 3-D printing group. In addition to DDD, this group included names like fellow “old-timer” Stratasys (SSYS), which had come public in 1994, and newer entrants like Proto Labs (PRLB), Exone Company (XONE), and Voxeljet (VJET). PRLB had come public in February 2012, XONE in February 2013, and Voxeljet (VJET) at the height of the 3-D printing investment craze in October 2013. All of these stocks were hot tickets in 2012–2013, as the 3-D investment craze ignited a huge group move. But as with similar group moves from the past such as, for example, the solar stocks in 2007, the 3-D printing stocks eventually topped in 2014 and became prime short-sale targets. We've already discussed SSYS and XONE in previous chapters as examples of short-sale set-ups, and so it is only fitting that we include DDD as our fourth case study.
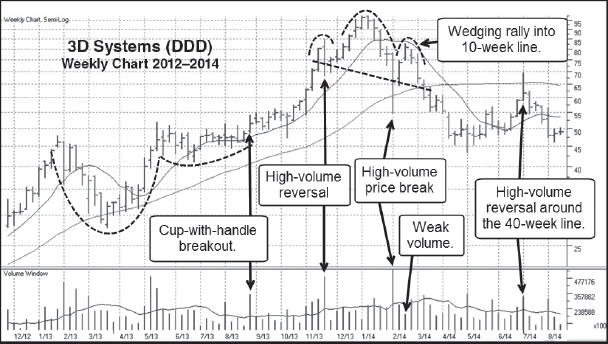
FIGURE 8.1 3D Systems (DDD) weekly chart, 2012–2014. One of the hottest 3-D printing stocks finally tops in a clearly defined H&S formation.
Source: Chart courtesy of HGSI Investment Software, LLC (www.highgrowthstock.com), ©2014.
DDD's final upside leg in its big 2012–2014 price run came after a breakout from a rather large, −41.9 percent deep cup-with-handle base in late August 2013. As we can see in Figure 8.1, this was not the type of breakout that sent the stock immediately charging to the upside. After clearing to new highs in late August, it moved sideways and shook out below its 10-week moving average in early October before embarking on a sharp 5-week move to the upside. This move ran into a high-volume reversal that formed what later became the left shoulder of the head and shoulders (H&S) top DDD formed between November 2013 and March 2014.
A high-volume price break finishes off the right side of the head in the formation, and this coincides with a test of the 40-week moving average, corresponding to the 200-day moving average on a daily chart. From there the stock rallied back up to the 10-week moving average as volume dried up right at the line to form the peak of a right shoulder. DDD then rolled over and headed back down towards the 40-week moving average and eventually through the neckline of a fully-formed H&S top. DDD then found support along the lows of the handle area from which it broke out in late August 2013 and worked its way back above the 10-week moving average before staging a sharp 3-week move into the 40-week moving average that reversed on very heavy volume.
Based on a cursory observation of the weekly chart, we can surmise that the break off the absolute peak that forms the right side of the head and the breakdown from the peak of the right shoulder and through the neckline represented the “fat” parts of the stock's breakdown from a short-selling perspective.
Figure 8.2 shows a comparison chart of DDD versus the NASDAQ Composite Index during the relevant 2013–2014 period and gives us a macro-view of how DDD's top played out relative to what was going on in the general market. Here we can see that DDD formed most of its H&S pattern while the NASDAQ was in an uptrend. The peak of the head in early January 2014 occurred a couple of weeks before the NASDAQ went into a short-term correction. As the NASDAQ bottomed and turned higher in late January DDD continued lower into the end of the month before rallying with the market. However, as the NASDAQ continued into new high price ground in early February, DDD was rallying just enough to form the peak of a right shoulder. That right shoulder peak occurred about two weeks before the NASDAQ topped and went into a more severe short-term correction in March and April. Thus, while DDD's price movement was not precisely correlated to the NASDAQ's at that time, key points in its pattern, such as the peak of the head and the peak of the right shoulder and the ensuing breakdowns from those peaks, roughly corresponded to short-term peaks and subsequent corrections in the NASDAQ in late January and early March.
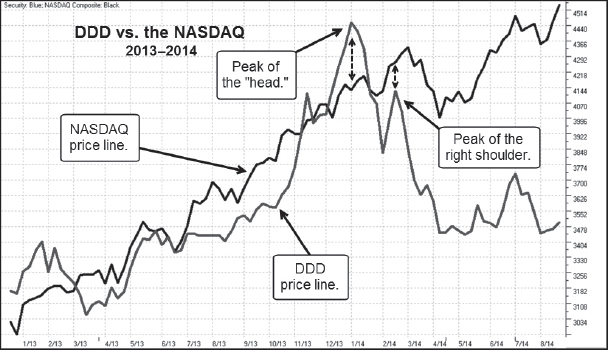
FIGURE 8.2 Comparison chart of 3D Systems (DDD) versus the NASDAQ Composite Index, 2012–2014.
Source: Chart courtesy of HGSI Investment Software, LLC (www.highgrowthstock.com), ©2014.

FIGURE 8.3 3D Systems (DDD) daily chart, 2013–2014. A detailed “anatomical” view of the overall H&S formation.
Source: Chart courtesy of HGSI Investment Software, LLC (www.highgrowthstock.com), ©2014.
Now let's break down DDD's top and price decline during 2014 into its smaller components on the daily chart. Figure 8.3 gives us a granular view of the entire H&S that DDD formed between November 2013 and March 2014. Notice that the head of this large H&S formation also contained a miniature fractal H&S within its upper half. We can even draw a short neckline to this fractal, and the stock breaks out to the downside of this neckline in the latter part of January 2014 as the NASDAQ is engaging in a short, shallow correction. This is also a late-stage breakout failure as the stock drops through the breakout point of a short cup base it formed from mid-November to roughly mid-December 2013.
A three-day voodoo rally followed from there before the stock came completely apart and gapped down to its 200-day moving average. At that point the stock was so oversold that it rallied sharply all the way back up to the 50-day moving average, where it stalled on light volume and declined all the way back to the 200-day moving average. In a nutshell, this sums up the action as it played out within the overall H&S formation itself. Figure 8.4 details the first short point that occurred after the stock broke through the neckline of the smaller fractal H&S pattern at around the 84 price level, as highlighted in gray on the chart. Notice that as the stock dropped below the miniature H&S neckline, it undercut some lows on the left side of the pattern just before the late-stage base breakout and then staged a little undercut and rally sort of move that carried up toward the 50-day moving average. The stock found resistance just below the 50-day line and the series of lows preceding the late-stage base breakout. We can see how despite the fact that the weekly chart in Figure 8.1 shows five straight down weeks that take the stock into its 200-day/40-week moving average, the action on the daily chart is far more subtle. And while it is impossible to determine it using the weekly chart, I consider this wedging rally into the 80 price level to be the first short-sale entry point in the pattern. While one might have waited to see if the stock could rally up to the 50-day line closer to the 83–84 price level, the giveaway here was the extreme voodoo or volume dry-up (VDU) action on the third day of the rally.
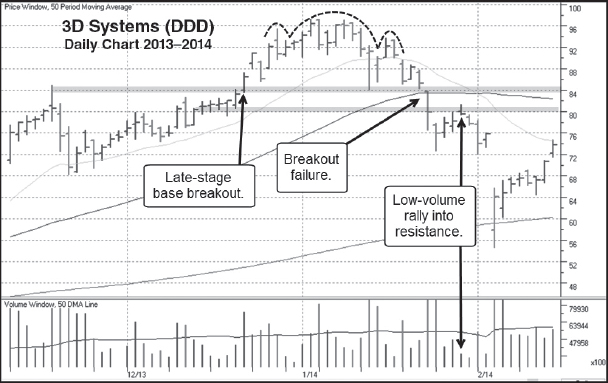
FIGURE 8.4 3D Systems (DDD) weekly chart, 2013–2014.
Source: Chart courtesy of HGSI Investment Software, LLC (www.highgrowthstock.com), ©2014.
In the old How to Make Money Selling Stocks Short by William J. O'Neil with Gil Morales, published in 2004, we referred to the three-day rule, whereby a breakdown in a stock that was followed by a three-day rally back to the upside could be shorted on the third day or later. While this works a good deal of the time, it is not something written in stone, since there can be four- or five-day rallies that also fail in a similar manner. Here we see that the stock goes up exactly three days before it breaks back to the downside, and while the stock doesn't make it all the way to the 50-day line, it does get up into resistance along the lows preceding the late-stage base breakout which I've highlighted in gray in Figure 8.4.
The ensuing gap-down to the 200-day moving average occurred on a bad earnings report and did not represent a shortable gap-down move of any kind. There are a couple of good reasons why, and they are better seen on a wider view of the action on the daily chart shown in Figure 8.5. The first factor is that the stock has come all the way down to a prior base and logical area of support that it formed back in September through October 2013. Putting this together with the fact that we can easily discern three downside selling waves or down legs on the daily chart in Figure 8.4 tells us that DDD was likely “sold out” at this point and ready for a decent rally. As well, we could also see that the pattern had now completed a left shoulder and a head, and it was logical to assume that it would try to form at least some sort of right shoulder as it eventually completed a fully-formed H&S pattern. There were enough “clues at the scene of the crime” at this point to determine that the stock was no longer shortable and needed more time to further develop its topping pattern, if in fact that was what it was going to do.

FIGURE 8.5 3D Systems (DDD) daily chart, 2013–2014.
Source: Chart courtesy of HGSI Investment Software, LLC (www.highgrowthstock.com), ©2014.
DDD rallied sharply off of the early February 2014 lows and the 200-day moving average, and this set up the second optimal short-sale point in the pattern. In fact, we might consider this the “Mother of all Short-Sale Points” given how perfectly textbook it was. This was a very steep move that carries all the way back up to the 50-day moving average, where it ran smack into resistance right at the line, which coincided with the prior late-stage failed breakout way on the left side of the chart. In addition, this is where the first short-sale point, discussed in Figure 8.4 and labeled SP in Figure 8.6, occurred, adding another clue that this was a strong potential area of upside resistance. That certainly turned out to be the case as the stock stalled on the second day of a two-day weak-volume rally at that point and began to roll over to the downside.
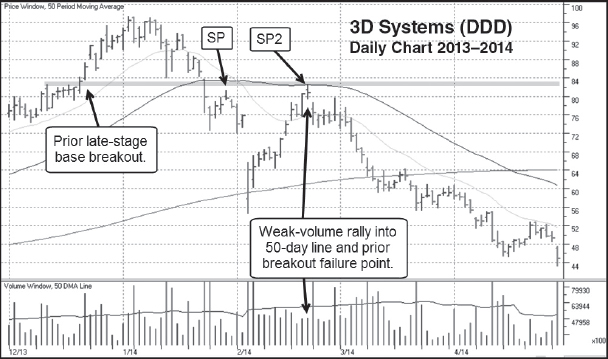
FIGURE 8.6 3D Systems (DDD) weekly chart, 2012–2014. The peak of the right shoulder forms and present the “Mother of all Short-Sale Points.”
Source: Chart courtesy of HGSI Investment Software, LLC (www.highgrowthstock.com), ©2014.
The day after running into resistance right at the 50-day line at SP2, the stock moved sideways and continued to stall on any attempts to retest the 50-day line on the upside. This capped off the peak of the right shoulder in the overall H&S pattern. The stock then completed a fully-formed H&S by dropping all the way back to the 200-day moving average.
Once DDD was back below its 200-day moving average, it found support along the prior early February low, as I've highlighted in gray in Figure 8.7. This led to a short bounce back up into the 200-day line, where the stock stalled and churned right at the moving average on very weak “voodoo” volume. This is the third short-sale point in the pattern, labeled SP3 in Figure 8.7. The stock had a quick three-day break from there and then rallied back up into the prior early February low and the low it formed when it first dropped below the 200-day line in the earlier part of March, as is highlighted in gray on the chart. This highlighted area also roughly coincides with the neckline of the head-and-shoulders pattern as it is drawn in Figure 8.1, DDD's weekly chart. Thus you have several areas of potential resistance working against the stock. This then led to a final move to lower lows before the stock began tracking sideways just below its 20-day moving average.
Notice how once the stock reaches the peak of the right shoulder and the 50-day moving average at point SP2, it began to track just below the 20-day line and remained below this shorter-duration moving average all the way down. It stayed under the 20-day line throughout most of April, as the stock had a final gap-down move that undercut the mid-April low before rallying back up into the 20-day line in early May. It tracked along just below the moving average throughout most of May before poking its head back above the line. At this point, one can get the sense that the overall top in the stock is starting to “max out.”

FIGURE 8.7 3D Systems (DDD) weekly chart, 2012–2014. The third short-sale entry point occurs on a rally back up into the 200-day moving average in mid-March.
Source: Chart courtesy of HGSI Investment Software, LLC (www.highgrowthstock.com), ©2014.
We have previously discussed how stocks will tend to follow the 20-day moving average on the downside as they are down-trending in coherent fashion. Once that behavior ends and the stock pokes back above the 20-day line, short-sellers should be standing clear. Figure 8.8 shows how DDD was able to clamber back above the 20-day line and make a move back above the 50-day moving average as well. Note the high-volume gap-down move at the end of May, but this does not develop into anything more serious. Certainly, had one tried to short this break back below the 50-day moving average, this was a viable short-sale entry point attempt, but one would have soon been stopped out as the stock cleared the 50-day line in mid-June.
There was one final short-sale point at the very beginning of July 2014 that occurred on news of a possible buyout of the company by International Business Machine (IBM). This sent the stock scurrying past the 200-day moving average, but as the buyout rumors faded, so did the stock, and it simply stalled out at the 200-day line on heavy volume. This did offer a reasonable short-sale point at the time, using the 200-day moving average as a guide for an upside stop once the stock closed below the line and in the lower half of that big, churning price range.
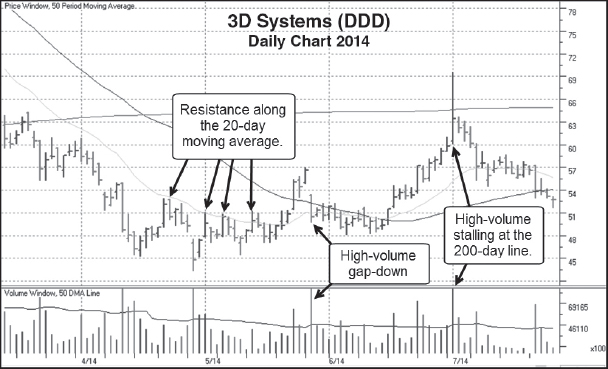
FIGURE 8.8 3D Systems (DDD) daily chart 2014. Once the stock stopped tracking below the 20-day moving average, the move was more or less played out in the short term.
Source: Chart courtesy of HGSI Investment Software, LLC (www.highgrowthstock.com), ©2014.

FIGURE 8.9 3D Systems (DDD) weekly chart, 2013–2014. DDD was a “textbook” H&S formation that was in fact playable using nothing but the weekly chart to guide one's short-sale decision-making process.
Source: Chart courtesy of HGSI Investment Software, LLC (www.highgrowthstock.com), ©2014.
The interesting characteristic of DDD's top is that it was one of those situations where one could have played this on the short side using nothing but the weekly chart, given how “textbook” the H&S pattern played out. In Figure 8.9, a weekly chart of DDD's overall topping phase, we can see the low-volume rally into the peak of the right shoulder in the middle of February 2014. As the stock rolled over, it broke down through the neckline of the pattern and the 40-week moving average, corresponding to the 200-day moving average on the daily charts. DDD kept dropping until it finally undercut some key lows in a base consolidation it had formed from May to August of 2013, as highlighted on the chart. From there we can see the steady rally back up through the 10-week (50-day on the daily) moving average that ended with a big churning and stalling week right at the 40-week (200-day) moving average.
 Summary
3D Systems (DDD), in context with the examples of its group cousins, Exone Company (XONE) and Stratasys (SSYS) discussed in other chapters of this book, offers an instructive example of a dynamic group move based on a compelling investment theme or craze—in this case the “disruptive technology” of 3-D printing. And while such investment crazes can offer fantastic upside profit potential, eventually everyone who has piled into the stocks on the basis of the hype and substance of the 3-D printing investment theme starts to pile out. Short-sellers should be on the lookout for these types of “hot” group moves, as the excitement drives everyone into the stock and then sets up excellent short-sale opportunities once everyone who is going to buy the stocks has done so. The next time you see a major investment theme, whatever it is, take hold of investors’ imaginations and investment dollars and understand that the “hotness” of the upside move is what creates the foundation for a subsequent meltdown that, in almost all cases, inevitably occurs.