
Estimating Efficiency
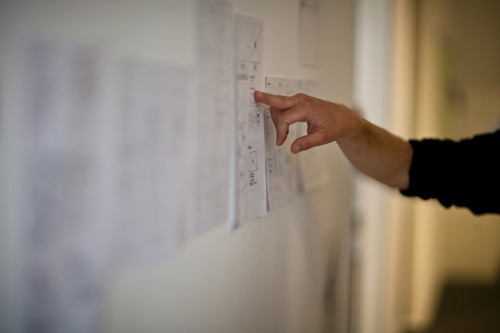
We begin designing by sketching out ideas. But it’s hard to judge how an interface will feel by looking at screen layouts. This chapter shows you how to estimate how efficient different designs are, even before you prototype them.
Overcoming Familiarity Bias
Not long ago, a client asked me to redesign a form that would validate a customer’s address. In the UK the normal way to do this is to enter your postcode and then pick out your house from the resulting shortlist. It’s familiar but clunky. We had another option—a new service that let you start typing your address and then autocompleted it by matching it with a validated address. It was hard for anyone to tell which was the more efficient method.
People tend to fall back on their bias to regard what’s familiar as more efficient than what’s new. It’s a problem for many design teams. The postcode lookup pattern was standard and, therefore, felt more natural. But autocomplete is familiar to most web users so the alternative didn’t have a learning curve. One required more mouse clicks, the other more typing. No one was sure which was better.
We couldn’t simply run a user test: we’d have needed to test hundreds of people to get a statistically valid answer. Trying both solutions on the live site would have taken weeks of effort. The normal reaction would be to get everyone in a room and argue about it for hours, at the end of which the decision would have gone to the loudest person in the room. Instead we picked up an old tool: KLM GOMS.
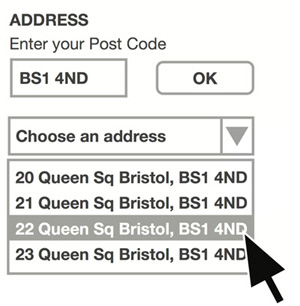
This kind of postcode lookup form is familiar to the target audience in the UK.
GOMS (Goals, Operators, Methods, Selection rules) is a family of techniques for breaking down an interaction into steps. One member of that family is KLM (Keystroke-Level Model), which breaks down interactions at the level of keystrokes and mouse clicks. The idea is to add up all the clicks, hand movements, and thinking time required to complete the task and use that to estimate how long the task will take.
The process of walking through the interactions, adding up the times, plus checking and correcting our work took about an hour but yielded a clear winner. The postcode lookup would take about 17.5 seconds and the autocomplete approach was about four seconds faster. Contradictory to our initial bias, autocomplete was significantly more efficient.
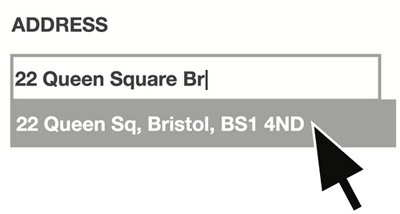
This autocomplete form looks simple, but is it really more efficient?
An Introduction to KLM GOMS
In KLM GOMS the idea is to model a user‘s interaction with a computer by listing the sequence of button presses and hand movements that are make. It also includes time for the user to think and for the computer to respond. You can break down any interaction into the following steps:
• Keying (K) means clicking on a keyboard, a button, or a mouse. For an average typist this is 0.2 seconds.
• Homing (H) means moving your hand from one input device (like a keyboard) to another (like a mouse or a touch pad), about 0.4 seconds.
• Pointing (P) means moving the mouse cursor to a target on the screen. Pointing typically takes 1.1 seconds.
• Mental preparation (M) means thinking about what to do next—for instance choosing an item from a menu, thinking about what to type in the first line of an address, or deciding to click OK. This averages at 1.35 seconds.
• Response time (R) is the time it takes for the system to respond to an input. This varies but if in doubt, you can use values based on the rules of thumb earlier in this book.
First, walk through the interaction step-by-step at the level of each keystroke, click, or gesture and list everything that the user does. If the user types the word eggs, then the steps are: move the hand to the keyboard and type four keystrokes (HKKKK). If the user points with the mouse and clicks on a button, then the steps are these: move hand to the mouse, point, click (HPK). If the system needs time to respond, for instance by loading a web page, then include an estimate for that time (R).
Next, include the thinking time required for each step. Do this by putting mental preparation steps (M) in front of all keying (K) and pointing (P) steps. You’ll end up with too many Ms, so the final step is to delete the unnecessary ones.
For short lines of text, most people don’t have to think about each letter they type. When you type eggs, you don’t pause to think about each letter. So delete all the Ms that appear between Ks (MKMK becomes MKK). Also you don’t point–think–click, you just point and click. So delete Ms that appear between Ps and Ks (PMK becomes PK).
Now walk through the interaction again to check your work. It’s a good idea to get someone to check your work by comparing their own calculation with yours. Often you’ll discover you’ve forgotten steps. (It’s easy to forget that users need to move their hands from the keyboard to the mouse or back.) You also need to make sure you’ve been consistent in applying the rules. When you’re done, add up the total time taken (using the values above), and you’ve got the time required to complete the task.
For a simple interaction, like selecting an item from a drop-down menu of familiar choices, the interaction is still quite involved:
Step 1:
M Determine what to do.
H Place hand on mouse.
P Move the pointer to the menu.
Step 2:
K Click on the menu.
M Review choices.
Step 3:
P Point at correct choice.
Step 4:
K Click on mouse.
That adds up to MHPKMPK = 5.9 seconds for an experienced user making no errors. What the Keystroke-Level Model teaches you is that unless you’re careful in your design choices, even simple tasks can take users a long time.
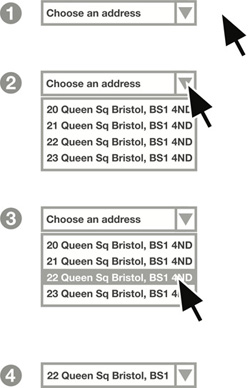
Selecting an item from a drop-down list takes longer than you think.
Handle with Care
Analyzing interactions with KLM GOMS is a painstaking process. Calculating the efficiency of an entire website would take days or weeks to complete. So only use KLM GOMS for the kinds of tricky side-by-side comparisons that demand careful modeling.
The times in KLM GOMS are averages. Some mental preparation takes longer than 1.35 seconds, some is shorter. Sometimes pointing at an item on screen is quicker, sometimes longer. What that means is there’s a 10–20 percent margin of error on KLM GOMS estimates, but to put that in perspective, you’d need to run a user test with about 80 people to get a similar level of error. Nevertheless, don’t assume that because one interface is a few fractions of a second faster than another that it will be quicker to use in real life.
KLM GOMS assumes you’re dealing with an experienced user. Novices will always take longer because they’ll have to learn how to use the system. We’ve seen that what’s efficient for a novice and what’s efficient for an experienced user are not always the same—so you’ll still have tradeoffs to make.
It also assumes the user makes no errors. You always model the ideal journey. So if you want to learn about the effectiveness of an interface, you still have to run a user test. You will find some clues to effectiveness in your KLM GOMS figures though. Every one of those mental preparation (M) steps is an opportunity for user error. So watch out for interfaces with large numbers of Ms or dense clusters of Ms.
However, it does force you to think about the impact of small design decisions. For instance, it takes an experienced user about 1.3 seconds longer to choose an item from a drop down menu than it does from a list of buttons on screen (because there’s an extra point and click involved in opening the menu). Over the course of an entire form, those time savings add up.
Of all the things to remember when conducting this kind of analysis, the most important is that KLM GOMS only tells you about task efficiency. But effectiveness should always be your number one goal—if you have to choose between an effective interaction and one that’s merely efficient, always choose the effective one.
KLM GOMS and Mobile Phones
KLM GOMS was designed for desktop computers with a keyboard and a mouse, not touchscreen mobile phones or tablets. There are some obvious differences such as no mouse. There isn’t yet a definitive set of values for analyzing interactions for a mobile phone though there are researchers looking into this. Until that work is published, here are some suggestions:
• Typing on a touchscreen is slower than typing on a computer keyboard. So instead of the Keying (K) value for an average typist (0.2 seconds) use a higher value (0.45 seconds—about 25 words per minute).
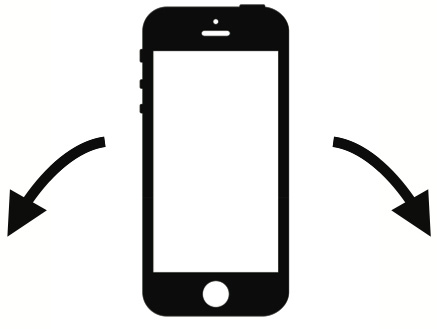
• For turning the mobile phone from landscape to portrait in two hands, some researchers have used the 0.4 seconds value (the same as homing the hand from mouse to keyboard).
• Sometimes when you turn the mobile phone, the screen reorients, too (for instance, when you’re reading emails). I suggest a target time of 1 second to reorient the screen.
• On touchscreens you don’t point and click (PK) you just point (P).
• Keying in special characters, like a dollar sign, often requires the user to first hit an on-screen button to change the keyboard layout—it’s more than one keystroke.
• Network speed can vary considerably on mobile phones and significantly impact response time. You can’t include it in a calculation but should discuss it as a design consideration.

Keying K=0.45s
Turning H=0.4s

Pointing P=1.1s

Mentally preparing M=1.35s

Response time R=?
Estimated GOMS values for a touchscreen phone.