
Chapter 2
Comparing Metrics from Different Marketing Techniques
IN THIS CHAPTER
Understanding key performance indicators
Examining metrics among social media
Assimilating social media metrics with web metrics
Analyzing social media with advertising metrics
Juxtaposing social media with other online marketing
Contrasting online with offline metrics
By now, you may be asking yourself whether web metrics (the science of measurement) are worth the trouble. They certainly matter if you have a business with a finite amount of time, money, or staff — which covers just about every business.
Metrics aren’t about determining whether your company is the best in any particular marketing or advertising channel. They’re about deciding which channels offer your company the best value for achieving your business objectives. Not to denigrate your instinct, but metrics are simply the most objective way to optimize your marketing effort. This chapter explains what you need to know about using metrics in marketing your small business.
 Marketing isn’t rocket science. If your metrics show that a particular tactic is working, keep doing it. If they show it isn’t working, try something else.
Establishing Key Performance Indicators
The most important items to measure — the ones that reflect your business goals and objectives — are key performance indicators (KPIs). They may vary by type of business, but after they’re established, they should remain consistent over time.
An e-retailer, for instance, may be more interested in sales by product category or at different price points, though a business-to-business (B2B) service company might want to look at which sources produce the most qualified prospects. The trick is to select five to ten relevant metrics for your business.
If something isn’t measured, it can’t be evaluated. If it can’t be evaluated, it isn’t considered important.
While you read this chapter, you can establish your own KPIs. Then you can combine them with other information about how your various marketing efforts contribute to sales and leads, to your bottom line, and to your return on investment (ROI). Armed with this information, you’ll be in a position to make strategic business decisions about your marketing mix, no matter what size your company.
 Enter at least one KPI for each business goal on your Social Media Marketing Plan (see Book 2, Chapter 2). Some business goals share the same KPI. Schedule a review of the comparative metrics on your Social Media Activity Calendar (discussed in Book 2, Chapter 4) at least once per month — or more often if you’re starting a new endeavor; you’re running a brief, time-constrained effort; or you handle a large volume of traffic.
Overcoming measurement challenges
Measuring success among forms of social media, let alone between social media and any other forms of marketing, is a challenge. You’re likely to find yourself comparing apples not only to oranges but to mangoes, pineapples, kiwis, pears, and bananas too. In the end, you have to settle for a fruit salad or smoothie.
Install the same statistical software, whether it’s Google Analytics or another package, on all your sites. Your sites may not have identical goals (for instance, users may not be able to purchase from your LinkedIn profile or request a quote from your wiki), but using the same software will ensure that metrics are consistently defined. In fact, the availability of compatible analytics packages may influence your selection of a host, development platform, or even web developer.
Using A/B testing
You may want to apply A/B testing (comparing a control sample against other samples in which only one element has changed) to your forays into social media. Just as you might use A/B testing to evaluate landing pages or emails, you can also compare results between two versions of a blog post or compare performance of two different headlines for an update on a social media service, while keeping all other content identical.
If you’re comparing performance (click-throughs to your site) of content placed in different locations — for example, on several different social bookmarking sites or social news services — use identical content for greater accuracy.
Don’t rely on absolute measurements from any online source. Take marketing metrics with a shaker full of salt; look more at the trends than at the exact numbers. Be forewarned, though, that the temptation to treat numbers as sacrosanct is hard to resist.
To no one’s surprise, an entire business has grown up around web metrics. If you have a statistical bent, join or follow the discussions on the resource sites listed in Table 2-1.
Table 2-1 Online Metrics Resources
Site Name |
URL |
What It Offers |
eMetrics |
Events and conferences on marketing optimization |
|
HubSpot |
A/B testing how-to FAQs article |
|
Digital Analytics Association |
Professional association for analytics practitioners |
|
Web Analytics Demystified Blog |
Digital measurement techniques |
|
WebProNews |
Breaking news blog for web professionals, including analytics topics |
|
Webtrends |
Resources for analytics and other marketing topics |
Comparing Metrics across Social Media
Each genre of social media services has its own arcane measurements, from hashtags to comments, from posts to ratings, from membership numbers to sentiment.
Use medium-specific metrics to gauge the efficacy of different campaigns within that medium or to compare results from one site within a genre to another.
However, to assess the overall effectiveness of social media efforts and your total marketing mix, common metrics cross boundaries. Surprise! These common metrics look a lot like the statistics discussed in Book 6, Chapter 1. By using the right tools, or by downloading analytics to a spreadsheet and creating your own graphs, you can compare data for various social media.
Online traffic patterns may vary for all sorts of reasons and for different businesses. Watch for cyclical patterns across a week or compare the same time frames a year apart. Merchants often do this for same-store sales to compare how a store is performing compared to past years.
Carefully aggregate measurements over exactly the same time frame and dates. You obviously don’t compare weekly data from a blog to monthly data for a website. But neither should you compare Tuesday traffic on one source to Saturday traffic on another, or compare November and December clicks for an e-commerce site that sells gift items (which is probably quite high) to January and February clicks (which are probably low). Compare, instead, to the same time frames from the preceding year.
These sections take a closer look at social media and what you need to know when studying metrics across your different social media sites.
Recognizing the important metrics
In most cases, these metrics become some of the KPIs on your list:
- Traffic (visits): The overall measure of the number of visits (not visitors) made to your site or to a particular social media presence over a set period. Facebook (see Figure 2-1) offers page administrators traffic data in its free analytics at
www.facebook.com/insights(you must be logged in). Google Social Analytics enables you to compare traffic from different social media sources, as discussed in Book 6, Chapter 1. - Unique users: The number of different users (or, more specifically, IP addresses) who visited. Depending on your business model, you may want to know whether you have ten visits apiece from 100 ardent fans (multiple repeat users) or 1,000 users, each of whom drops in once. This type of detail is available for some, but not all, social media services.
- Keywords: The list of search terms or tags used to find a particular web posting. Phrases are often more useful than individual words.
Referrers: A list of traffic sources that tells you how many visitors arrive at your web entities from such sources as search engines, other websites, paid searches, and many, but not all, other social media services. Some even identify referrers from web-enabled cellphones.
You can find a section like this in most analytics programs. Those traffic sources may be aggregated and displayed graphically for easy review, as shown in Shoutlet’s Social Analytics feature (see Figure 2-2). This feature compares the performance of social posts across networks for a holistic view of campaign metrics.
Keeping track of users’ paths among many components of a complicated web presence isn’t easy, but it’s worth it. You may find that your marketing strategy takes B2B prospects from LinkedIn to your blog and then to a microsite. Or you may watch business-to-consumer (B2C) clients follow your offers from a social news service to a store widget on Facebook before they conclude with a purchase on your site. Refer to the next section for more about tracking your links.
- Click-through rate (CTR): The number of click-throughs to your site from a particular source divided by the number of visitors (traffic) that arrived at that source. If 40 people view your Facebook stream in one day, for instance, and 4 of them click-through to your primary site, the CTR is 10 percent (4 ÷ 40). You may need to derive this data by combining traffic measurements from particular social media services with information from the Referrers or Entry Pages sections of your analytics program. In some cases, the CTR becomes the conversion measure for a particular social media service.
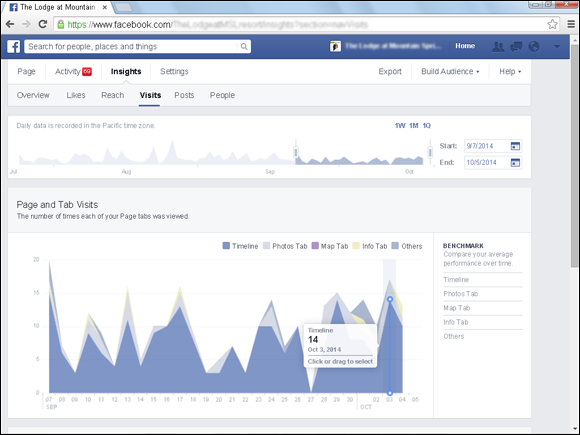
Source: www.facebook.com
FIGURE 2-1: Facebook’s Insights analytics tool displays Facebook traffic over a customized report time frame.
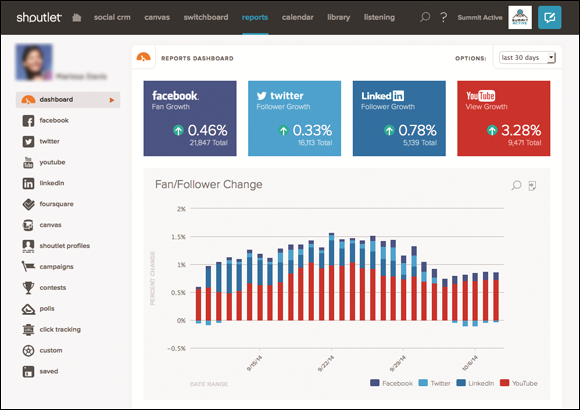
Reproduced with permission of Shoutlet, Inc.
FIGURE 2-2: The Shoutlet analytics report provides the total number of referrals by source in the top boxes and a graph depicting the relative growth of traffic by source at the bottom.
Table 2-2 suggests some useful KPIs that can track by genre and social media platform.
Table 2-2 Social Media by Genre and KPI
Social Genre |
Site Examples |
Useful KPIs to Check |
Bookmarking |
Delicious, StumbleUpon |
traffic, keywords, CTR |
Community |
Forums, Ning, Google Groups, Yahoo! Groups |
traffic, users, time, keywords, CTR |
Information |
Blogs, webinars, wikis |
traffic, users, time, keywords, referrers, CTR |
Media sharing |
Podcasts, YouTube, Pinterest, Instagram |
traffic, users, time, keywords, CTR, number of views, Likes, Followers |
Network |
Facebook, LinkedIn, Google+, Twitter |
traffic, users, time, keywords, CTR |
News |
Digg, Reddit |
traffic, keywords, CTR |
Review |
Angie’s List, Epinions, TripAdvisor, Yelp |
traffic, CTR, user ratings, leads |
Tagging links
Tagging your links with identifying code is especially helpful for tracking clicks that arrive from e-newsletters, email, widgets, banner ads, and links from a mobile phone because they otherwise aren’t distinguishable in the referrer list.
 Tagging links offers one other advantage: the ability to track the impact of dark social media traffic. Dark traffic arrives at your site via an intermediate stop on some site other than the social media page on which you posted your original link. (For instance, someone shares the link you placed on Facebook with one of their friends via email or text message.) Unless you tag your links, Google can’t identify traffic from these sources, so it gets reported as direct traffic.
An unidentified referrer is usually displayed on a row with only a / (slash) in its name. This unspecified / category includes people who type your URL on the address bar of their browsers because they remembered it, were told about it, or have bookmarked your site.
Tagging links manually
If you have only a few such unspecified sources, simply tag the inbound link with additional, identifying information. Add ?src= and the landing page URL. Follow that, in any order, with the source (where the link appeared, such as MerchantCircle), the medium (pay-per-click, banner, email, and so forth), and campaign name (date, slogan, promo code, product name, and so on). Separate each variable with an ampersand (&). The tagged link will look something like www.yoursite.com/landingpage?src=yahoo&banner&july14.
Google AdWords does this tracking for you automatically. Be sure that you have linked your Analytics and AdWords accounts together and enable auto-tagging. You can still use either the manual method described in this section or the Google tag builder described in the following section for all non–AdWords campaigns.
Using Google’s URL builder to tag links
Google’s automated tool for creating tagged links can be used for any advertising campaign or medium, not just Google AdWords. Follow these steps:
- Go to
https://support.google.com/analytics/answer/1033867. - Enter your website’s address in the Website URL text box.
- In the Campaign Source text box, enter the referrer, such as Facebook, newsletter, Google Ads, and so on.
Enter the type of ad in the Campaign Medium text box.
For example, the ad type may be promoted post, banner, retargeting, or print.
- (Optional) Enter keywords or target audience demographics in the Campaign Term text box.
(Optional) Include text from the body or headline of each ad in the Campaign Content text box to differentiate ads.
This step is often helpful for A/B testing when you’re trying to decide which headline or offer works better in an ad.
- In the Campaign Name text box, enter an easily identifiable product name, slogan, promo code, holiday, or theme.
Click the Submit button.
Your custom URL, which appears below the button, looks something like
www.watermelonweb.com/?utm_campaign=holidayparties2014&utm_medium=banner&utm_source=chambernewsletter.
As far as the user is concerned, the link automatically redirects to the correct landing page. However, you can count each distinctive URL in a list of referrers or, in the case of Google Analytics, by choosing Acquisition > Campaigns, as shown in Figure 2-3.
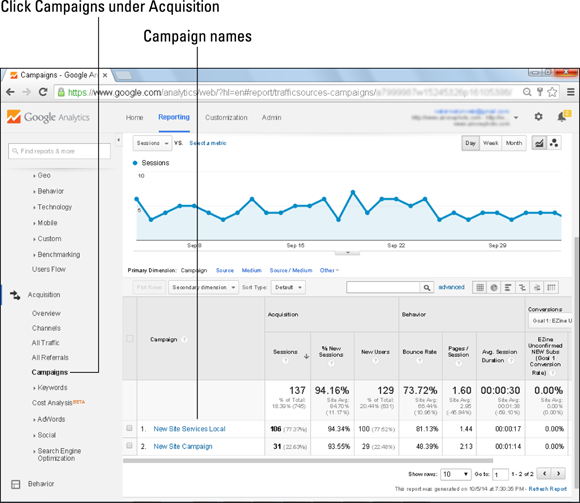
Reproduced with permission of Brad Cavanaugh, Air One, Inc.
FIGURE 2-3: You can easily track results for non-AdWords campaigns in Google Analytics.
You can use tagged links to identify traffic coming from offline sources. Create an obvious, easy-to-remember URL for print, radio, or TV ads that looks something like www.yoursite.com/tv. Then ask your programmer to create a redirect from the obvious URL to your tagged link. Because the tagged link will show up as the referrer in Google Analytics, you can determine how successfully your offline advertising drives traffic to your site. Redirects are a great way to distinguish how often your video ads are seen on YouTube versus television, for example.
The process of tagging links may be time consuming, but being able to monitor a particular campaign more accurately is worth your trouble.
Generate a separate, unique, shortened link for tweets, LinkedIn updates, and mobile sites, if needed. Always test to ensure that the modified link works correctly.
Analyzing the clickstream
Clickstream analysis is a fancy name for tracking users’ successive mouse clicks (the clickstream) to see how they surf the web. Clickstream analytics are usually monitored on an aggregate basis.
Server-based clickstream analysis provides valuable insight into visitor behavior. For instance, by figuring out which paths users most frequently take on a site and which routes lead to sales, you can make changes in content and calls to action, as well as identify ways to simplify navigation and paths to check out.
On a broader level, clickstream analysis gives you a good idea where your visitors were before they arrived at your website or social media service, and where they went afterward.
Aggregated data about user behavior or industry usage is useful while you design your social media marketing strategy. This analysis may also help explain why a campaign is or isn’t working.
In the end, however, the only data that truly matters is the data that shows what’s happening with your business, your web presence, your customers, and your bottom line.
You can easily see your upstream analysis (where visitors came from). That’s the same as your referrers. What’s harder to see is where visitors go when they leave your site. Figure 2-4 displays a clickstream analysis of where visitors were before arriving at Twitter in 2014. The URLs of the top five upstream sites are available free on the Competitive Intelligence tab for a site on Alexa. To view downstream clicks, you must upgrade to Alexa’s paid version.
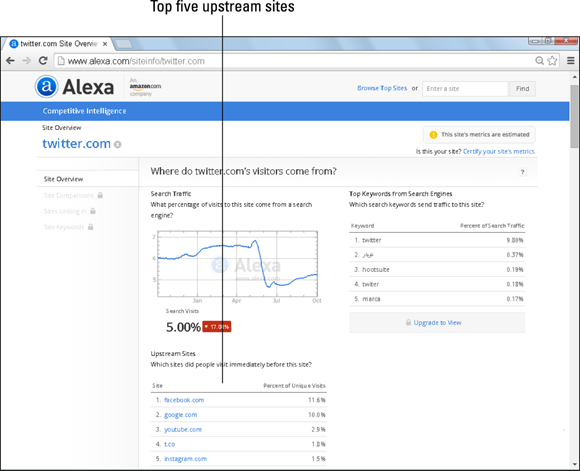
Source: www.alexa.com
FIGURE 2-4: Alexa displays the top five upstream sources for visitors before they arrive at a specific site; in this case, Twitter.
Or you can try the Interest Affinity or Site Affinity Index on Quantcast for quantified sites. It doesn’t provide specific clickstream data, but it compares the interest in other sites or areas by those who use a specific property to that of average Internet users.
Clickstream data varies over time while users run hot and cold about a particular service, while the user population changes, or while a social media technique evolves.
You can also set up a clickstream analysis for sites in Google Analytics by choosing Audience > Users Flow. For more information, visit https://support.google.com/analytics/answer/2519989.
Tracking your own outbound links
Google Analytics lets you track outbound, downstream clicks from your own pages. Your programmer must tag all outbound links you want to track, which involves some JavaScript customization. Send your programmer to https://support.google.com/analytics/answer/1136920.
For additional help, have your programmer visit Google’s Universal Analytics Upgrade Center at https://developers.google.com/analytics/devguides/collection/upgrade. If you haven’t already upgraded to Google’s Universal Analytics, you’ll find that upgrading makes the entire tracking process easier.
If you need to tag many external links, try the automated tagging solution we discuss in the section “Using Google’s URL builder to tag links,” earlier in this chapter.
To see the number of clicks to each external link in Google Analytics, choose Behavior > Events > Overview, and look under whatever category name your programmer set up to track these external links.
Integrating Social Media with Web Metrics
In addition to creating your hub website, you may have developed sites either as subdomains within your primary domain name or with auxiliary domain names. These sites may take several forms:
- Microsites: These small, dedicated sites that have their own domain names are usually developed for a specific event, product or product line, service, or another promotion, or as specialized landing pages for an advertising campaign. Whether the microsite is permanent or temporary, you must make a strategic choice to create one, judging cost, branding needs, search engine optimization (SEO), and other marketing efforts against potential benefits.
- Blogs: All blogs and other information-sharing sites, such as webinars and wikis, can be fully tracked with analytical software. Some sites, such as Ning (
www.ning.com/ning3help/set-up-google-analytics/) and Blogger (http://www.bloggertipstricks.com/?s=set+up+google+analytics), offer Google Analytics integration, but not all hosted solutions do so. Although you can obtain statistics from certain hosted communities or third parties, you may not be able to customize them or integrate them with your other statistics. - Communities: All Ning communities, as well as forums, chat rooms, and message boards, fall into this category. Although they may have their own internal statistics, also investigate whether you can customize those statistics to meet your needs before you select software or a hosted platform. For instance, Yahoo! Groups (
https://groups.yahoo.com/neo) and Google Groups (https://groups.google.com/forum/#!overview) are inexpensive community alternatives, but they provide only limited statistics.
The use of KPIs at these additional sites makes it easier to integrate user activity on your social media channels with what happens after users arrive at your primary website. To complete the analysis, add a few more comparative indicators, each of which you can analyze independently:
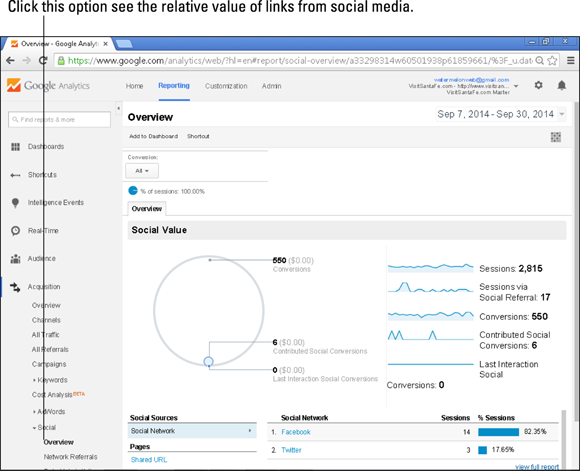
- Conversion rate: You’re already computing the percentage of visitors who complete tangible goals on your primary website, whether they purchase a product or complete a request form. Now compare the conversion rate (for the same available goal) by traffic source to the average conversion rate across all sources for that goal. Figure 2-5 displays the Social Value option in Google Analytics, which analyzes conversion rate to assess the relative value of links from various social media. (Go to Acquisition > Social > Overview and scroll down.)
- Sales and lead generation: These numbers may come from your storefront package or be based on measurements tracked offline.
Downloads: Track the number of times users download video or audio files, slide-show PDF files, white papers, or application forms from your sites.
To track downloads, email links, and phone calls derived from clicks, you can use the same approach that you do for tracking outbound links, as discussed in the section “Tagging links,” earlier in this chapter. Visit the event-tracking guide for more information (https://developers.google.com/analytics/devguides/collection/analyticsjs/events).- Pages per view, pages viewed: Microsites, communities, and blogs usually offer enough content to make these parameters reasonable to measure. Tracking this information by social source, however, as shown in Figure 2-5, can be valuable. Page views are available for most blogs but not necessarily for all other services.
- Time per visit: The average length of time spent viewing material is a good, but not exact, proxy for the number of pages per view. Naturally, users spend less time reading a single tweet than they might spend on your blog or website, but fractions of a second are indications of trouble everywhere.
- Bounce rate: For another indication of interest in your content, determine the percentage of visitors who leave without visiting a second page (related to time per visit). Like with pages per view or time per visit, the bounce rate may be a bit misleading. If many people have bookmarked a page so that they can immediately find the information they want, your bounce rate may be higher than expected, although pages per view or time per visit may be low. You may want to sort bounces by upstream source.
Reproduced with permission of Hutton Broadcasting, LLC
FIGURE 2-5: Google Analytics displays Social Value in chart and linear forms as part of the Social Overview page.
Using Advertising Metrics to Compare Social Media with Other Marketing Types
Because you generally don’t pay social media services, social media marketing is incredibly appealing as a cost-effective substitute for paid ads. You can convert the advertising metrics in the following sections to compare the cost effectiveness of your various social media efforts or to analyze social media outlets versus other forms of promotion, online and off.
Obtaining metrics for paid advertising
With the exception of pay-per-click advertising, which exists only online, the metrics used for paid advertising are the same whether you advertise online or offline. Most publishers offer advertisers a media kit that includes demographics, ad requirements, and ad rates based on one or more pricing models.
Advertising costs vary over time based on demand and availability, as well as the overall economy. Ad prices are generally based on what the market will bear — that is, the most that an advertiser is willing to bid. New, real-time bidding schemes for online advertising may make prices even more volatile. Life is negotiable in many advertising marketplaces, except for those that operate as self-service networks. It never hurts to ask for what you want. For more information, see the most recent edition of Google AdWords For Dummies by Howie Jacobson, Joel McDonald, and Kristie McDonald (John Wiley & Sons, Inc.).
Many social media sites don’t charge for posting content because their true goal is to sell either premium services or advertising. Your content generates what they sell: an audience. The more user eyeballs a social media service can deliver to its advertisers, the greater its own advertising revenue. In essence, you manufacture their product in exchange for getting some of that traffic for yourself.
CPM
Cost per thousand (CPM — confusingly short for cost per mille) impressions, one of the most consistently used metrics in advertising, work across all forms of media. CPM is based on the number of times an ad is viewed, whether it’s calculated for ads on TV, billboards, or in print magazines; received as dedicated emails; or viewed on web pages.
CPM is simple to calculate: Divide the cost by (.001) of the number of impressions (views). The more narrowly defined the audience, the higher the CPM. You can find a handy CPM calculator at www.clickz.com/static/cpm-calculator.
For instance, the CPM for a 30-second broadcast Super Bowl ad in 2014 averaged almost $36, but the actual dollar cost — $4 million — was high because the audience was 111.5 million TV viewers. By contrast, CPM for a small, highly targeted audience of CEOs in high-tech companies may run $100 or more.
Because you may have difficulty tracking from impression to action in some channels, CPM models are often used to measure branding campaigns. Figure 2-6 compares the range of CPM rates for a variety of media. CPM rates vary widely within each category based on a variety of factors.
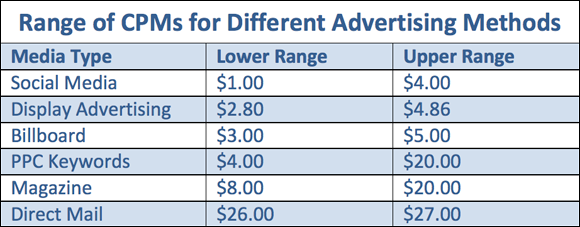
Sources: http://smallbusiness.chron.com/typical-cpm-74763.html and www.ehow.com/info_12200588_average-banner-cpm.html
FIGURE 2-6: The relative range of CPM rates for various forms of advertising in 2014.
CPA and CPC
Compare CPM with a cost-per-action (CPA) advertising model and its subset, cost-per-click (CPC) ads. CPA advertising triggers payment only when a user takes a specific action, such as downloading a white paper; signing up for a newsletter; registering for a conference; or becoming a fan, friend, or follower. At the far end of the CPA spectrum, when CPA is based on a user purchase, it approaches a sales commission model.
In the classic definitions of CPA, CPC, and CPM, rates don’t include the cost of producing an ad, the commission paid to an agency, or your own labor to research and review ad options. From a budget point of view, you need to include all these factors in your cost estimates.
A web-only metric, CPC (or sometimes PPC, for pay-per-click) falls within the CPA model because advertisers are charged only when a viewer clicks a link to a specified landing page. The CPC model is often used for ads in the rightmost columns of search engines and also for clicks obtained from banner, video, and online classified ads, and from shopping comparison sites and paid directory listings. For additional resources for paid online advertising, consult Table 2-3.
Table 2-3 Online Advertising Resources
Name |
URL |
What You Can Find |
ADOTAS |
Online advertising research and news |
|
Adwords by Google |
Ad management and solutions |
|
Interactive Advertising Bureau |
Glossary of interactive advertising terms List of standard online ad sizes |
|
Internet Advertising Competition |
Annual Internet ad competition produced by the Web Marketing Association |
|
Small Business Association |
Resources for online advertising |
|
The Webby Awards |
Interactive advertising competition |
|
Word of Mouth Marketing Association |
Membership group, resources, events |
Always ask which statistics a publisher provides to verify the results of your ads. Some confirm impressions, as well as clicks or other actions (check against your own analytics program); some provide only impressions; and some publishers can’t — or won’t — provide either one.
Even if you pay a flat fee, such as for an annual directory listing, you can compute CPC and CPM after the fact, as long as the publisher provides you with the number of impressions and you can identify click-throughs.
Reach
Reach is the estimated number of potential customers (qualified prospects) you can target in a specific advertising medium or campaign. You can apply the concept of reach, by extension, to specific social media channels, anticipated traffic on your website, or other populations, such as the addresses on your email list. Reach is sometimes expressed as a fraction of the total audience for an advertising campaign (for example, potential customers divided by total audience).
The number of potential customers may be the total number of viewers in a highly targeted campaign, or only a segment of them. In the case of the Super Bowl example in the earlier section “CPM,” for instance, a beer ad may be targeted at males ages 25 to 64; only that demographic percentage of the audience should be calculated in reach.
For the best results, identify advertising venues where the number of potential customers (reach) represents a large share of potential viewers (impressions). Return to your early market research for viewer demographics from Quantcast or review media kits to estimate the reach of each publication or social media site you’re considering.
Applying advertising metrics to social media
Because publishers receive no payments for most social media appearances, comparing free social media marketing to paid advertising requires a little adjustment. How can you compare the CPM or CPC for something that’s free versus something you pay for? Though you can acquire information about page views (impressions), clicks, and other actions (conversion goals) from your analytics program, cost requires a little thought.
One possibility is to modify the cost of advertising to include labor and hard costs for production, management, and commission, and any fees for services, such as press release distribution. Then estimate the hard costs and the amount of work in labor dollars required to create and maintain various elements of your social media presence. If you outsource the creation of ads or social media content to contractors such as copywriters, videographers, photographers, or graphic designers, include those expenses.
Don’t go crazy trying to calculate exact dollar amounts. You simply estimate the relative costs of each medium or campaign to compare the cost-effectiveness of one form of promotion to another. Social media marketing may be relatively inexpensive, but if you see only one action or impression after 20 hours of labor, you need to decide whether it’s worth it.
Contrasting Social Media Metrics with Other Online Marketing
Regardless of any other online techniques you use, you can combine links with source tags, analytics program results, and advertising metrics to compare social media results to results from other online techniques.
Refine your list of KPIs for these elements:
Email newsletters: Whether you use your own mailing list or rent one, you measure
- Bounces: Bad email addresses
- Open rate: The percentage of good addressees that open your newsletter, roughly equivalent to reach as a percentage of impressions
- Click-through rate (CTR): The percentage of people who click through to a web page after opening a newsletter
- Landing pages: Where newsletter recipients go when they click a link in a newsletter
Well-segmented, targeted lists result in better reach. If you rent lists, be sure to include the acquisition CPM names, as well as the transmission cost, in your total cost for CPM comparison. Most newsletter services and list-rental houses provide all these metrics.
- Coupons, promotion codes: Online coupons can be tracked similarly to regular banner ads. However, for both promotion codes and coupons, track the offers that produce the best results, which are almost always sales or registrations.
- Press releases: Sometimes press releases are hard to track online because many free press distribution services don’t provide information on page views or click-throughs. By contrast, most paid distribution services tell you the click-through rate and the number of impressions (or number of times someone viewed your release) on their servers. Although these services can tell you where the release was distributed, they don’t know what happened afterward. A press release is a good place to include an identifier in the links, as described earlier in the “Tagging links” section. The tag enables you to track entry pages. You may also see a spike in daily or hourly traffic to your site shortly after the distribution time.
- Product placement in games and other programs: Advertisers can now place the equivalent of banner ads or product images within online video games. If the ads are linkable, you can find the CTR and impressions to calculate CPM and CPC (cost per click). Offline games with product placement must be treated as offline marketing elements.
- Online events: Track live concerts, chats, speeches, and webinars with KPIs for registration — request an email address, at minimum — even if the event is free. Though not everyone who registers attends, this approach also provides a helpful set of leads and a built-in audience to notify of future events. Of course, you can also check referrers and entry pages.
- Disaggregated components, such as third-party blogs, chat rooms, RSS feeds, regular email, or text messaging: Tagged links that pass through from these forms of communication are probably your best bet.
You can incorporate a special tag for links forwarded by others, although you may not be able to tell how they completed the forwarding (for example, from a Share This feature versus email) unless you have implemented social media plug-ins. It all depends on what you’re trying to measure.
Be sure to register for optional analytics when you install a Share function from sites such as AddThis or ShareThis, which integrate with Google Analytics. Then you can see where and how often users forward your link through these services.
Assessing Word-of-Web and Word-of-Mouth
Word-of-mouth is, without a doubt, the most cost-effective form of advertising. Ultimately, that force powers all social media, with its peer-to-peer recommendations and referrals.
Try to keep your expectations in check. According to Microsoft research in 2012, less than 1 percent of social media content goes viral. In this case, viral is defined as reaching a much larger audience via peer-to-peer sharing compared to the audience reached by the original post.
Recent research on the impact of social media as a form of word-of-mouth is both intriguing and contradictory:
- Mention (
www.mention.com) found that 76 percent of more than 1 billion brand mentions on the web and social media were basically “meh” — neither positive nor negative. The remaining mentions are more likely to stand out. - According to eMarketer, about 68 percent of social media users 18 to 34 years old, and 53 percent ages 33 to 35 are at least somewhat likely to be influenced to make a purchase based on a friend’s social media posting.
- Lithium Technologies found that 70 percent of consumers read online reviews when considering a brand.
Keep these points in mind while you consider the positive and negative impacts of participation in social media. Review sites can have a significant impact on your marketing, but the impact of individual recommendations may be overrated except in special cases.
Your analytical task here is to compare the efficacy of “word-of-web” by way of social media to its more traditional forms. Tracking visitors who arrive from offline is the trickiest part. These visitors type your URL in the address bar of their browsers either because they’ve heard of your company from someone else (word-of-mouth) or as a result of offline marketing.
Offline marketing may involve print, billboards, radio, television, loyalty-program key-chain tags, promotional items, packaging, events, or any other great ideas you dream up.
By borrowing the following techniques from direct marketing, you can find ways, albeit imperfect, to identify referrals from offline sources or other individuals:
- Use a slightly different URL to identify the offline source. Make the URL simple and easy to remember, such as
http://yourdomain.com/tv;http://yourdomain.com/wrapper;http://yourdomain.com/nyt; orhttp://yourdomain.com/radio4. These short URLs can show viewers a special landing page — perhaps one that details an offer or a contest encouraged by an offline teaser — or redirect them to an existing page on your site. Long, tagged URLs that are terrific for online sourcing and hard-to-remember shortened URLs aren’t helpful offline. - Identify referrals from various offline sources. Use different response email addresses, telephone numbers, extensions, or people’s names.
- Provide an incentive to the referring party. “Tell a friend about us. Both of you will receive $10 off your next visit.” This technique can be as simple as a business card for someone to bring in with the referring friend’s name on the back. Of course, the card carries its own unique referral URL for tracking purposes.
- Stick to the tried-and-true method. Always ask, “May I ask how you heard about us?” Then tally the results.
You can then plug these numbers into a spreadsheet with your online referral statistics to compare offline methods with online social media.
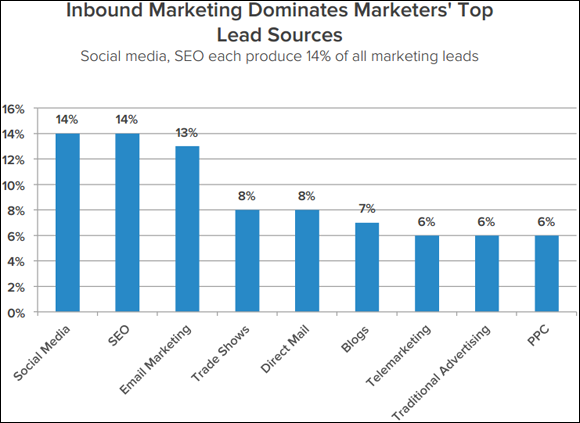
HubSpot (www.hubspot.com) compared the subjective importance of various sources of B2B lead sources by marketing channel, including some offline activities, in its 2013 State of Inbound Marketing survey. The results, shown in Figure 2-7, indicate that marketing professionals view online activities as more important sources of leads than traditional offline marketing venues, with social media, natural search (SEO), and email seen as the most important. Think about where you’re spending your marketing dollars.
Reproduced with permission of HubSpot, Inc.
FIGURE 2-7: In a HubSpot survey, businesses rated social media, SEO, and email as more valuable sources of leads than traditional marketing activities.