
1. Looking for Data in all the Right Places
On two occasions I have been asked, “Pray, Mr. Babbage, if you put into the machine wrong figures, will the right answers come out?” ...I am not able rightly to apprehend the kind of confusion of ideas that could provoke such a question.”
—Charles Babbage [1]
Somewhere around 1964, George Fuechsel is thought to have coined the phrase “garbage in, garbage out.” This popular computer science slang expression comes from early programmer education. Fuechsel taught his classes that they must check and recheck their data and coding to ensure that the results they achieved were valid. In this new era of computing, programmers were trained to test each step in their programs and cautioned not to expect that a resulting program would do the right thing even when given imperfect input. This basic premise also is true today in data analytics. Simply stated, if you use the wrong data, the results will be wrong (or worse, inaccurate).
So while originally intended for programming, this expression is equally applicable to data analysis. In this chapter, we explore what is meant by data identification and describe how this concept fits into the overall landscape of social media analytics.
Data identification is the process of identifying the subset of available data to focus on for an analysis. A key element of choosing the appropriate data source is to take the time to understand the outcomes/results.
What Data Do We Mean?
Think of data as the raw material that is transformed into information and ultimately knowledge.
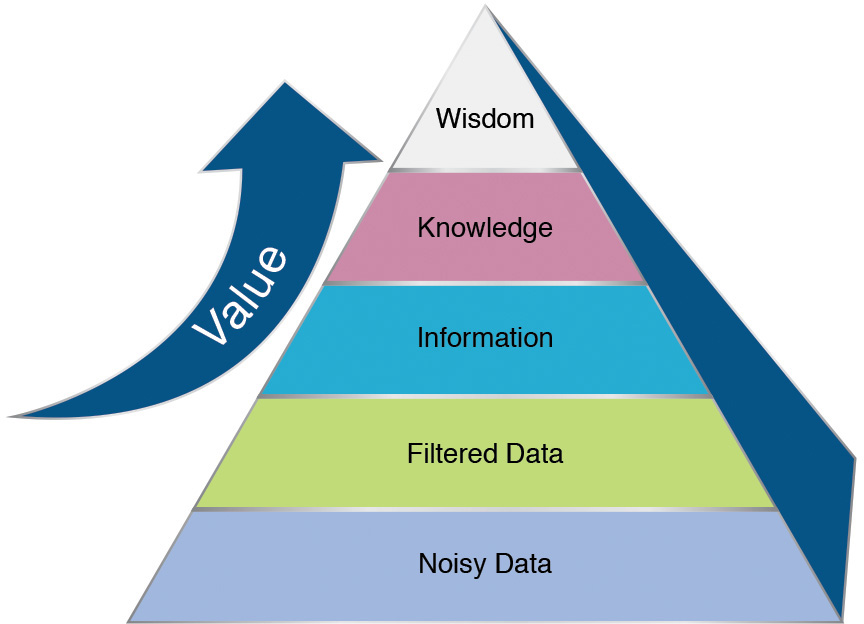
Data by itself as a concrete concept can be viewed as the lowest level of abstraction from which information (and then knowledge) can be derived. Unprocessed data refers to a collection of numbers, characters, and phrases (snippets of a blog, tweet, and so on)—think of this as “observations”—that are somewhat random and by themselves convey no meaningful information or knowledge. Many pieces of data, when combined together, analyzed, and processed, produce that next level of abstraction: information (see Figure 1.1).
Data by itself is fairly useless; however, as we process it (or begin to interpret it), it begins to become useful as it conveys some kind of message. At this point, we deem it “information.” Information is simply data that has been processed in such a way as to be meaningful to someone or something: it contains meaning, whereas data does not.
To make this concept easier to understand, let’s consider a highly simplified version of a real project that we executed. The different levels of the value pyramid could be identified as follows:
![]() Noisy Data—There is a lot of conversation happening in the marketplace about our new product, related products, and competitors’ products.
Noisy Data—There is a lot of conversation happening in the marketplace about our new product, related products, and competitors’ products.
![]() Filtered Data—There is a lot of conversation happening in the marketplace about our new product.
Filtered Data—There is a lot of conversation happening in the marketplace about our new product.
![]() Information—The conversation about our product peaked during announcements or events but tapered off precipitously shortly after the events.
Information—The conversation about our product peaked during announcements or events but tapered off precipitously shortly after the events.
![]() Knowledge—The majority of the conversation that is taking place in the marketplace is being generated by our own marketing messages. The marketplace isn’t picking up the message and engaging with it.
Knowledge—The majority of the conversation that is taking place in the marketplace is being generated by our own marketing messages. The marketplace isn’t picking up the message and engaging with it.
![]() Wisdom—Our marketing campaign for this particular brand of machines is really not working.
Wisdom—Our marketing campaign for this particular brand of machines is really not working.
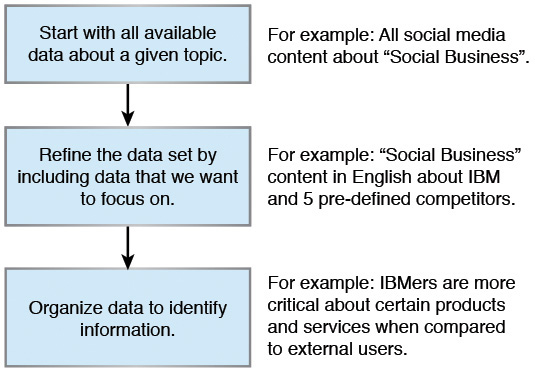
The end goal is to take all of the observations we can collect (our data), filter them so we look at only the relevant set of “puzzle pieces,” and by applying some kinds of processing to it, convert, or organize, that data into meaningful information. By “meaningful,” we mean it expresses the data in a way that conveys a new message or insight. Figure 1.2 shows a simple diagram that illustrates this concept.
According to the online Merriam-Webster dictionary, knowledge is
(1): the fact or condition of knowing something with familiarity gained through experience or association (2): acquaintance with or understanding of a science, art, or technique. [2]
That familiarity allows us to make better decisions based on the facts presented to us.
And it then follows that wisdom is the ability to think and act using this derived knowledge as well as our set of experiences, common sense, and insight.
It all starts at the bottom of that pyramid: the data. But we need to ensure we have the right data. As Chief Engineer Montgomery Scott (of the Starship Enterprise) says:
“How many times do I have to tell you? The right tool [or the right data source] for the right job!
What Subset of Content Are We Interested In?
In the context of social media analytics, data identification simply means “what” content are we interested in. In addition to the “text” of the content, we want to know:
![]() Where was it found (or in which social media venue did it appear)?
Where was it found (or in which social media venue did it appear)?
![]() Are we interested in information from a specific locale?
Are we interested in information from a specific locale?
![]() When did someone say something in social media?
When did someone say something in social media?
As an example, consider the following:
In 2012, Malala Yousafzai, a young girl from Pakistan, made national headlines as a result of the brutal attack against her by Taliban. She had taken a public stand on the rights for education for women in Pakistan. She has become widely known for her activism in Pakistan, where the Taliban had at times banned girls from attending school.
In 2009, Malala was working with the BBC and she created her blog. In this blog, she wrote of life under the Taliban rule in Swat valley, Pakistan, and her strong support for a woman’s right to an education. The views of a 12-year-old girl on women’s education and the Taliban regime caused quite a sensation. Many newspapers worldwide gave prominent coverage to her blog and her views. New York Times even created a documentary film about her life and views of the social situations in her region of the world. This obviously made her quite famous and her enemies quite upset. In October 2012, when Malala boarded her school bus, a gunman boarded the bus and fired three shots directly at her. She suffered major injuries to her face. She was in critical condition for several days. She was later transferred to a hospital in England for rehabilitation. Even though a lot of Islamic religious leaders came to her support after this incident, the Taliban was still intent on harming her and her family. This assassination attempt sparked an international outpouring of support for Malala, ultimately leading to her nomination for the 2013 Nobel Peace Prize [3].
So in this case, say we were trying to pose the question, “What is the reaction of the general population to Malala, the young girl from Pakistan who defied Al Qaeda, in the Western media?” Where should we look for relevant data to analyze?
The word relevant here is important. Remember the basic principle of garbage in, garbage out. We could pull data from “everywhere” in the social media space, but we want to be sure that the data we use in our analysis is relevant to the question we are trying to answer.
The data identification process would go as follows:
![]() We want to analyze content in the media, so we might choose to focus on popular news media and ignore blogs, bulletin boards, Twitter, and so on.
We want to analyze content in the media, so we might choose to focus on popular news media and ignore blogs, bulletin boards, Twitter, and so on.
![]() We want to analyze content in the Western media, so we would focus on the content emanating from a region considered “West” and eliminate content from other regions.
We want to analyze content in the Western media, so we would focus on the content emanating from a region considered “West” and eliminate content from other regions.
The process of identifying relevant data can be accomplished in a single step, or it might take multiple steps, depending on the type of project we are working on. The process described in this section can be considered as follows:
![]() Step 1: What content are we interested in?
Step 1: What content are we interested in?
In subsequent sections, we discuss additional possible steps as follows:
![]() Step 2: Whose comments are we interested in?
Step 2: Whose comments are we interested in?
![]() Step 3: What window of time are we interested in?
Step 3: What window of time are we interested in?
Whose Comments Are We Interested In?
A second possible step in the data identification process gets into more details. Considering the previous example, we need to think about issues such as the following:
![]() Should we eliminate content from sources that are known to be pro Al Qaeda because of negative bias?
Should we eliminate content from sources that are known to be pro Al Qaeda because of negative bias?
![]() Should we eliminate all content from young girls because of positive bias?
Should we eliminate all content from young girls because of positive bias?
Bias is a prejudice in favor of or against one thing, person, or group compared with another, usually in a way that is considered to be unfair. Being biased implies that we may have only one side of a story; thus, any conclusions we make from the data provided are bound to be biased toward one side. Being biased means that the entire data collected already had a preconceived opinion, and any analysis done on it would be useless.
For example, is there a segment of the population in our target audience, say young girls, who are so impressed by the inherent heroism in the stance taken by another girl against an organization that their comments may not be objective enough for our study?
What Window of Time Are We Interested In?
A third step in the data identification process considers the window of time for relevancy of the data. Would there be any sense in collecting data from three years ago? Should we include in the window of time Malala’s address to the United Nations? There may be a case for doing that: if we want to look at the sentiment (or feelings) toward her over time. For example, has the public perception changed over time? But if we group all of the data about her and don’t take time into consideration, we may find that the dataset is biased toward her as a “hero” (if the amount of conversation were considerably larger when she was nominated for the Nobel Prize) or perceived as a “villain” (if there were a huge outcry at the start of the incident and very little coverage of her as a Nobel Prize candidate).
Attributes of Data That Need to Be Considered
As the example that we have discussed so far illustrates, the “data identification phase” involves a variety of distinct steps. We discussed three of these steps so far. In the projects that we have executed, we have come across a number of attributes of data that come into play in the data identification phase. In this section, we address these attributes and describe how they help during the data identification phase.
Let’s look at the following seven attributes of data:
![]() Structure
Structure
![]() Language
Language
![]() Region
Region
![]() Type of content (blog, microblog, wiki, and so on)
Type of content (blog, microblog, wiki, and so on)
![]() Venue
Venue
![]() Time
Time
![]() Ownership of data (Private, Public, and Proprietary)
Ownership of data (Private, Public, and Proprietary)
Structure
The simplest way to define structured data is to think of it as data that resides in a fixed field within a record or file. The content of the dataset is very well known—so well known that we can define “columns” of elements in the data such that we will know ahead of time what the data looks like. It’s so predictable that we can have any number of “rows” of this same format and know that it will be consistent across the dataset. This type of data is commonly contained in a relational database or a typical spreadsheet.
Various data manipulation and data analysis tools and techniques can be used for this type of data. One example of this type of data is survey results. If a company surveys its customers and collects their (well-defined) answers to specific survey questions, this data can be organized in a relational database since we know the question and we know all possible values of the answers. Some other examples are inventory records, sales forecasts, maintenance records, and so on.
Unstructured data, on the other hand, cannot be easily stored in a relational database to facilitate data manipulation or data analysis. For example, in the survey example shown in Figure 1.3, if the survey form includes a field for free-form comments, the responses to this field can be considered “unstructured data” because we have no way of knowing ahead of time what will be entered (other than it will consist of a string of characters).
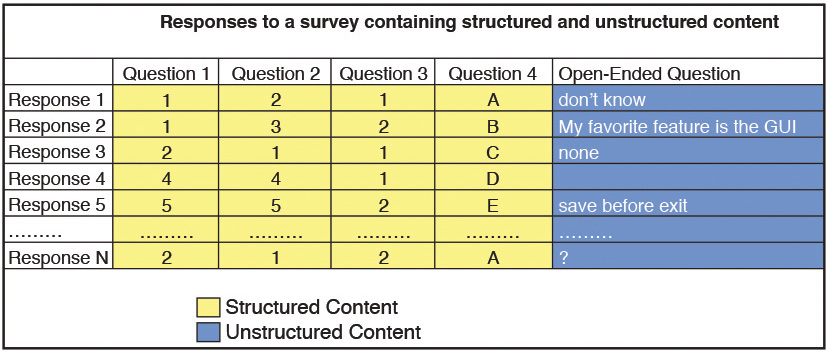
A collection of tweets about a Super Bowl advertisement is another example. Some people will rave about it, but others will hate it. In either case, we have no idea of the structure of the comments or the format in which they will say it. Other forms of unstructured data include images, audio, and video files. In this book, we restrict the analysis of unstructured content to text.
Language
Consider these simple statements:
“I love the taste of the new Coke.”
and
“Pepsi is my favorite soft drink.”
In French, they become:
“J’aime le goût du nouveau Coke.”
and
“Pepsi est mon préféré softdrink.”
If the objective of the project is to identify the number of mentions of Coke versus Pepsi in popular media, perhaps the exact language of the post (whether English or French) isn’t all that important. However, if the objective of the project is to identify how many positive mentions of Coke there are as compared to Pepsi, the language becomes very significant. For example, if the tool for sentiment identification “detects” sentiment using a dictionary lookup of positive/negative terms, one needs to ensure the language used is supported for those dictionaries.
Region
While it may seem obvious, if the goal is to understand the issues associated with clean drinking water in South Africa, it is important to ensure that the data included in the analysis is only from that region of the world. On the other hand, one may be interested in a world view of clean water in an attempt to understand how South Africa is discussed within that context. In the former case, one needs to be able to filter the initial data source by the country or origin. Some sources of social media (such as Twitter, which uses location-aware technology on mobile devices) do that very well, although the amount of data is sometimes smaller than that from non-mobile devices. Of course, a native South African blogging from a site in the United Kingdom may be of interest in the analysis; in this case, the question (or problem) becomes: can one easily identify that blog author as South African?
Type of Content
A number of different data sources can be used in the analysis of consumer sentiment or in the understanding of any discussion around a particular topic. Each of these different data sources has its own unique challenges in terms of manipulation and analysis, and quite honestly, usefulness. For example, a tweet can be only 144 characters long, while a paper in a technical journal can span multiple pages. This is an attribute that really identifies a variety of different types of content. Consider some of the following sources of potential social media content:
![]() Text—Written text that is easy to read and understand if you know the language
Text—Written text that is easy to read and understand if you know the language
![]() Photos/pictures—Scientific drawings, simple sketches, or photographs
Photos/pictures—Scientific drawings, simple sketches, or photographs
![]() Audio—Audio recordings of books, articles, talks, or discussions
Audio—Audio recordings of books, articles, talks, or discussions
![]() Videos—Orientation, education, and training; “How to”
Videos—Orientation, education, and training; “How to”
With the rise of social media outlets such as YouTube, Pinterest, and Snapchat, virtually every Internet user can become a publisher, broadcaster, and critic. With Facebook claiming about 1.5 billion active users—each with the average user posting 90 pieces of content a month—that averages out to about 7.5 billion pieces of social content to potentially be analyzed per month. But also consider nonprint content, specifically videos. YouTube’s over 1 billion users upload more video content in a 60-day period than the three major US television networks have created in 60 years.
Consider the recording of a conference session on the use of specific tools or services. The off-the-cuff comments or live user feedback could reveal very interesting observations about a topic that, when overthought, may not make it into a white paper or published blog. A simple preprocessing of the data—what we like to call “data augmentation”—would take the audio/video content and transcribe it into text, where it can be treated like regular unstructured data from Twitter, Facebook, or LinkedIn.
While this book is about text analytics, the analysis of visual images can be equally important.
As Kyle Wong pointed out in Forbes, as more social media platforms (like Twitter) begin to emphasize photos and link them to purchasing opportunities (such as Pinterest), brands will need to measure visual content as a form of “word of mouth” marketing [6].
News, Press Releases, and Instructions
At first, the thought of using news stories for deriving customer sentiment or opinions doesn’t seem very productive. Most news stories present the opinion of an organization (some will argue that the opinions of these organizations are biased) or simply report the news of a new product announcement using a company’s marketing material. There is typically no room for understanding the sentiment of readers. However, evaluating the value of using news stories can be interesting for two reasons.
First, most news sites today post an article or story and allow readers to leave comments. Those comments and feedback are the content we may want to “mine” and analyze. If the story goes viral, the amount of feedback could be significant. The ability to derive meaningful inference and insight from comments is enhanced when the number of comments is large.
Another reason to look at the news is to understand the effect it has on the general population. One way to gauge the effect is via sentiment analysis. An analysis of the article could reveal a negative sentiment toward a product or issue. As we gather data within social media spaces that reference that news story, we may find that the general population doesn’t have a negative sentiment toward the topic but perceives it just the opposite. Of course, if the topic at hand had a positive sentiment before the news story was released and then a negative sentiment afterward, we can assume (but perhaps not know for certain) that the news article had something to do with the change of heart. This is a valuable piece of knowledge for an organization. The understanding of who (or in this case, what news service) can change the public’s perception of you or your product is an incredibly important factor when looking for an outlet to advertise products/services.
As an example of the influence that social media can have on issues of public opinion, consider the ethical issues around the use of animals in medical testing. Animal testing is a huge “hot button” issue with a large number of opinions on either side of the debate. On its own, it’s an industry in which there are not only companies dedicated to the breeding of animals used for experimental purposes but also concerns around those companies that employ those techniques.
According to a study reported in Science [7] in early 2014, support for medical testing on animals had declined overall by 12% since 2001 (in the United States), and according to the analysis, the researchers believed the Internet (specifically social media) may be responsible for the decline. The study, which was conducted by researchers at the advocacy group People for the Ethical Treatment of Animals (PETA) and Western Governors University, analyzed survey data from the previous 12 years looking at public opinion around this topic. A result of their work showed that 41% of American adults considered animal testing “morally wrong” in 2013, up from 29% in 2001. Opposition (luckily) to such testing has risen among all demographic groups, but the biggest jump has been among people aged 18 to 29, which jumped to 54% in 2013 versus just 31% in 2001. If we look at the social media impact, we see that animal rights organizations have a much stronger presence on social media than do pro-animal testing groups. PETA, for example, had more than 2 million followers on Facebook and nearly a half million on Twitter, as opposed to the Foundation for Biomedical Research, which has around 130,000 followers on Facebook and about 1,700 on Twitter at the time of the study. As a result, the researchers speculate, these organizations may be getting their message out more effectively, especially among young people.
Discussion Forums, Blogs, Wikis, and Microblogs
From a social media perspective (or the “true” voice of a customer), there is nothing better than social media sites where people express their feelings, anxieties, and joys 24 hours a day, 7 days a week (and usually many times per day).
Social media refers to the interactions among people or groups, where they create, share, and exchange information and ideas in an open and mostly public venue. The term social media also can be viewed in a much broader context of Internet-based tools and platforms that increase and enhance the sharing of information. This new communication vehicle makes the transfer of text (opinions), photos, and audio/video (marketing) increasingly easy among users and (with the growth of mobile devices) instantaneous.
Platforms such as Twitter, Facebook, and LinkedIn have created online communities where users can share as much or as little personal information as they desire with other members. Some are more “open” than others. For example, with Facebook and similarly LinkedIn, anything posted to your wall can be viewed by everyone in your community (your friends), which is a finite number. In the case of Twitter, anything said is instantly available to the over 289 million Twitter users on the planet [8]. The result is an enormous amount of information that can be easily shared, searched, and created on a daily basis.
Venue
Content is getting generated and shared in a variety of venues. There are popular news sites such as Time, CNN, and Huffington Post. There also are professional networking sites such as LinkedIn, social networking sites such as Facebook, and microblogging sites such as Twitter. Depending on the type of project you are working on, the venue becomes very significant. For example, if your project involves understanding sentiment about tennis players during a tennis match, a microblogging site like Twitter is probably a very good source of information. If, on the other hand, you are trying to understand which government contracts are insisting on accessibility features, you might have to target some specific venues to get to this type of information.
Following is a representative list of common venues that we typically encounter:
![]() News
News
Newspapers and magazines
News sites (CNN, Time, Huffington Post)
![]() Social networking/social sharing sites
Social networking/social sharing sites
Google+
SlideShare
![]() Blogs
Blogs
WordPress
Tumblr
Microblogging platforms like Twitter
![]() Custom venues
Custom venues
Government procurement websites
Websites dedicated to legal or medical professionals
Time
Author Jarod Kintz once said, “Just because I liked something at one point in time doesn’t mean I’ll always like it, or that I have to go on liking it at all points in time as an unthinking act of loyalty [9].” This brings us to the temporal state of data.
When we think of the time attribute of data, we’re referring to the currency of it. For your analysis, do you need content for the past week, month, or for the past 10 years? Sometimes for a project there is a need to access data in real time or near real time. For our purposes, we like to think of data in these two states:
![]() Data at Rest has been created and isn’t changing (or actively being added to). For example, if you are trying to analyze Twitter content to determine which movie was the most popular among users in social media before the Academy Awards of 2011, most of the data would be “at rest,” meaning the content is already created and the analysis can be done at your own pace.
Data at Rest has been created and isn’t changing (or actively being added to). For example, if you are trying to analyze Twitter content to determine which movie was the most popular among users in social media before the Academy Awards of 2011, most of the data would be “at rest,” meaning the content is already created and the analysis can be done at your own pace.
![]() Data in Motion is real-time data created continuously and constantly. For example, if one is trying to identify the shifting sentiment between Barack Obama and Mitt Romney during the 2012 presidental debates, the data would be considered “in motion” during the course of the debate.
Data in Motion is real-time data created continuously and constantly. For example, if one is trying to identify the shifting sentiment between Barack Obama and Mitt Romney during the 2012 presidental debates, the data would be considered “in motion” during the course of the debate.
One variation of Data in Motion is something we call “near real time”; this data is collected in real time but is slightly late in its arrival. For example, we collect Twitter data in our lab in real time, but we copy the collected data to our analysis systems once every 5–10 minutes (due to some processing overhead). So this data is close (or near) to real time, but not instantaneous. Being able to get access to instantaneous data for analysis purposes requires a significant investment in storage and computing capacity. Often, near real-time data can serve the purpose at a significantly lower cost.
Ownership of Data
One way to look at the ownership of data is to think of data as “internal” (belonging to a company) or “external” (data in the public domain). Another way to think about it is to divide this area into these types:
![]() Public Data—A majority of the content shared by people on Facebook, Twitter, and other public venues is predominantly public data. People performing analysis of this kind of data still have to be careful. The venues where the content is created and disseminated have specific terms that define what constitutes the proper use of that data. For example, using a public Twitter feed, users can gain access to a variety of actual tweets being used by different people about a particular topic, but specific terms from Twitter govern how these tweets can be included or displayed on our own website. In addition, users of this data also need to adhere to the specific guidelines provided by each country about the use and handling of public content.
Public Data—A majority of the content shared by people on Facebook, Twitter, and other public venues is predominantly public data. People performing analysis of this kind of data still have to be careful. The venues where the content is created and disseminated have specific terms that define what constitutes the proper use of that data. For example, using a public Twitter feed, users can gain access to a variety of actual tweets being used by different people about a particular topic, but specific terms from Twitter govern how these tweets can be included or displayed on our own website. In addition, users of this data also need to adhere to the specific guidelines provided by each country about the use and handling of public content.
![]() Private or Proprietary Data—All of the social media content generated in a company’s intranet should be considered either private or proprietary. There are specific terms of use for this data.
Private or Proprietary Data—All of the social media content generated in a company’s intranet should be considered either private or proprietary. There are specific terms of use for this data.
Summary
In this chapter, we discussed various issues surrounding the selection and inclusion of various data sources and data types in an analysis. Our view is that the selection of the “right” data will have a positive effect on your overall conclusions and insights. Others may argue that with the cost of computing on the decline, analysts shouldn’t be concerned over what data they draw from; the analytics in the various software solutions can (and should) sort out the relevant from the irrelevant. And while this is true, from what we have seen, starting from a “cleaner” or perhaps more focused data source tends to produce more accurate results in a shorter time frame. There’s nothing wrong with starting with a well-formed data source, deriving some results and then going back to add additional data sources (to perhaps expand the horizon of the analysis). Just be careful that you don’t spend more time sorting through the garbage in the hopes of finding that diamond. We agree such diamonds may be there, but is the value spent on the search worth the value derived?
Referring back to the opening value pyramid in Figure 1.1, we believe the best conclusions or insights we can draw from the data we collect are only as good (accurate or meaningful) as the data we start with. This is the basic premise of the garbage-in, garbage-out model. We recognize that social media data, by definition, has a lot of noise. In this chapter, we have offered ideas on how to minimize the noise because the more relevant the data that goes in, the better insights will come out of the analysis process.
Endnotes
[1] Babbage, Charles, Passages from the Life of a Philosopher (New York: Augustus M. Kelley Pubs, 1864).
[2] See http://www.merriam-webster.com/dictionary/knowledge.
[3] See https://en.wikipedia.org/wiki/Malala_Yousafzai.
[4] See http://www.statista.com/statistics/264810/number-of-monthly-active-facebook-users-worldwide/.
[5] See http://www.youtube.com/yt/press/statistics.html.
[6] Wong, Kyle, “The Explosive Growth of Influencer Marketing and What It Means for You,” Forbes, September. 10, 2014. See http://www.forbes.com/sites/kylewong/2014/09/10/the-explosive-growth-of-influencer-marketing-and-what-it-means-for-you/.
[7] Grimm, David, “ScienceShot: Is Social Media Souring Americans on Animal Research,” Science, February 16, 2014. Retrieved from http://news.sciencemag.org/plants-animals/2014/02/scienceshot-social-media-souring-americans-animal-research.
[8] See http://www.statisticbrain.com/twitter-statistics/.
[9] Kintz, Jarod and Arod, Dora, At even one penny, this book would be overpriced. In fact, free is too expensive, because you’d still waste time by reading it (Kindle Edition, Kindle eBook, January 9, 2012).