
Chapter 8
The Future of Social Security and Medicare
Learning objectives
- Identify conventional wisdom on the future of Social Security and Medicare.
- Recognize official Social Security and Medicare concerns based on reports.
- Recall the effect of longer lifespans on the predicted shortfall in the Medicare system.
- Recognize the effect that the rules under the Patient Protection and Affordable Care Act (Affordable Care Act or ACA) have on Medicare costs.
Overview
When Social Security was established in 1935, a person who had attained age 65 had a 12-year life expectancy. Today, the average 65-year-old has a life expectancy of 20 years, according to the National Center for Health Statistics.
In 1950, 16.5 workers paid in retirement benefits for each retiree. According to reports from the Social Security Administration (SSA), in the year 2030, the ratio will be approaching only two workers paying in retirement benefits for each retiree. By then, the burden of taxes on each worker may well be unmanageable.
This section will examine what is occurring in both Social Security and Medicare trust funds and explore ways to address expected and worrisome shortfalls.
The system is strained
Social Security and Medicare (along with subsidies for the Affordable Care Act) are the two largest federal programs, accounting for 50% of federal expenditures in fiscal year 2017. Social Security spending accounted for 23%, and Medicare and ACA subsidies accounted for 27% of the spending. Both programs are expected to struggle with cost growth in excess of gross domestic product (GDP) growth in the coming decades. A major challenge to the Social Security system comes from an aging population. In the case of Medicare, the growth in expenditures per beneficiary will continue to strain the system.
The aging population has led the SSA to predict that the Social Security system will eventually exhaust its funds. Although the SSA had hoped for solvency over the next 75 years, quantitative analysis makes clear that the system is solvent only until 2034. After that, and without meaningful changes, Social Security would be funded to pay only about 78% of promised benefits.
Inadequate personal retirement savings
Amid this, Americans are woeful about retirement savings. Few workers save enough to make up for the loss of traditional guaranteed pensions that have frequently been replaced by less certain arrangements, such as 401(k) plans. According to a recent government accountability office (GAO) study, Americans ages 55–64 have retirement savings of $104,000.1
This will leave many retirees heavily reliant on Social Security, which currently pays a modest benefit; on average, $1,461 a month. Most retirees, with annual incomes up to $32,600, receive two-thirds to 100% of their postretirement income from Social Security.
Americans with incomes of up to $57,960 count Social Security as the largest component. Only the top fifth of seniors, with incomes of more than $57,960, do not rely on Social Security as their largest source of income. Even in this income group, Social Security represents about 20% of their annual income. Many in that classification are still working.
What Social Security has to say
The trustees of the Social Security and Medicare trust funds are required to report on the current and projected financial status of both programs on an annual basis (https://www.ssa.gov/OACT/TR/2018/index.html).
According to their report, the long-run actuarial deficits of the Social Security and Medicare programs decreased in 2017. The actuarial deficit in the Medicare hospital insurance program grew mainly because the trustees incorporated recommendations of the 2010–2011 Medicare Technical Panel to increase long-run health cost growth rate assumptions. Simultaneously, however, investment returns did not increase.
The actuarial deficit in Social Security remained the same mainly because of the adjustment for updated economic data and assumptions.
Under current projections, the annual cost of Social Security benefits expressed as a share of workers’ taxable earnings will grow from 13.81% in 2018 to roughly 17.0% in 2039 and will then increase slightly through 2092.
As expected, the trustees reported that neither Medicare nor Social Security will be able to sustain projected long-run program costs under current financing methods. Their findings propose that legislative modifications are necessary to avoid benefit shortfalls for beneficiaries.
Rapid change is necessary
The report indicates that if Congress acts sooner rather than later, more options and more time will be available to phase in changes, giving the public adequate time to prepare.
Concerns regarding Social Security
Both Social Security and Medicare will likely experience cost growth substantially in excess of GDP growth through the mid-2030s due to
- rapid population aging caused by the large baby-boom generation entering retirement and generations with lower birth rates entering employment, and
- growth in Medicare expenditures per beneficiary exceeding growth in per-capita GDP.
Social Security’s total income is projected to exceed its total cost through 2021 as it has since 1982. The 2016 surplus of total income relative to cost was $35 billion. However, when interest income is excluded, Social Security’s cost is projected to exceed its noninterest income throughout the projection period as it has since 2010. The trustees project that this annual noninterest deficit will average about $85 billion between 2018 and 2020. It will then rise steeply as income growth slows to its sustainable trend rate as the economic recovery is complete, while the number of beneficiaries continues to grow at a substantially faster rate than the number of covered workers.
After 2020, interest income and redemption of trust fund asset reserves from the General Fund of the Treasury will provide the resources needed to offset Social Security’s annual deficits until 2034 when the reserves will be depleted. Thereafter, scheduled tax income is projected to be sufficient to pay about three-quarters of scheduled benefits through the end of the projection period in 2092. The ratio of reserves to one year’s projected cost (the combined trust fund ratio) peaked in 2008, declined through 2016, and is expected to decline steadily until the trust funds are depleted in 2034.
The money source
Redemption of trust fund assets from the general fund of the Treasury will be necessary in order to provide the resources needed to offset Social Security’s annual cash flow shortfalls. Because these redemptions will be lower than interest earnings through 2021, nominal trust fund balances will continue to grow. A temporary reduction in the Social Security payroll tax rate reduced payroll tax revenues by $103 billion in 2011 and by $112 billion in 2012. The legislation establishing the payroll tax reduction also provided for transfers of revenues from the general fund to the trust funds in order to reasonably replicate payments that would have occurred if the payroll tax reduction had not been enacted. Those general fund reimbursements comprised about 15% of the program’s noninterest income in 2011 and 2012.
Deficits are worrisome
Costs display a slightly different pattern when expressed as a share of GDP. Program costs equaled 4.9% of GDP in 2018, and the trustees project these costs will increase to 6.1% of GDP by 2038, decline to 5.9% of GDP by 2052, and thereafter rise slowly, reaching 6.1% by 2092.
The projected 75-year actuarial deficit for the combined old-age and survivors and disability insurance (OASDI) Trust Funds is 2.84% of taxable payroll, up from 2.83% projected in last year’s report.
The Bipartisan Budget Act of 2015 was projected to postpone the depletion of Social Security Disability Insurance (SSDI) Trust Fund by six years, to 2022, largely by temporarily reallocating a portion of the payroll tax rate from the Old-Age and Survivors Insurance (OASI) Trust Fund to the SSDI Trust Fund. The effect of updated programmatic, demographic, and economic data extends the SSDI Trust Fund reserve depletion date by 10 years to 2032, in this year’s report due to less filings for disability benefits since 2010. Although legislation is needed to address all Social Security’s financial imbalances, the need remains most pressing with respect to the program’s disability insurance component.
By law, the OASI and SSDI trust funds are separate entities. However, to summarize overall Social Security finances, the trustees have traditionally emphasized the financial status of the hypothetical combined trust funds for OASI and SSDI. The combined funds satisfy the trustees’ test of short-range (10-year) close actuarial balance. The trustees project that the combined fund asset reserves at the beginning of each year will exceed that year’s projected cost through 2022. However, the funds fail the test of long-range, close actuarial balance.
Knowledge check
- By when does the SSA’s analysis presume that the OASDI system will be inadequately funded?
- In 75 years.
- 2037–2050.
- 2034.
- 2027.
Medicare
The Medicare hospital insurance (HI) Trust Fund that supports Part A faces depletion earlier than the combined Social Security trust funds (although not as soon as the Disability Insurance Trust Fund when separately considered). Although the projected HI Trust Fund’s long-term actuarial imbalance is smaller than that of the combined Social Security trust funds (under the assumptions employed in this report), funding concerns are significant.
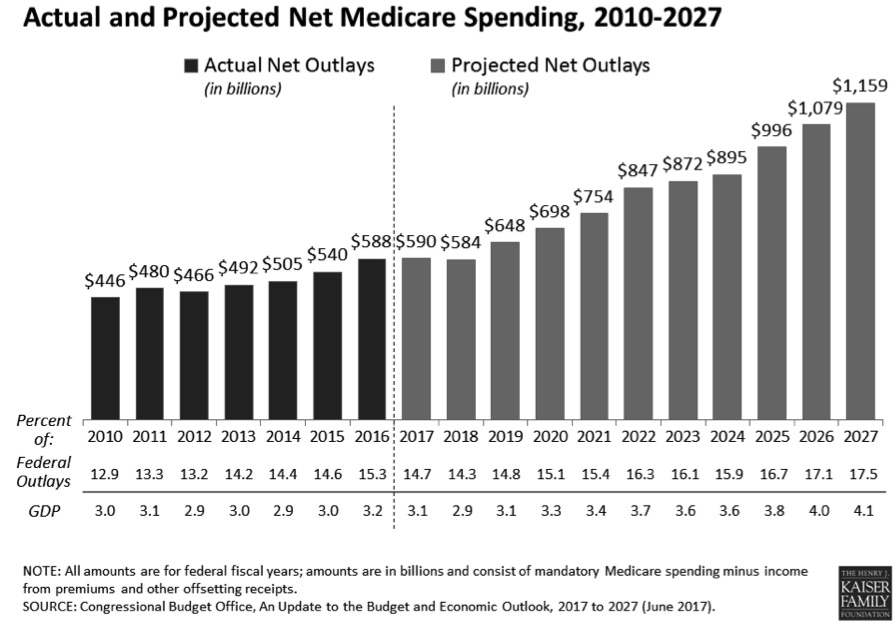
The trustees project that total Medicare costs (including both HI and supplementary medical insurance or SMI expenditures) will grow from approximately 2.1% of GDP in 2016 to 3.4% of GDP by 2037 and will increase gradually thereafter to about 3.7% of GDP by 2091.
Deficit projections
The trustees project that the HI Trust Fund will be depleted in 2026, three years sooner than projected in last year’s report. At that time, dedicated revenues will be sufficient to pay 91% of HI costs. The trustees project that the share of HI cost that can be financed with HI dedicated revenues will decline slowly to 78% in 2039 and will then rise gradually to 85% in 2092. HI expenditure is projected to exceed noninterest income throughout the projection period as it has in every year since 2008. The HI fund again fails the test of short-range financial adequacy because its trust fund ratio is already less than 100% of annual costs and is expected to decline in a continuous fashion until reserve depletion in 2026.
The HI Trust Fund’s projected 75-year actuarial deficit is 0.82% of taxable payroll, which amounts to 0.4% of GDP through 2092, or 21% of noninterest income, or 17% of program cost. This estimate is up from 0.64% of taxable payroll projected in last year’s report. This estimate reflects a 0.01 percentage point increase in the HI actuarial deficit that would have been expected if nothing had changed other than shifting the valuation period forward one year to 2017 through 2091, and a 0.17 percentage point decrease due to new data and changed assumptions.
To clarify, benefits are not simply distributed from a trust fund filled with income-producing assets. Unlike private sector pension funds, benefits are paid out of tax revenues. The trust funds essentially operate as accounting devices. As the trust funds draw down assets, general revenues (tax revenues in addition to the payroll taxes earmarked for these programs) transfer into the trust funds to redeem bonds that had previously been placed there during years when revenue from the payroll tax exceeded costs.
Challenges in a low return environment
The current Social Security trust fund contains only Treasury securities. Returns on Treasury securities have reached historic lows. The worsening of HI long-term finances is principally due to the adoption of short-range assumptions and long-range cost projection methods recommended by the 2010–2011 Medicare Technical Review Panel. Use of those methods increases the projected long-range annual growth rate for Medicare’s costs by 0.3 percentage points. The new assumptions increased projected short-range costs, but those increases are offset, temporarily, by a roughly 2% reduction in 2013–2021 Medicare outlays required by the Budget Control Act of 2011.
Part B is more solid
For SMI, the trustees project that both Part B (which pays doctors’ bills and other outpatient expenses) and Part D (which pays for prescription drug coverage) will remain adequately financed into the indefinite future because current law provides financing from general revenues and beneficiary premiums each year to meet the next year’s expected costs. However, the aging population and rising healthcare costs cause SMI projected costs to grow steadily from 2.2% of GDP in 2017 to approximately 3.4% of GDP in 2039 and then more slowly to 3.7% of GDP by 2092. General revenues will finance roughly three-quarters of these costs and premiums paid by beneficiaries almost all the remaining quarter. SMI also receives a small amount of financing from special payments by states and from fees on manufacturers and importers of brand-name prescription drugs.
Impact of the Affordable Care Act
Projected Medicare costs over 75 years are substantially lower than they otherwise would be because of provisions in the Patient Protection and Affordable Care Act, as amended by the Health Care and Education Reconciliation Act of 2010 (the Affordable Care Act or ACA). Most of the ACA-related cost saving is attributable to a reduction in the annual payment updates for most Medicare services (other than physicians’ services and drugs) by total economy multifactor productivity growth, which the trustees project will average 1.1% per year.
In recent years, U.S. national health expenditure (NHE) growth has slowed considerably. There is uncertainty regarding the degree to which this slowdown reflects the impact of the recent economic conditions and other nonpersistent factors, as opposed to structural changes in the healthcare sector that may continue to produce cost savings in the years ahead. It is possible that U.S. healthcare practices are becoming more efficient as new payment models develop and providers anticipate less rapid growth of reimbursement rates in both the public and private sectors than has occurred during the past several decades.
The ACA’s cost-reduction provisions were designed to create substantial savings. Notwithstanding the assumption of a substantial slowdown of per capita health expenditure growth, the projections indicate that Medicare still faces a substantial financial shortfall that will need to be addressed with further legislation. Such legislation should be enacted sooner rather than later to minimize the impact on beneficiaries, providers, and taxpayers.
It remains to be seen what additional action the current administration will take that might affect the ACA, Medicare, and other aspects of the healthcare industry.
Budgetary concerns
The drawdown of Social Security and HI Trust Fund reserves and the general revenue transfers into SMI will result in mounting pressure on the federal budget. In fact, pressure is already evident. The Medicare Modernization Act (2003) requires that the board of trustees determine each year whether the annual difference between program cost and dedicated revenues (the bottom four layers of exhibit 8-3) under current law exceeds 45% of total Medicare cost in any of the first seven fiscal years of the 75-year projection period. If so, the annual trustees report must include a determination of “excess general revenue Medicare funding.” The trustees made that determination every year from 2006 through 2013, but because the difference between program cost and dedicated revenues is not expected to exceed the 45% threshold during fiscal years 2014–2020, there is no such determination in the current report.
Fixing the problems
The politics
From its beginnings in 1935, politicians saw Social Security as a means to remove people from the workforce. It is noteworthy that Social Security was passed during the Great Depression when unemployment was high. The demand for jobs exceeded the supply.
Over time, Congress enacted rules to support this viewpoint. For example, workers had to retire to get all of their Social Security retirement benefits. If they continued to earn income, they would lose part of their payments.
In 1950, Congress exempted retirees age 75 and older from income limitation. That threshold was lowered to 72 in 1954 and 70 in 1983. The law that prevails now is the 2001 Freedom to Work Act, which ended the earnings limit for those at full retirement age (currently age 66) and older.
Current proposals
Legislation has been introduced in the Senate and House of Representatives, in each of the past few years. The legislation has not been voted on, but the following is a list of many ideas proposed to fix the problems:
- Increase the Social Security benefit computed by its existing formula by 1% per year until the increase gets to 15%. The idea here is to give all Social Security recipients a permanent increase in Social Security benefits above the cost of living adjustment (COLA).
- Use CPI-E, the consumer price index for elderly consumers rather than the current CPI. The CPI-E has greater weight given to housing and medical costs. On average over the past 30 years, the CPI-E has run about 0.3% higher than the CPI-W currently used.
- Give a minimum benefit to any worker who has worked for 10 years or more. The increased benefit would be 6.25% of the National Average Wage Index (NAWI) for someone with 11 years of employment and rising on a sliding scale to the maximum 125% of the NAWI for someone employed for 30 years or more.
- Raise or eliminate the ceiling of wages subject to Social Security withholding. The 2019 wage limit for Social Security withholding is $132,900. The proposal would tax wages for Social Security similar to taxation of wages for Medicare, which currently has no upper limit.
- Create another bend point in the PIA formula at 10%. A new 10% bend point would reduce the Social Security benefits calculated for high earners.
- Raise the retirement age for full retirement age (FRA) benefits to age 69 by 2030. The 1984 legislation raised the FRA to age 67 for those born in 1960 and later. People born in 1960 were 24 years old when they learned they would need to work longer for full Social Security benefits and gave them plenty of time to plan. The proposal to raise the FRA to 69 by 2030 would affect people who are currently 57 years old.
- Remove the earnings test for people between age 62 and FRA. Social Security benefits could begin at the reduced age 62 rate but a worker would not have to pay back benefits if they earned more than the current limit of $17,040. A worker between age 62 and FRA pays back $1 of Social Security benefits for each $2 earned above the current limit of $17,640.
- Use chained CPI-W rather than CPI-W in computing annual COLA adjustments. Using chained CPI-W would reduce the annual increases in Social Security benefits each year.
- Stop children’s Social Security benefits at age 15 rather than the current age 18. Lowering the age that children qualify for Social Security benefits would reduce the payments going out of the Social Security funds.
- Gradually increase the Social Security tax rate from its current 6.2% to 7.4% by the year 2042. An increase in the percentage of tax being withheld from workers’ pay would increase the revenues being collected for Social Security.
How chained CPI works
The chained CPI assumes that people alter what they put in their shopping baskets due to price changes. For example, when beef becomes more expensive, Americans tend to eat less beef and buy more chicken, which is cheaper.
According to the U.S. Bureau of Labor Statistics, chained CPI is designed to be a closer approximation to a cost-of-living index than other CPI measures. The bureau is the agency that currently calculates and reports the CPI each month. It does not endorse one inflation measure over another.
Using chained CPI, Social Security’s COLAs would reflect a lower inflation rate than the current CPI-W calculations.
Conclusion
With the availability of traditional pensions declining and the prospect of longer lifespans, uncertainty regarding Social Security benefits should be a motivating factor in encouraging Americans to begin and maintain a meaningful retirement plan; one that also includes adequate healthcare protection at all ages.
Knowledge check
- Which would be most likely to decrease the shortfalls in the Social Security and Medicare systems?
- Eliminate the taxable wage base.
- Lower the taxable wage base.
- Repeal the Medicare tax on unearned income.
- Permit pharmaceutical companies to charge Medicare enrollees full retail price for prescription drugs.
Summary
The OASDI program—which for most Americans means Social Security—is the largest income-maintenance program in the United States. The long-term future of Medicare and Social Security is uncertain, triggering concerns for the many workers who are now paying into the system. Ideas being explored as potential fixes to the problems include raising or eliminating the taxable wage base, raising the full retirement age, means testing, and more. Making changes to Social Security and Medicare appears to always be on the table as part of deficit reduction strategy proposals.
No doubt, the future of Social Security will continue to be a major political and social issue for the foreseeable future.