
Prioritize Technical Debt with Hotspots
A hotspot is complicated code that you have to work with often. Hotspots are calculated by combining the two metrics we’ve explored:
-
Calculating the change frequency of each file as a proxy for interest rate
-
Using the lines of code as a simple measure of code complexity
The simplest way is to write a script that iterates through our table of change frequencies and adds the lines-of-code measure to each entry. We can also visualize our data to gain a better overview of where our hotspots are.
Let’s look at an example from the online gallery,[17] where you see a visualization like the figure of a hotspot analysis on ASP.NET Core MVC. This codebase, from Microsoft, implements a model-view-controller (MVC) framework for building dynamic websites.[18]
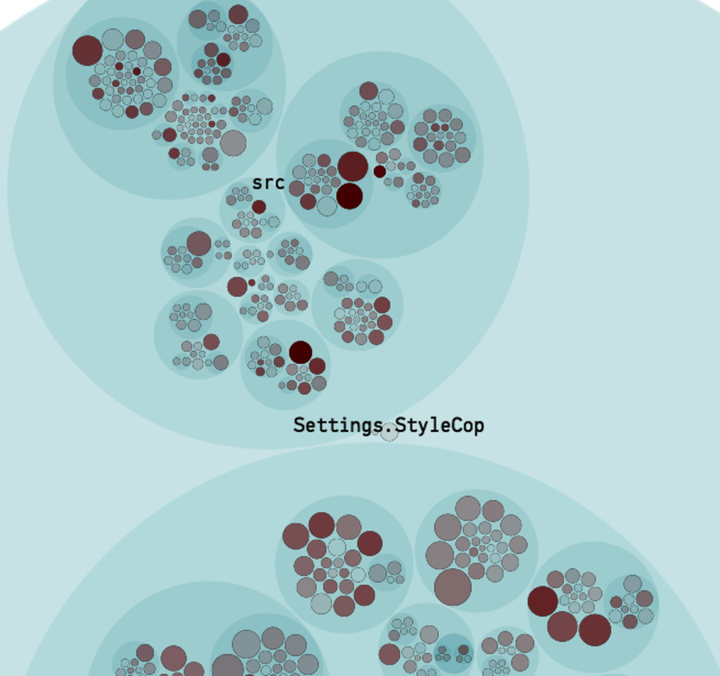
This type of visualization is called an enclosure diagram. (See Visualizations, for details on how to make your own.) We’ll use enclosure diagrams a lot in our visualizations since they scale well with the size of the codebase. Here’s how to interpret the visualization:
-
Hierarchical: The visualization follows the folder structure of your codebase. Look at the large blue circles in the figure. Each one of them represents a folder in your codebase. The nested blue circles inside represent subfolders.
-
Interactive: To work with large codebases the visualizations have to be interactive. This means you can zoom in on the code of interest. Click on one of the circles representing folders in the codebase to zoom in on its content.
When you zoom in on a package you’ll see that each file is represented as a circle. You’ll also note that the circles have different sizes and opacities. That’s because those dimensions are used to represent our hotspot criteria, as illustrated in the next figure.
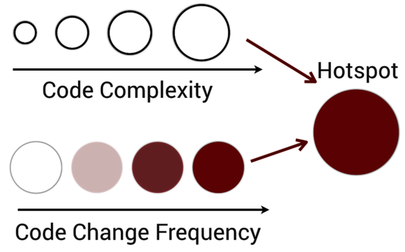
The deeper the red color, the more commits have been spent on that code. And the larger the circle, the more code in the file it represents.
The main benefit of enclosure diagrams is that they let us view the whole codebase at a glance. Even so, there are other options to visualize code. A popular alternative is tree maps. Tree maps are a hierarchical visualization that present a more compact view of large codebases. The next figure shows an example from Your Code as a Crime Scene [Tor15] where the hotspots are visualized as a tree map.
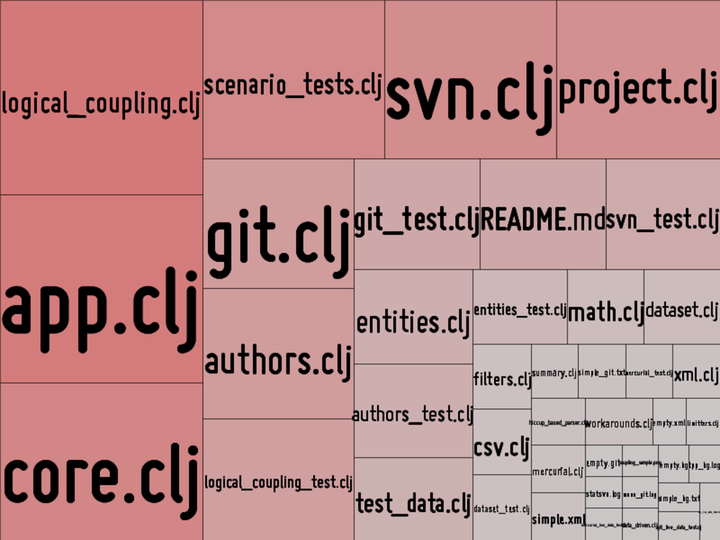
The JavaScript library D3 provides an easy way to experiment with tree maps.[19] Together with the cloc tool and the git log trick we saw earlier, you have all the data you need to visualize your hotspots.
No matter what visualization style you choose, you’re now ready to uncover hotspots with high interest rates.
Locate Your Top Hotspots
A hotspot analysis takes you beyond the current structure of the code by adding a time dimension that is fundamental to understanding large-scale systems. As we saw earlier, development activity is unevenly distributed in your codebase, which implies that not all code is equally important from a maintenance perspective. Consequently, just because some code is badly written or contains excess accidental complexity, that doesn’t mean it’s a problem. Low-quality code matters only when we need to work with it, perhaps to fix a bug or extend an existing feature—but then, of course, it becomes a true nightmare.
No, this is not intended to encourage bad code. The quality of your code is important—code is the medium for expressing your thoughts—but context is king. We talk about legacy code. Code is hard to get right; requirements change and situational forces have to be considered. That means every large codebase has its fair share of troubled modules. It’s futile to try to address all those quality problems at once because there’s only so much time we can spend on improvements, so we want to ensure we improve a part that actually matters.
The reason many well-known speakers and authors in the software industry obsess about keeping all code nice and clean is because we can’t know up front which category code will fall into. Will this particular code end up in the long tail that we rarely touch, or will we have to work with this piece of code on a regular basis? Hotspots help us make this distinction.
So let’s get specific by analyzing Microsoft’s ASP.NET Core MVC. It’s a .NET codebase, but the steps you learn apply to code written in any language. You can also follow along online with the interactive analysis results on the URL that we opened earlier.[20]
Prioritize Hotspots in ASP.NET Core MVC
ASP.NET Core MVC is a framework for building dynamic websites. It’s a midsize codebase with around 200,000 lines of code, most of it C#. In larger codebases we need a more structured approach, which we’ll discuss in Chapter 6, Spot Your System’s Tipping Point, but ASP.NET Core MVC is small enough that we can use a powerful heuristic—our visual system. Let’s have another look at our hotspot map, shown in the top figure.
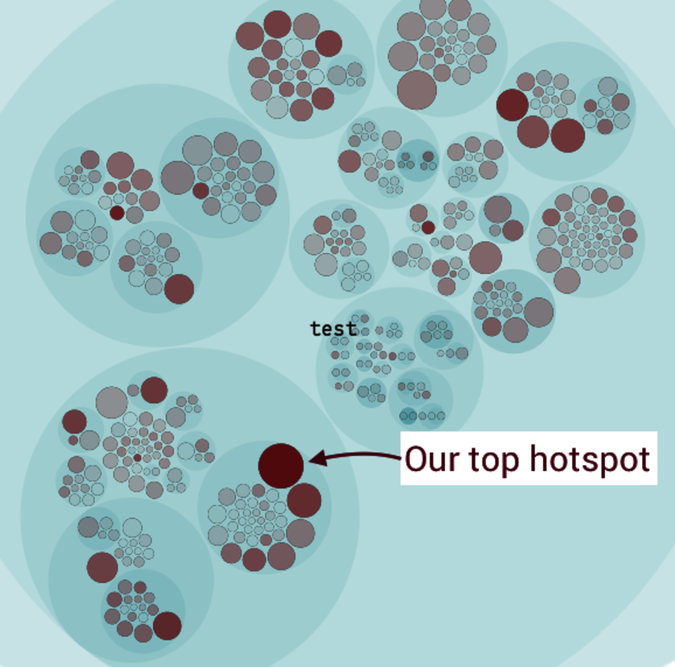
See the large red circle in the lower part of the figure? That’s our top hotspot. It’s code that’s likely to be complex, since there’s a lot if it, and the code changes at a high rate. Zoom in on that hotspot by clicking on it to inspect its details, as shown in the next figure.
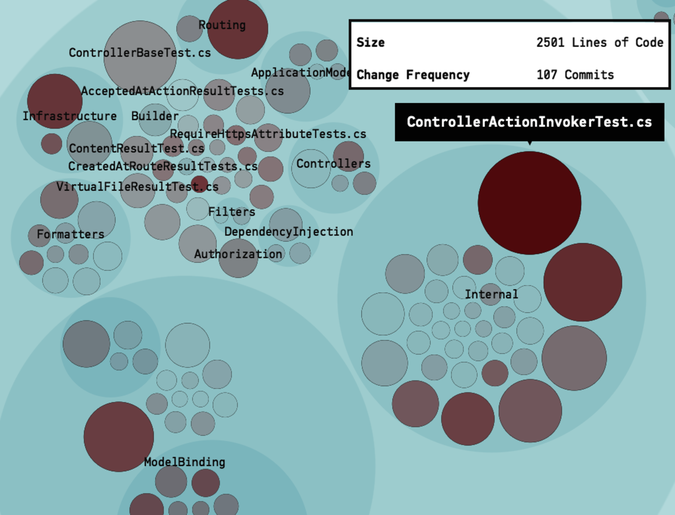
Our main suspect, the unit test ControllerActionInvokerTest.cs, contains around 2,500 lines of code. That’s quite a lot for any module, in particular for a unit test. Unit testing is often sold as a way to document behavior. That potential advantage is lost once a unit test climbs to thousands of lines of code. You also see that the developers of ASP.NET Core MVC have made more than 100 commits to that code.
This means that our hotspot, ControllerActionInvokerTest.cs, is a crucial module in terms of maintenance efforts. Based on this information let’s peek into that file and determine whether the code is a problem.
Use Hotspots to Improve, Not Judge | |
|---|---|
|
|
The fundamental attribution error is a principle from social psychology that describes our tendency to overestimate the influence of personality—such as competence and carefulness—as we explain the behavior of other people. The consequence is that we underestimate the power of the situation. It’s easy to critique code in retrospect. That’s fine as long as we remember that we don’t know the original context in which the code was developed. Code is often written under strong pressures of time constraints and changing requirements. And often that pressure exerted its force while the original developers tried to build an understanding of both the problem and the solution domain. As we inspect the code, perhaps months or years later, we should be careful to not judge the original programmers, but rather use the information we gather as a way forward. |