In this chapter we discuss the major tools used for memory analysis. We detail the methodology behind the use of the tools and the interpretation of the metrics.
Different tools are used for different kinds of memory analyses. Following is a prioritized list of tools for analyzing the various types of problems:
Quick memory health check. First measure the amount of free memory with the
vmstatcommand. Then examine thesrcolumn of thevmstatoutput to check whether the system is scanning. If the system is short of memory, you can obtain high-level usage details with the MDB::memstat-dcommand.Paging activity. If the system is scanning, use the
-poption ofvmstatto see the types of paging. You would typically expect to see file-related paging as a result of normal file system I/O. Significant paging in of executables or paging in and paging out of anonymous memory suggests that some performance is being lost.Attribution. Using DTrace examples like those in this chapter, show which processes or files are causing paging activity.
Time-based analysis. Estimate the impact of paging on system performance by drilling down with the
prstatcommand and then further with DTrace. Theprstatcommand estimates the amount of time stalled in data-fault waits (typically, anonymous memory/heap page-ins). The DTrace scripts shown in this chapter can measure the exact amount of time spent waiting for paging activity.Process memory usage. Use the
pmapcommand to inspect a process’s memory usage, including the amount of physical memory used and an approximation of the amount shared with other processes.MMU/page size performance issues. Behind the scenes as a secondary issue is the potential performance impact of TLB (Translation Lookaside Buffer) overflows; these can often be optimized through the use of large MMU pages. The
trapstatutility is ideal for quantifying these issues. We cover more on this advanced topic in the next chapter.
Table 6.1 summarizes and cross-references the tools covered in this chapter.
Table 6.1. Tools for Memory Analysis
Tool | Description | Reference |
|---|---|---|
DTrace | For drill-down on sources of paging and time-based analysis of performance impact. | 6.11 |
| For access to raw VM performance statistics with command line, C, or Perl to facilitate performance-monitoring scripts. | 6.4, 6.13, 6.14 |
MDB | For observing major categories of memory allocation. | 6.4 |
| For inspection of per-process memory use and facilitation of capacity planning. | 6.8 |
| For estimating potential performance impact by using microstates. | 6.6.1 |
| For investigating MMU-related performance impacts. | 6.17 |
| For determining free memory, scanning and paging rates and types. | 6.2, 6.4.2 |
The vmstat command summarizes the most significant memory statistics. Included are summaries of the system’s free memory, free swap, and paging rates for several classes of usage. Additionally, the -p option shows the paging activity, page-ins, page-outs, and page-frees separated into three classes: file system paging, anonymous memory paging, and executable/shared library paging. You typically use the -p option for a first-pass analysis of memory behavior.
The example below illustrates the vmstat command. Table 6.2 describes the columns. We discuss the definitions and significance of the paging statistics from vmstat in Section 6.18.
sol8$ vmstat -p 3
     memory          page          executable      anonymous      filesystem
   swap  free  re mf  fr  de  sr  epi  epo  epf  api  apo  apf  fpi  fpo  fpf
 2410424 516556 7 41   0   0   1    0    0    0    0    0    0  127  446    0
 2356376 472424 8  5   0   0   0    0    0    0    0    0    0   12  228    0
 2356376 472032 7  0   0   0   0    0    0    0    0    0    0    0   98    0
 2356376 471800 0  0   0   0   0    0    0    0    0    0    0    0    0    0
 2356376 471712 0  0   0   0   0    0    0    0    0    0    0    0    0    0
Table 6.2. Statistics from the vmstat Command
Counter | Description |
|---|---|
| Available swap space in Kbytes. |
| The amount of free memory as reported by |
| Page reclaims—The number of pages reclaimed from the cache list. Some of the file system cache is in the cache list, and when a file page is reused and removed from the cache list, a reclaim occurs. File pages in the cache list can be either regular files or executable/library pages. |
| Minor faults—The number of pages attached to an address space. If the page is already in memory, then a minor fault simply reestablishes the mapping to it; minor faults do not incur physical I/O. |
| Page-frees—Kilobytes that have been freed either by the page scanner or by the file system (free-behind). |
| The calculated anticipated short-term memory shortfall. Used by the page scanner to free ahead enough pages to satisfy requests. |
| The number of pages scanned by the page scanner per second. |
| Executable and library page-ins—Kilobytes of executable or shared library files paged in. An executable/library page-in occurs whenever a page for the executable binary or shared library is brought back in from the file system. |
| Kilobytes of executable and library page-outs. Should be zero, since executable pages are typically not modified, there is no reason to write them out. |
| Kilobytes of executable and library page-frees—Kilobytes of executable and library pages that have been freed by the page scanner. |
| Anonymous memory page-ins—Kilobytes of anonymous (application heap and stack) pages paged in from the swap device. |
| Anonymous memory page-outs—Kilobytes of anonymous (application heap and stack) pages paged out to the swap device. |
| Anonymous memory page-frees—Kilobytes of anonymous (application heap and stack) pages that have been freed after they have been paged out. |
| Regular file page-ins—Kilobytes of regular files paged in. A file page-in occurs whenever a page for a regular file is read in from the file system (part of the normal file system read process). |
| Regular file page-outs—Kilobytes of regular file pages that were paged out and freed, usually as a result of being paged out by the page scanner or by write free-behind (when free memory is less than |
| Regular file page-frees—Kilobytes of regular file pages that were freed, usually as a result of being paged out by the page scanner or by write free-behind (when free memory is less than |
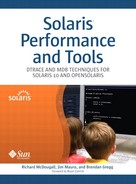
In this section, we quickly review the two major types of “paging”: file I/O paging and anonymous memory paging. Understanding them will help you interpret the system metrics and health. Figure 6.1 puts paging in the context of physical memory’s life cycle.
Traditional Solaris file systems (including UFS, VxFS, NFS, etc.) use the virtual memory system as the primary file cache (ZFS is an exception). We cover file systems caching in more detail in Section 14.8 in Solaris™ Internals.
File system I/O paging is the term we use for paging reads and writes files through file systems in their default cached mode. Files are read and written in multiples of page-size units to the I/O or to the network device backing the file system. Once a file page is read into memory, the virtual memory system caches that page so that subsequent file-level accesses don’t have to reread pages from the device. It’s normal to see a substantial amount of paging activity as a result of file I/O. Beginning with Solaris 8, a cyclic file system cache was introduced. The cyclic file system cache recirculates pages from the file system through a central pool known as the cache list, preventing the file system from putting excessive paging pressure on other users of memory within the system. This feature superseded the priority paging algorithms used in Solaris 7 and earlier to minimize these effects.
Paging can be divided into the following categories:
Reading files. File system reads that miss in the file cache are performed as virtual memory page-ins. A new page is taken off the free list, and an I/O is scheduled to fill the page from its backing store. Files read with the system call
read(2)are mapped into thesegmapcache and are eventually placed back onto the tail of the cache list. The cache list becomes an ordered list of file pages; the oldest cached pages (head of the cache list) are eventually recycled as file system I/O consumes new pages from the free list.Smaller I/Os typically exhibit a one-to-one ratio between file system cache misses and page-ins. In some cases, however, the file system will group reads or issue prefetch, resulting in larger or differing relationships between file I/O and paging.
Writing files. The process of writing a file also involves virtual memory operations—updated files are paged out to the backing I/O in multiples of page-size chunks. However, the reporting mechanism exhibits some oddities; for example, only page-outs that hint at discarding the page from cache show as file system page-outs in the
kstatandvmstatstatistics.Reading executables. The virtual memory system reads executables (program binaries) into memory upon
execand reads shared libraries into a process’s address space. These read operations are basically the same as regular file system reads; however, the virtual memory system marks and tracks them separately to make it easy to isolate program paging from file I/O paging.
Paging of executables is visible through vmstat statistics; executable page-ins, page-outs, and frees are shown in the epi, epo, and epf columns. File page-ins, page-outs, and frees are shown in the fpi, fpo, and fpf columns.
$ vmstat -p 3
     memory          page          executable      anonymous      filesystem
   swap  free re  mf  fr  de  sr  epi  epo  epf  api  apo  apf  fpi  fpo  fpf
 411696 12720 38 35473 15738 0 217112 20 0  848   13 14146 14331 23  377  559
 409356 35344 11 1823 9717 0 141771 104  0   22   96 9376 9389   62  295  306
 345264 26724 53 5234 2329 0 8727  28    0    0  263 2200 2200  103  217  129
 301104 48032 36 7313 8451 0 102271 76   0   75  167 8199 8241   15  157  135
Anonymous memory paging is the term we use when the virtual memory system migrates anonymous pages to the swap device because of a shortage of physical memory. Most often, this occurs when the sum of the process heaps, shared memory, and stacks exceeds the available physical memory, causing the page scanner to begin shifting out to the swap device those pages that haven’t recently been used. The next time the owning process references these pages, it incurs a data fault and must go to sleep while waiting for the pages to be brought back in from the swap device.
Anonymous paging is visible through the vmstat statistics; page-ins and page-outs are shown in the api and apo columns.
$ vmstat -p 3
     memory           page          executable      anonymous      filesystem
   swap  free  re  mf  fr  de  sr  epi  epo  epf  api  apo  apf  fpi  fpo  fpf
 411696 12720  38 35473 15738 0 217112 20 0  848   13 14146 14331 23  377  559
 409356 35344  11 1823 9717 0 141771 104  0   22   96 9376 9389   62  295  306
 345264 26724  53 5234 2329 0 8727  28    0    0  263 2200 2200  103  217  129
 301104 48032  36 7313 8451 0 102271 76   0   75  167 8199 8241   15  157  135
Although swap I/O is just another form of file system I/O, it is most often much slower than regular file I/O because of the random movement of memory to and from the swap device. Pages are collected and queued to the swap device in physical page order by the page scanner and are efficiently issued to the swap device (clustering allows up to 1-Mbyte I/Os). However, the owning process typically references the pages semi-sequentially in virtual memory order, resulting in random page-size I/O from the swap device. We know from simple I/O metrics that random 8-Kbyte I/O is likely to yield service times of around 5 milliseconds, significantly affecting performance.
The DTraceToolkit includes a command to display the vmstat statistics per-zone. It uses the zonename DTrace variable to summarize by zone.
# zvmstat 1
      ZONE   re    mf  fr  sr  epi  epo  epf  api  apo  apf   fpi  fpo  fpf
    global   54   316   1   0    0    0    0    0    0    0     0    1    1
 workzone1    0     0   0   0    0    0    0    0    0    0     0    0    0
      ZONE   re    mf  fr  sr  epi  epo  epf  api  apo  apf   fpi  fpo  fpf
    global  157   659   1   0   10    0    0    0    0    0     3    2    1
 workzone1  770  1085   0   0   48    0    0    0    0    0   928    0    0
      ZONE   re    mf  fr  sr  epi  epo  epf  api  apo  apf   fpi  fpo  fpf
    global   56   317   0   0    6    0    0    0    0    0     2    0    0
 workzone1 1478    21   0   0    0    0    0    0    0    0  1635    0    0
                                                                    See DTraceToolkit
You can use the standard Solaris tools to observe the total physical memory configured, memory used by the kernel, and the amount of “free” memory in the system.
From the output of the Solaris prtconf command, you can ascertain the amount of total physical memory.
# prtconf

System Configuration: Sun Microsystems i86pc
Memory size: 2048 Megabytes
System Peripherals (Software Nodes):
Use the vmstat command to measure free memory. The first line of output from vmstat is an average since boot, so the real free memory figure is available on the second line. The output is in kilobytes. In this example, observe the value of approximately 970 Mbytes of free memory.
# vmstat 3
 kthr      memory            page            disk          faults      cpu
 r b w   swap  free  re  mf pi po fr de sr cd cd f0 s0   in   sy   cs us sy id
 0 0 0 1512468 837776 160 20 12 12 12 0  0  0  1  0  0  589 3978  150  2  0 97
 54 0 0 1720376 995556 1 13 27   0  0 0  0 20 176 0  0 1144 4948 1580  1  2 97
 0 0 0 1720376 995552 6  65 21   0  0 0  0 22 160 0  0 1191 7099 2139  2  3 95
 0 0 0 1720376 995536 0   0 13   0  0 0  0 21 190 0  0 1218 6183 1869  1  3 96
The free memory reported by Solaris includes the cache list portion of the page cache, meaning that you can expect to see a larger free memory size when significant file caching is occurring.
In Solaris 8, free memory did not include pages that were available for use from the page cache, which had recently been added. After a system was booted, the page cache gradually grew and the reported free memory dropped, usually hovering around 8 megabytes. This led to some confusion because Solaris 8 reported low memory even though plenty of pages were available for reuse from the cache. Since Solaris 9, the free column of vmstat has included the cache list portion and as such is a much more useful measure of free memory.
You can use an mdb command to view the allocation of the physical memory into the buckets described in previous sections. The macro is included with Solaris 9 and later.
sol9# mdb -k
Loading modules: [ unix krtld genunix ip ufs_log logindmux ptm cpc sppp ipc random nfs ]
> ::memstat

Page Summary                Pages                MB   %Tot
------------     ----------------  ----------------   ----
Kernel                      53444               208    10%
Anon                       119088               465    23%
Exec and libs                2299                 8     0%
Page cache                  29185               114     6%
Free (cachelist)              347                 1     0%
Free (freelist)            317909              1241    61%

Total                      522272              2040
Physical                   512136              2000
The categories are described as follows:
Kernel. The total memory used for nonpageable kernel allocations. This is how much memory the kernel is using, excluding anonymous memory used for ancillaries (seeAnonin the next paragraph).Anon. The amount of anonymous memory. This includes user-process heap, stack, and copy-on-write pages, shared memory mappings, and small kernel ancillaries, such aslwpthread stacks, present on behalf of user processes.Exec and libs. The amount of memory used for mapped files interpreted as binaries or libraries. This is typically the sum of memory used for user binaries and shared libraries. Technically, this memory is part of the page cache, but it is page cache tagged as “executable” when a file is mapped withPROT_EXECand file permissions include execute permission.Page cache. The amount of unmapped page cache, that is, page cache not on the cache list. This category includes thesegmapportion of the page cache and any memory mapped files. If the applications on the system are solely using a read/write path, then we would expect the size of this bucket not to exceedsegmap_percent(defaults to 12% of physical memory size). Files in/tmpare also included in this category.Free (cachelist). The amount of page cache on the free list. The free list contains unmapped file pages and is typically where the majority of the file system cache resides. Expect to see a large cache list on a system that has large file sets and sufficient memory for file caching. Beginning with Solaris 8, the file system cycles its pages through the cache list, preventing it from stealing memory from other applications unless there is a true memory shortage.Free (freelist). The amount of memory that is actually free. This is memory that has no association with any file or process.
If you want this functionality for Solaris 8, copy the downloadable memory.so library into /usr/lib/mdb/kvm/sparcv9 and then use ::load memory before running ::memstat. (Note that this is not Sun-supported code, but it is considered low risk since it affects only the mdb user-level program.)
# wget http://www.solarisinternals.com/si/downloads/memory.so
# cp memory.so /usr/lib/mdb/kvm/sparcv9
# mdb -k
Loading modules: [ unix krtld genunix ip ufs_log logindmux ptm cpc sppp ipc random nfs ]
> ::load memory
> ::memstat
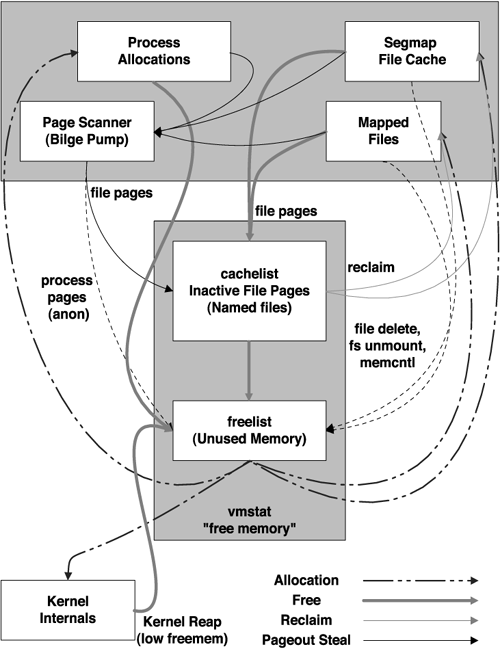
When available physical memory becomes exhausted, Solaris uses various mechanisms to relieve memory pressure: the cyclic page cache, the page scanner, and the original swapper. A summary is depicted in Figure 6.2.
The swapper swaps out entire threads, seriously degrading the performance of swapped-out applications. The page scanner selects pages, and is characterized by the scan rate (sr) from vmstat. Both use some form of the Not Recently Used algorithm.
The swapper and the page scanner are only used when appropriate. Since Solaris 8, the cyclic page cache, which maintains lists for a Least Recently Used selection, is preferred.
For more details on these mechanisms, see Chapter 10 in Solaris™ Internals. This section focuses on the tools used to observe performance, and Figure 6.2 is an appropriate summary for thinking in terms of tools.
To identify where on Figure 6.2 your system is, use the following tools.
free list. The size of the free list can be examined with
::memstatfrommdb-k, discussed in Section 6.4.3. A largefreecolumn invmstatincludes both free list and cache list.cache list. The size of the cache list can also be examined with
::memstat.page scanner. When the page scanner is active, the scan rate (
sr) field invmstatis non-zero. As the situation worsens, anonymous page-outs will occur and can be observed fromvmstat -pandiostat -xnPzfor the swap partition.swapper. For modern Solaris, it is rare that the swapper is needed. If it is used, the
kthr:wfield fromvmstatbecomes non-zero, to indicate swapped-out threads. This information is also available fromsar -q.vmstat -Scan also show swap-ins and swap-outs, as cansar -w.hard swapping. Try typing
echo hardswap/D | mdb -k, to print a counter that is incremented because of hard swapping. If you are unable to type it in because the system is woefully slow, then you can guess that it is hard swapping anyway. A system that is hard swapping is barely usable. All other alarm bells should also have been triggered by this point (scan rate, heavy anonymous page-outs, swapped-out threads).
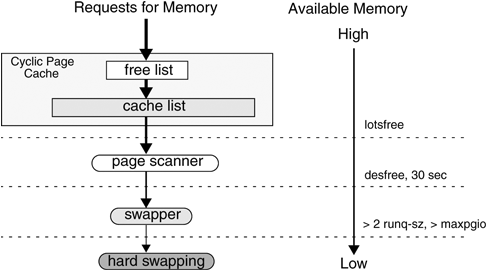
Solaris uses a central physical memory manager to reclaim memory from various subsystems when there is a shortage. A single daemon performs serves this purpose: the page scanner. The page scanner returns memory to the free list when the amount of free memory falls below a preset level, represented by a preconfigured tunable parameter, lotsfree. Knowing the basics about the page scanner will help you understand and interpret the memory health and performance statistics.
The scanner starts scanning when free memory is lower than lotsfree number of pages free plus a small buffer factor, deficit. The scanner starts scanning at a rate of slowscan pages per second at this point and gets faster as the amount of free memory approaches zero. The system parameter lotsfree is calculated at startup as 1/64th of memory, and the parameter deficit is either zero or a small number of pages—set by the page allocator at times of large memory allocation to let the scanner free a few more pages above lotsfree in anticipation of more memory requests.
Figure 6.3 shows that the rate at which the scanner scans increases linearly as free memory ranges between lotsfree and zero. The scanner starts scanning at the minimum rate set by slowscan when memory falls below lotsfree and then increases to fastscan if memory falls low enough.
The page scanner and its metrics are an important indicator of memory health. If the page scanner is running, there is likely a memory shortage. This is an interesting departure from the behavior you might have been accustomed to on Solaris 7 and earlier, where the page scanner was always running. Since Solaris 8, the file system cache resides on the cache list, which is part of the global free memory count. Thus, if a significant amount of memory is available, even if it’s being used as a file system cache, the page scanner won’t be running.
The most important metric is the scan rate, which indicates whether the page scanner is running. The scanner starts scanning at an initial rate (slowscan) when freemem falls down to the configured watermark—lotsfree—and then runs faster as free memory gets lower, up to a maximum (fastscan).
You can perform a quick and simple health check by determining whether there is a significant memory shortage. To do this, use vmstat to look at scanning activity and check to see if there is sufficient free memory on the system.
Let’s first look at a healthy system. This system is showing 970 Mbytes of free memory in the free column and a scan rate (sr) of zero.
$ vmstat -p 3
     memory           page          executable      anonymous      filesystem
   swap  free  re  mf  fr  de  sr  epi  epo  epf  api  apo  apf  fpi  fpo  fpf
 1512488 837792 160 20 12   0   0    0    0    0    0    0    0   12   12   12
 1715812 985116 7  82   0   0   0    0    0    0    0    0    0   45    0    0
 1715784 983984 0   2   0   0   0    0    0    0    0    0    0   53    0    0
 1715780 987644 0   0   0   0   0    0    0    0    0    0    0   33    0    0
Looking at a second case, we can see two of the key indicators showing a memory shortage—both high scan rates (sr > 50000 in this case) and very low free memory (free < 10 Mbytes).
$ vmstat -p 3
     memory           page          executable      anonymous      filesystem
   swap  free  re  mf  fr  de  sr  epi  epo  epf  api  apo  apf  fpi  fpo  fpf
 2276000 1589424 2128 19969 1 0 0    0    0    0    0    0    0    0    1    1
 1087652 388768 12 129675 13879 0 85590 0 0   12    0 3238 3238   10 9391 10630
 608036 51464  20 8853 37303 0 65871 38   0  781   12 19934 19930 95 16548 16591
  94448  8000  17 23674 30169 0 238522 16 0  810   23 28739 28804 56  547  556
Given that the page scanner runs only when the free list and cache list are effectively depleted, then any scanning activity is our first sign of memory shortage. Drilling down further with ::memstat (see Section 6.4) shows us where the major allocations are. It’s useful to check that the kernel hasn’t grown unnecessarily large.
Using the microstate measurement option in prstat, you can observe the percentage of execution time spent in data faults. The microstates show 100% of the execution time of a thread broken down into eight categories; the DFL column shows the percentage of time spent waiting for data faults to be serviced. The following example shows a severe memory shortage. The system was running short of memory, and each thread in filebench is waiting for memory approximately 90% of the time.
$ prstat -mL
   PID USERNAME USR SYS TRP TFL DFL LCK SLP LAT VCX ICX SCL SIG PROCESS/LWPID
 15625 rmc      0.1 0.7 0.0 0.0  95 0.0 0.9 3.2  1K 726  88   0 filebench/2
 15652 rmc      0.1 0.7 0.0 0.0  94 0.0 1.8 3.6  1K  1K  10   0 filebench/2
 15635 rmc      0.1 0.7 0.0 0.0  96 0.0 0.5 3.2  1K  1K   8   0 filebench/2
 15626 rmc      0.1 0.6 0.0 0.0  95 0.0 1.4 2.6  1K 813  10   0 filebench/2
 15712 rmc      0.1 0.5 0.0 0.0  47 0.0  49 3.8  1K 831 104   0 filebench/2
 15628 rmc      0.1 0.5 0.0 0.0  96 0.0 0.0 3.1  1K 735   4   0 filebench/2
 15725 rmc      0.0 0.4 0.0 0.0  92 0.0 1.7 5.7 996 736   8   0 filebench/2
 15719 rmc      0.0 0.4 0.0 0.0  40  40  17 2.9  1K 708 107   0 filebench/2
 15614 rmc      0.0 0.3 0.0 0.0  92 0.0 4.7 2.4 874 576  40   0 filebench/2
 15748 rmc      0.0 0.3 0.0 0.0  94 0.0 0.0 5.5 868 646   8   0 filebench/2
 15674 rmc      0.0 0.3 0.0 0.0  86 0.0 9.7 3.2 888 571  62   0 filebench/2
 15666 rmc      0.0 0.3 0.0 0.0  29  46  23 2.1 689 502 107   0 filebench/2
 15682 rmc      0.0 0.2 0.0 0.0  24  43  31 1.9 660 450 107   0 filebench/2
A process’s memory consumption can be categorized into two major groups: virtual size and resident set size. The virtual size is the total amount of virtual memory used by a process, or more specifically, the sum of the virtual size of the individual mappings constituting its address space. Some or all of a process’s virtual memory is backed by physical memory; we refer to that amount as a process’s resident set size (RSS).
The basic tools such as ps and prstat show both the process’s total virtual size and resident set size (RSS). Take the RSS figure with a grain of salt, since a substantial portion of a process’s RSS is shared with other processes in the system.
$ ps -eo pid,vsz,rss,args
  PID  VSZ  RSS COMMAND
11896 1040  736 ps -eo pid, vsz, rss, args
11892 1032  768 sh
 3603 1032  768 sh
 2695 1896 1432 telnet donan
 2693 1920 1456 telnet donan
 2433 1920 1440 telnet firefly
 3143 1920 1456 telnet devnull
 2429 1920 1440 telnet firefly.eng
 2134 1920 1440 telnet devnull
You can use the pmap command to show the individual memory mappings that make up a process’s address space. You can also use pmap to see the total amount of physical memory used by a process (its RSS) and to gather more information about how a process uses its memory. Since processes share some memory with others through the use of shared libraries and other shared memory mappings, you could overestimate system-wide memory usage by counting the same shared pages multiple times. To help with this situation, consider the amount of nonshared anonymous memory allocated as an estimation of a process’s private memory usage, (shown in the Anon column). We cover more on this topic in Section 6.7.
sol9$ pmap -x 102908
102908:   sh
Address   Kbytes Resident   Anon  Locked Mode   Mapped File
00010000      88      88       -       - r-x--  sh
00036000       8       8       8       - rwx--  sh
00038000      16      16      16       - rwx--    [ heap ]
FF260000      16      16       -       - r-x--  en_.so.2
FF272000      16      16       -       - rwx--  en_US.so.2
FF280000     664     624       -       - r-x--  libc.so.1
FF336000      32      32       8       - rwx--  libc.so.1
FF360000      16      16       -       - r-x--  libc_psr.so.1
FF380000      24      24       -       - r-x--  libgen.so.1
FF396000       8       8       -       - rwx--  libgen.so.1
FF3A0000       8       8       -       - r-x--  libdl.so.1
FF3B0000       8       8       8       - rwx--    [  anon ]
FF3C0000     152     152       -       - r-x--  ld.so.1
FF3F6000       8       8       8       - rwx--  ld.so.1
FFBFE000       8       8       8       - rw---    [ stack ]
--------   -----   -----   -----   ------
total Kb    1072    1032      56       -
Recall that the memory use of a process can be categorized into two classes: its virtual memory usage and its physical memory usage (referred to as its resident set size, or RSS). The virtual memory size is the amount of virtual address space that has been allocated to the process, and the physical memory is the amount of real memory pages that has been allocated to a process. You use the ps command to display a process’s virtual and physical memory usage.
$ ps -eo pid,vsz,rss,args
  PID  VSZ  RSS COMMAND
11896 1040  736 ps -eo pid,vsz,rss,args
11892 1032  768 sh
 3603 1032  768 sh
 2695 1896 1432 telnet donan
 2693 1920 1456 telnet donan
 2433 1920 1440 telnet firefly
 3143 1920 1456 telnet devnull
 2429 1920 1440 telnet firefly.eng
 2134 1920 1440 telnet devnull
From the ps example, you see that the /bin/sh shell uses 1032 Kbytes of virtual memory, 768 Kbytes of which have been allocated from physical memory, and that two shells are running. ps reports that both shells are using 768 Kbytes of memory each, but in fact, because each shell uses dynamic shared libraries, the total amount of physical memory used by both shells is much less than 768K × 2.
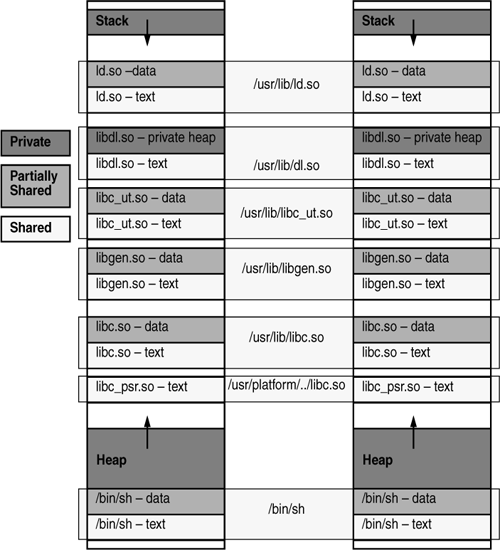
To ascertain how much memory is really being used by both shells, look more closely at the address space within each process. Figure 6.4 shows how the two shells share both the /bin/sh binary and their shared libraries. The figure shows each mapping of memory within the shell’s address space. We’ve separated the memory use into three categories:
Private. Memory that is mapped into each process and that is not shared by any other processes.
Shared. Memory that is shared with all other processes on the system, including read-only portions of the binary and libraries, otherwise known as the “text” mappings.
Partially shared. A mapping that is partly shared with other processes. The data mappings of the binary and libraries are shared in this way because they are shared but writable and within each process are private copies of pages that have been modified. For example, the
/bin/shdata mapping is mapped shared between all instances of/bin/shbut is mapped read/write because it contains initialized variables that may be updated during execution of the process. Variable updates must be kept private to the process, so a private page is created by a “copy on write” operation. (See Section 9.5.2 in Solaris™ Internals for further information.)
The pmap command displays every mapping within the process’s address space, so you can inspect a process and estimate shared and private memory usage. The amount of resident, nonshared anonymous, and locked memory is shown for each mapping.
sol9$ pmap -x 102908
102908:   sh
Address   Kbytes Resident   Anon  Locked Mode   Mapped File
00010000      88      88       -       - r-x--  sh
00036000       8       8       8       - rwx--  sh
00038000      16      16      16       - rwx--    [ heap ]
FF260000      16      16       -       - r-x--  en_.so.2
FF272000      16      16       -       - rwx--  en_US.so.2
FF280000     664     624       -       - r-x--  libc.so.1
FF336000      32      32       8       - rwx--  libc.so.1
FF360000      16      16       -       - r-x--  libc_psr.so.1
FF380000      24      24       -       - r-x--  libgen.so.1
FF396000       8       8       -       - rwx--  libgen.so.1
FF3A0000       8       8       -       - r-x--  libdl.so.1
FF3B0000       8       8       8       - rwx--    [ anon ]
FF3C0000     152     152       -       - r-x--  ld.so.1
FF3F6000       8       8       8       - rwx--  ld.so.1
FFBFE000       8       8       8       - rw---    [ stack ]
--------   -----   -----   -----   ------
total Kb    1072    1032      56       -
The example output from pmap shows the memory map of the /bin/sh command. At the top of the output are the executable text and data mappings. All the executable binary is shared with other processes because it is mapped read-only into each process. A small portion of the data mapping is shared; some is private because of copy-on-write (COW) operations.
You can estimate the amount of incremental memory used by each additional instance of a process by using the resident and anonymous memory counts of each mapping. In the above example, the Bourne shell has a resident memory size of 1032 Kbytes. However, a large amount of the physical memory used by the shell is shared with other instances of the shell. Another identical instance of the shell will share physical memory with the other shell where possible and will allocate anonymous memory for any nonshared portion. In the above example, each additional Bourne shell uses approximately 56 Kbytes of additional physical memory.
A more complex example shows the output format for a process containing different mapping types. In this example, the mappings are as follows:
0001000. Executable text, mapped frommapsprogram0002000. Executable data, mapped frommapsprogram0002200. Program heap0300000. A mapped file, mappedMAP_SHARED0400000. A mapped file, mappedMAP_PRIVATE0500000. A mapped file, mappedMAP_PRIVATE|MAP_NORESERVE0600000. Anonymous memory, created by mapping/dev/zero0700000. Anonymous memory, created by mapping/dev/zerowithMAP_NORESERVE0800000. A DISM shared memory mapping, created withSHM_PAGEABLE, with 8 Mbytes locked bymlock(2)0900000. A DISM shared memory mapping, created withSHM_PAGEABLE, with 4 Mbytes of its pages touched0A00000. A ISM shared memory mapping, created withSHM_PAGEABLE, with all of its pages touched0B00000. An ISM shared memory mapping, created withSHM_SHARE_MMU
sol9$ pmap -x 15492
15492:  ./maps
 Address  Kbytes     RSS    Anon  Locked Mode   Mapped File
00010000       8       8       -       - r-x--  maps
00020000       8       8       8       - rwx--  maps
00022000   20344   16248   16248       - rwx--    [ heap ]
03000000    1024    1024       -       - rw-s-  dev:0,2 ino:4628487
04000000    1024    1024     512       - rw---  dev:0,2 ino:4628487
05000000    1024    1024     512       - rw--R  dev:0,2 ino:4628487
06000000    1024    1024    1024       - rw---    [ anon ]
07000000     512     512     512       - rw--R    [ anon ]
08000000    8192    8192       -    8192 rwxs-    [ dism shmid=0x5]
09000000    8192    4096       -       - rwxs-    [ dism shmid=0x4]
0A000000    8192    8192       -    8192 rwxsR    [ ism shmid=0x2 ]
0B000000    8192    8192       -    8192 rwxsR    [ ism shmid=0x3 ]
FF280000     680     672       -       - r-x--  libc.so.1
FF33A000      32      32      32       - rwx--  libc.so.1
FF390000       8       8       -       - r-x--  libc_psr.so.1
FF3A0000       8       8       -       - r-x--  libdl.so.1
FF3B0000       8       8       8       - rwx--    [ anon ]
FF3C0000     152     152       -       - r-x--  ld.so.1
FF3F6000       8       8       8       - rwx--  ld.so.1
FFBFA000      24      24      24       - rwx--    [ stack ]
-------- ------- ------- ------- -------
total Kb   50464   42264   18888   16384
You use the -s option to display the hardware translation page sizes for each portion of the address space. (See Chapter 13 in Solaris™ Internals for further information on Solaris support for multiple page sizes.) In the example below, you can see that the majority of the mappings use an 8-Kbyte page size and that the heap uses a 4-Mbyte page size. Notice that noncontiguous regions of resident pages of the same page size are reported as separate mappings. In the example below, the libc.so library is reported as separate mappings, since only some of the libc.so text is resident.
example$ pmap -xs 15492
15492:  ./maps
 Address  Kbytes     RSS    Anon  Locked Pgsz Mode   Mapped File
00010000       8       8       -       -   8K r-x--  maps
00020000       8       8       8       -   8K rwx--  maps
00022000    3960    3960    3960       -   8K rwx--    [ heap ]
00400000    8192    8192    8192       -   4M rwx--    [ heap ]
00C00000    4096       -       -       -    - rwx--    [ heap ]
01000000    4096    4096    4096       -   4M rwx--    [ heap ]
03000000    1024    1024       -       -   8K rw-s-  dev:0,2 ino:4628487
04000000     512     512     512       -   8K rw---  dev:0,2 ino:4628487
04080000     512     512       -       -    - rw---  dev:0,2 ino:4628487
05000000     512     512     512       -   8K rw--R  dev:0,2 ino:4628487
05080000     512     512       -       -    - rw--R  dev:0,2 ino:4628487
06000000    1024    1024    1024       -   8K rw---    [ anon ]
07000000     512     512     512       -   8K rw--R    [ anon ]
08000000    8192    8192       -    8192    - rwxs-    [ dism shmid=0x5 ]
09000000    4096    4096       -       -   8K rwxs-    [ dism shmid=0x4 ]
0A000000    4096       -       -       -    - rwxs-    [ dism shmid=0x2 ]
0B000000    8192    8192       -    8192   4M rwxsR    [ ism shmid=0x3 ]
FF280000     136     136       -       -   8K r-x--  libc.so.1
FF2A2000     120     120       -       -    - r-x--  libc.so.1
FF2C0000     128     128       -       -   8K r-x--  libc.so.1
FF2E0000     200     200       -       -    - r-x--  libc.so.1
FF312000      48      48       -       -   8K r-x--  libc.so.1
FF31E000      48      40       -       -    - r-x--  libc.so.1
FF33A000      32      32      32       -   8K rwx--  libc.so.1
FF390000       8       8       -       -   8K r-x--  libc_psr.so.1
FF3A0000       8       8       -       -   8K r-x--  libdl.so.1
FF3B0000       8       8       8       -   8K rwx--    [ anon ]
FF3C0000     152     152       -       -   8K r-x--  ld.so.1
FF3F6000       8       8       8       -   8K rwx--  ld.so.1
FFBFA000      24      24      24       -   8K rwx--    [ stack ]
-------- ------- ------- ------- -------
total Kb   50464   42264   18888   16384
With the DTrace utility, you can probe more deeply into the sources of activity observed with higher-level memory analysis tools. For example, if you determine that a significant amount of paging activity is due to a memory shortage, you can determine which process is initiating the paging activity. In another example, if you see a significant amount of paging due to file activity, you can drill down to see which process and which file are responsible.
DTrace allows for memory analysis through a vminfo provider, and, optionally, through deeper tracing of virtual memory paging with the fbt provider.
The vminfo provider probes correspond to the fields in the “vm” named kstat. A probe provided by vminfo fires immediately before the corresponding vm value is incremented. Section 10.6.2 lists the probes available from the vm provider; these are further described in Section 10.6.2. A probe takes the following arguments:
arg0. The value by which the statistic is to be incremented. For most probes, this argument is always 1, but for some it may take other values; these probes are noted in Section 10.4.arg1. A pointer to the current value of the statistic to be incremented. This value is a 64-bit quantity that is incremented by the value inarg0. Dereferencing this pointer allows consumers to determine the current count of the statistic corresponding to the probe.
For example, if you should see the following paging activity with vmstat, indicating page-in from the swap device, you could drill down to investigate.
# vmstat -p 3
     memory           page          executable       anonymous      filesystem
   swap  free  re  mf  fr  de  sr  epi  epo  epf   api  apo  apf  fpi  fpo  fpf
 1512488 837792 160 20 12   0   0    0    0    0  8102    0    0   12   12   12
 1715812 985116 7  82   0   0   0    0    0    0  7501    0    0   45    0    0
 1715784 983984 0   2   0   0   0    0    0    0  1231    0    0   53    0    0
 1715780 987644 0   0   0   0   0    0    0    0  2451    0    0   33    0    0

$ dtrace  -n  anonpgin'{@[execname]  =  count()}'
dtrace:  description  'anonpgin' matched  1  probe
  svc.startd                                                        1
  sshd                                                              2
  ssh                                                               3
  dtrace                                                            6
  vmstat                                                           28
  filebench                                                       913
See Section 6.11.1 for examples of how to use dtrace for memory analysis and Section 10.6.2.
You can use DTrace to directly measure elapsed time around the page-in probes when a process is waiting for page-in from the swap device, as in this example.
#!/usr/sbin/dtrace -s
#pragma D option quiet

dtrace:::BEGIN
{
        trace("Tracing... Hit Ctrl-C to end.
");
}

sched:::on-cpu
{
        self->on = vtimestamp;
}
sched:::off-cpu
/self->on/
{
        @oncpu[execname] = sum(vtimestamp - self->on);
        self->on = 0;
}
vminfo:::anonpgin
{
        self->anonpgin = 1;
}
fbt::pageio_setup:return
{
        self->wait = timestamp;
}
fbt::pageio_done:entry
/self->anonpgin == 1/
{
        self->anonpgin = 0;
        @pageintime[execname] = sum(timestamp - self->wait);
        eslf->wait = 0;
}
dtrace:::END
{
        normalize(@oncpu, 1000000);
        printf("Who's on cpu (milliseconds):
");
        printa(" %-50s %15@d
", @oncpu);

        normalize(@pageintime, 1000000);
        printf("Who's waiting for pagein (milliseconds):
");
        printa(" %-50s %15@d
", @pageintime);
}
With an aggregation by execname, you can see who is being held up by paging the most.
# ./whospaging.d
Tracing... Hit Ctrl-C to end.
^C
Who's on cpu (milliseconds):
  svc.startd                                                 1
  loop.sh                                                    2
  sshd                                                       2
  ssh                                                        3
  dtrace                                                     6
  vmstat                                                    28
  pageout                                                   60
  fsflush                                                  120
  filebench                                                913
  sched                                                  84562
Who's waiting for pagein (milliseconds):
  filebench                                             230704
In the output of whospaging.d, the filebench command spent 913 milliseconds on CPU (doing useful work) and 230.7 seconds waiting for anonymous page-ins.
Table 6.3 shows the system memory statistics that are available through kstats. These are a superset of the raw statistics used behind the vmstat command. Each statistic can be accessed with the kstat command or accessed programmatically through C or Perl.
Table 6.3. Memory-Related Kstats
Module | Class | Name | Description |
|---|---|---|---|
|
|
| Systemwide page count summaries |
|
|
| File system mapping statistics |
|
|
| Anonymous and memory mapped file statistics |
|
|
| SPARC |
|
|
| Systemwide paging statistics |
The kstat command shows the metrics available for each named group; invoke the command with the -n option and the kstat name, as in Table 6.3. Metrics that reference quantities in page sizes must also take into account the system’s base page size. Below is an example.
$ kstat -n system_pages
module: unix                      instance: 0
name:   system_pages              class:    pages
        availrmem                 343567
        crtime                    0
        desfree                   4001
        desscan                   25
        econtig                   4278190080
        fastscan                  256068
        freemem                   248309
        kernelbase                3556769792
        lotsfree                  8002
        minfree                   2000
        nalloc                    11957763
        nalloc_calls              9981
        nfree                     11856636
        nfree_calls               6689
        nscan                     0
        pagesfree                 248309
        pageslocked               168569
        pagestotal                512136
        physmem                   522272
        pp_kernel                 64102
        slowscan                  100
        snaptime                  6573953.83957897
$ pagesize
4096
You can also obtain kstat statistics through the Perl kstat API. With that approach, you can write simple scripts to collect the statistics. For example, below we display statistics for Section 6.4.2 quite easily by using the system_pages statistics.
%{$now} = %{$kstats->{0}{system_pages}};
print "$now->{pagesfree}
";
Using a more elaborate script, we read the values for physmem, pp_kernel, and pagesfree and report them at regular intervals.
$ wget http://www.solarisinternals.com/si/downloads/prtmem.pl
$ prtmem.pl 10
prtmem started on 04/01/2005 15:46:13 on d-mpk12-65-100, sample interval 5 seconds

                   Total      Kernel       Delta        Free       Delta
15:46:18            2040         250           0         972         -12
15:46:23            2040         250           0         968          -3
15:46:28            2040         250           0         968           0
15:46:33            2040         250           0         970           1
...
Use the kstat command to view system memory allocation kstats, as shown below. Table 6.4 describes each statistic.
$ kstat -n system_pages
module: unix                        instance: 0
name:   system_pages                class:    pages
        availrmem                   97303
        crtime                      0
        desfree                     1007
        desscan                     25
        econtig                     4275789824
        fastscan                    64455
        freemem                     16780
        kernelbase                  3556769792
        lotsfree                    2014
        minfree                     503
        nalloc                      1682534446
        nalloc_calls                298799
        nfree                       1681653744
        nfree_calls                 295152
        nscan                       0
        pagesfree                   16780
        pageslocked                 31607
        pagestotal                  128910
        physmem                     128910
        pp_kernel                   32999
        slowscan                    100
        snaptime                    2415909.89921839
Table 6.4. Memory Allocation Kstats with unix::system_pages
Description | Units | Reference | |
|---|---|---|---|
| The amount of unlocked pageable memory available for memory allocation. | Pages | 9.8[a] |
| If free memory falls below | Pages | 10.3[a] |
| Scan rate target for the page scanner. | Pages/s | 10.3[a] |
| Address of first block of contiguous kernel memory. | Bytes | |
| The rate of pages scanned per second when free memory = | Pages/s | 10.3[a] |
| System free list size. | Pages | 6.4.2 |
| Starting address of kernel mapping. | Bytes | |
| If free memory falls below | Pages | 10.3[a] |
| If free memory falls below | Pages | 10.3[a] |
| Kernel memory allocator allocations. | Integer | |
| Kernel memory allocator calls to | Integer | |
| Kernel memory allocator frees. | Integer | |
| Kernel memory allocator calls to | Integer |
|
| Number of pages scanned by the page scanner at last wake-up. | Pages | 10.3[a] |
| System free list size. | Pages | 6.4.2 |
| Total number of pages locked into memory by the kernel and user processes. | Pages | |
| Total number of pages available to the system after kernel metamanagement memory. | Pages | |
| Total number of physical pages in the system at boot. | Pages | |
| Total number of pages used by the kernel. | Pages | |
| The rate of pages scanned per second when free memory = | Pages/s | 10.3[a] |
[a] a. Solaris™ Internals, Second Edition | |||
You can determine the amount of kernel memory by using the Solaris kstat command and multiplying the pp_kernel by the system’s base page size. The computed output is in bytes; in this example, the kernel is using approximately 250 Mbytes of memory.
$ kstat unix::system_pages:pp_kernel
module: unix                            instance: 0
name:   system_pages                    class:    pages
        pp_kernel                       64102
$ pagesize
4096
$ bc
64102*4096
262561792
A general rule is that you would expect the kernel to use approximately 15% of the system’s total physical memory. We’ve seen this to be true in more than 90% of observed situations. Exceptions to the rule are cases, such as an in-kernel Web server cache, in which the majority of the workload is kernel based. Investigate further if you see large kernel memory sizes.
Use the kstat command to see the system paging kstats. Table 6.5 describes each statistic.
$ kstat -n vm
module: cpu                     instance: 0
name:   vm                      class:    misc
        anonfree                485085
        anonpgin                376728
        anonpgout               343517
        as_fault                5676333
...
Table 6.5. Memory Allocation Kstats from cpu::vm
Statistic | Description | Units |
|---|---|---|
| Anonymous memory page-frees—pages of anonymous (application heap and stack) pages that have been freed after they have been paged out. | Pages |
| Anonymous memory page-ins—pages of anonymous (application heap and stack) pages paged in from the swap device. | Pages |
| Anonymous memory page-outs—pages of anonymous (application heap and stack) pages paged out to the swap device. | Pages |
| Faults taken within an address space. | Pages |
| Copy-on-write faults | Pages |
| Pages of executable and library page-frees—pages of executable and library pages that have been freed. | Pages |
| Executable and library page-ins—pages of executable or shared library files paged in. An executable/library page-in occurs whenever a page for the executable binary or shared library is brought back in from the file system. | Pages |
| Pages of executable and library page-outs. Should be zero. | Pages |
| Regular file page-frees—pages of regular file pages that were freed, usually as a result of being paged out by the page scanner or by write free-behind (when free memory is less than | Pages |
Regular file page-ins—pages of regular files paged in. A file page-in occurs whenever a page for a regular file is read in from the file system (part of the normal file system read process). | Pages | |
| Regular file page-outs—pages of regular file pages that were paged out and freed, usually as a result of being paged out by the page scanner or by write free-behind (when free memory is less than | Pages |
| Minor faults—The number of pages attached to an address space. If the page is already in memory, then a minor fault simply reestablishes the mapping to it; minor faults do not incur physical I/O. | Pages |
| Translation faults in the kernel address space. | Pages |
| Major faults—the number of faults requiring memory allocation or disk I/O. | Pages |
| Page reclaims—The number of pages reclaimed from the free list. Some of the file system cache is in the free list; when a file page is reused and removed from the free list, a reclaim occurs. File pages in the free list can be either regular files or executable/library pages. | Pages |
| Total number of page-ins. | Events |
| Total number of pages paged in. | Pages |
| Total number of page-outs. | Events |
| Total number of pages paged out. | Pages |
| Page reclaims from the free list, plus reclaims due to page outs | Pages |
| The number of times the pager was run. | Events |
| The number of pages swapped in. | Pages |
| The number of pages swapped out. | Pages |
| The number of protection faults. | Pages |
| Total number of swap-ins. | Events |
| Total number of swap-outs. | Events |
| Number of pages allocated by zero-fill-on-demand. | Pages |
The trapstat command provides information about processor exceptions on UltraSPARC platforms. Since Translation Lookaside Buffer (TLB) misses are serviced in software on UltraSPARC microprocessors, trapstat can also provide statistics about TLB misses.
With the trapstat command, you can observe the number of TLB misses and the amount of time spent servicing TLB misses by using the -t and -T options. Also with trapstat, you can use the amount of time servicing TLB misses to approximate the potential gains you could make by using a larger page size or by moving to a platform that uses a microprocessor with a larger TLB.
The -t option provides first-level summary statistics. The time spent servicing TLB misses is summarized in the lower-right corner; in the following example, 46.2% of the total execution time is spent servicing misses—a significant portion of CPU time.
sol9# trapstat -t 1 111
cpu m| itlb-miss  %tim itsb-miss %tim | dtlb-miss %tim dtsb-miss %tim |%tim
-----+--------------------------------+-------------------------------+----
  0 u|         1   0.0         0  0.0 |   2171237 45.7         0  0.0 |45.7
  0 k|         2   0.0         0  0.0 |      3751  0.1         7  0.0 | 0.1
=====+================================+===============================+====
 ttl |         3   0.0         0  0.0 |   2192238 46.2         7  0.0 |46.2
Miss detail is provided for TLB misses in both the instruction (itlb-miss) and data (dtlb-miss) portion of the address space. Data is also provided for user-mode (u) and kernel-mode (k) misses (the user-mode misses are of most interest since applications are likely to run in user mode).
The -T option breaks down each page size.
# trapstat -T 5
cpu m size| itlb-miss %tim itsb-miss %tim | dtlb-miss %tim dtsb-miss %tim |%tim
----------+-------------------------------+-------------------------------+----
  0 u   8k|      2760  0.1      3702  0.7 |     14239  0.7      4386  0.9 | 2.5
  0 u  64k|         0  0.0         0  0.0 |         0  0.0         0  0.0 | 0.0
  0 u 512k|         0  0.0         0  0.0 |         0  0.0         0  0.0 | 0.0
  0 u   4m|         0  0.0         0  0.0 |         0  0.0         0  0.0 | 0.0
- - - - - + - - - - - - - - - - - - - - - + - - - - - - - - - - - - - - - + - -
  0 k   8k|       681  0.1         0  0.0 |    183328  9.9      2992  0.9 |10.8
  0 k  64k|         0  0.0         0  0.0 |        18  0.0         0  0.0 | 0.0
  0 k 512k|         0  0.0         0  0.0 |         0  0.0         0  0.0 | 0.0
  0 k   4m|         0  0.0         0  0.0 |       818  0.1         0  0.0 | 0.1
==========+===============================+===============================+====
      ttl |      3441  0.2      3702  0.7 |    198403 10.6      7378  1.8 |13.4
For further information on large pages and trapstat, see Chapter 13 in Solaris™ Internals.
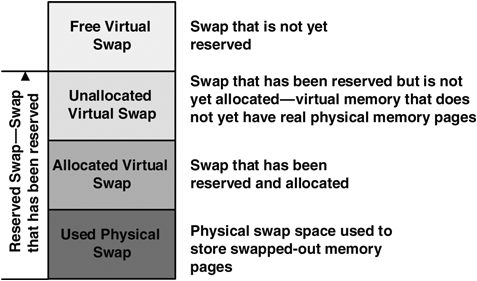
In this section we look at how swap is allocated and then discuss the statistics used for monitoring swap. We refer to swap space as seen by the processes as virtual swap space and real (disk or file) swap space as physical swap space.
Swap space allocation goes through distinct stages: reserve, allocate, and swap-out. When you first create a segment, you reserve virtual swap space; when you first touch and allocate a page, you “allocate” virtual swap space for that page; then, if you encounter a memory shortage, you can “swap out” a page to swap space. Table 6.6 summarizes the swap states.
Table 6.6. Swap Space Allocation States
State | Description |
|---|---|
Reserved | Virtual swap space is reserved for an entire segment. Reservation occurs when a segment is created with private/read/write access. The reservation represents the virtual size of the area being created. |
Allocated | Virtual swap space is allocated when the first physical page is assigned to it. At that point, a |
Swapped out (used swap) | When a memory shortage occurs, a page may be swapped out by the page scanner. Swap-out happens when the page scanner calls |
Swap space is reserved each time a heap segment is created. The amount of swap space reserved is the entire size of the segment being created. Swap space is also reserved if there is a possibility of anonymous memory being created. For example, mapped file segments that are mapped MAP_PRIVATE (like the executable data segment) reserve swap space because at any time they could create anonymous memory during a copy-on-write operation.
You should reserve virtual swap space up-front so that swap space allocation assignment is done at the time of request, rather than at the time of need. That way, an out-of-swap-space error can be reported synchronously during a system call. If you allocated swap space on demand during program execution rather than when you called malloc(), the program could run out of swap space during execution and have no simple way to detect the out-of-swap-space condition. For example, in the Solaris kernel, we fail a malloc() request for memory as it is requested rather than when it is needed later, to prevent processes from failing during seemingly normal execution. (This strategy differs from that of operating systems such as IBM’s AIX, where lazy allocation is done. If the resource is exhausted during program execution, then the process is sent a SIGDANGER signal.)
The swapfs file system includes all available pageable memory as virtual swap space in addition to the physical swap space. That way, you can “reserve” virtual swap space and “allocate” swap space when you first touch a page. When you reserve swap rather than reserving disk space, you reserve virtual swap space from swapfs. Disk swap pages are only allocated once a page is paged out.
With swapfs, the amount of virtual swap space available is the amount of available unlocked, pageable physical memory plus the amount of physical (disk) swap space available. If you were to run without swap space, then you could reserve as much virtual memory as there is unlocked pageable physical memory available on the system. This would be fine, except that often virtual memory requirements are greater than physical memory requirements, and this case would prevent you from using all the available physical memory on the system.
For example, a process may reserve 100 Mbytes of memory and then allocate only 10 Mbytes of physical memory. The process’s physical memory requirement would be 10 Mbytes, but it had to reserve 100 Mbytes of virtual swap, thus using 100 Mbytes of virtual swap allocated from available real memory. If we ran such a process on a 128-Mbyte system, we would likely start only one of these processes before we exhausted our swap space. If we added more virtual swap space by adding a disk swap device, then we could reserve against the additional space, and we would likely get 10 or so of the equivalent processes in the same physical memory.
The process data segment is another good example of a requirement for larger virtual memory than for physical memory. The process data segment is mapped MAP_PRIVATE, which means that we need to reserve virtual swap for the whole segment, but we allocate physical memory only for the few pages that we write to within the segment. The amount of virtual swap required is far greater than the physical memory allocated to it, so if we needed to swap pages out to the swap device, we would need only a small amount of physical swap space.
If we had the ideal process that had all of its virtual memory backed by physical memory, then we could run with no physical swap space. Usually, we need something like 0.5 to 1.5 times memory size for physical swap space. It varies, of course, depending on the virtual-to-physical memory ratio of the application. Another consideration is system size. A large multiprocessor Sun Server with 512GB of physical memory is unlikely to require 1TB of swap space. For very large systems with a large amount of physical memory, configured swap can potentially be less than total physical memory. Again, the actual amount of virtual memory required to meet performance goals will be workload dependent.
The amount of anonymous memory in the system is recorded by the anon accounting structures. The anon layer keeps track in the kanon_info structure of how anonymous pages are allocated. The kanon_info structure, shown below, is defined in the include file vm/anon.h.
struct k_anoninfo {
        pgcnt_t ani_max;         /* total reservable slots on phys disk swap */
        pgcnt_t ani_free;        /* # of unallocated phys and mem slots */
        pgcnt_t ani_phys_resv;   /* # of reserved phys (disk) slots */
        pgcnt_t ani_mem_resv;    /* # of reserved mem slots */
        pgcnt_t ani_locked_swap; /* # of swap slots locked in reserved */
                                 /* mem swap */
};
                                                                         See sys/anon.h
The k_anoninfo structure keeps count of the number of slots reserved on physical swap space and against memory. This information populates the data used for the swapctl system call. The swapctl() system call provides the data for the swap command and uses a slightly different data structure, the anoninfo structure, shown below.
struct anoninfo {
        pgcnt_t ani_max;
        pgcnt_t ani_free;
        pgcnt_t ani_resv;
};
                                                                         See sys/anon.h
The anoninfo structure exports the swap allocation information in a platform-independent manner.
The swap -s command output, shown below, summarizes information from the anoninfo structure.
$ swap -s
total: 108504k bytes allocated + 13688k reserved = 122192k used, 114880k available
The output of swap -s can be somewhat misleading because it confuses the terms used for swap definition. The output is really telling us that 122,192 Kbytes of virtual swap space have been reserved, 108,504 Kbytes of swap space are allocated to pages that have been touched, and 114,880 Kbytes are free. This information reflects the stages of swap allocation, shown in Figure 6.5. Remember, we reserve swap as we create virtual memory, and then part of that swap is allocated when real pages are assigned to the address space. The balance of swap space remains unused.
The swap -l command lists the physical swap devices and their levels of physical allocation.
$swap -l
swapfile              dev  swaplo blocks   free
/dev/dsk/c0t0d0s0    136,0      16 1049312 782752
The blocks and free are in units of disk blocks, or sectors (512 bytes). This example shows that some of our physical swap slice has been used.
The pageout scanner will send clusters of pages to the swap device. However, if it can’t keep up with demand, the swapper swaps out entire threads. The number of threads swapped out is either the kthr:w column from vmstat or swpq-sz from sar -q.
The following example is the same system from the previous swap -l example but it has experienced a dire memory shortage in the past and has swapped out entire threads.
$ vmstat 1 2
 kthr      memory          page            disk          faults      cpu
 r b w   swap  free  re  mf pi po fr de sr dd dd f0 s3   in   sy   cs us sy id
 0 0 13 423816 68144  3  16  5  0  0  0  1  0  0  0  0   67   36  136  1  0 98
 0 0 67 375320 43040  0   6  0  0  0  0  0  0  0  0  0  406  354  137  1  0 99

$ sar -q 1

SunOS mars 5.9 Generic_118558-05 sun4u    03/12/2006

05:05:36 runq-sz %runocc swpq-sz %swpocc
05:05:37     0.0       0    67.0      99
Our system currently has 67 threads swapped out to the physical swap device. The sar command has also provided a %swpocc column, which reports the percent swap occupancy. This is the percentage of time that threads existed on the swap device (99% is a rounding error) and is more useful for much longer sar intervals.
To determine if the physical swap devices are currently busy with I/O transactions, we can use the iostat command in the regular manner. We just need to remember that we are looking at the swap slice, not a file system slice.
$ iostat -xnPz 1
...
                  extended device statistics
    r/s   w/s  kr/s   kw/s wait actv wsvc_t asvc_t  %w  %b device
    0.0  27.0   0.0 3452.3  2.1  0.7   78.0   24.9  32  34 c0t0d0s1
                  extended device statistics
    r/s   w/s  kr/s   kw/s wait actv wsvc_t asvc_t  %w  %b device
    1.0   0.0   8.0    0.0  0.0  0.0    39.6  36.3   4   4 c0t0d0s0
    0.0  75.1   0.0 9609.3  8.0  1.9   107.1  24.7  88  95 c0t0d0s1
                  extended device statistics
    r/s   w/s  kr/s   kw/s wait actv wsvc_t asvc_t  %w  %b device
    0.0  61.0   0.0 7686.7  5.4  1.4   88.3   23.6  65  73 c0t0d0s1
...
Physical memory was quickly exhausted on this system, causing a large number of pages to be written to the physical swap device, c0t0d0s1.
Swap activity due to the swapping out of entire threads can be viewed with sar -w. The vmstat -S command prints similar swapping statistics.
In the following example, we use the prtswap script in MemTool to list the states of swap to find out where the swap is allocated from. We then use the prtswap command without the -l option for just a summary of the swap allocations.
# prtswap -l
Swap Reservations:
--------------------------------------------------------------------------
Total Virtual Swap Configured:                            767MB =
RAM Swap Configured:                                          255MB
Physical Swap Configured:                              +      512MB

Total Virtual Swap Reserved Against:                      513MB =
RAM Swap Reserved Against:                                      1MB
Physical Swap Reserved Against:                        +      512MB

Total Virtual Swap Unresv. & Avail. for Reservation:  253MB =
Physical Swap Unresv. & Avail. for Reservations:            0MB
RAM Swap Unresv. & Avail. for Reservations:        +      253MB


Swap Allocations: (Reserved and Phys pages allocated)
--------------------------------------------------------------------------
Total Virtual Swap Configured:                            767MB
Total Virtual Swap Allocated Against:                     467MB

Physical Swap Utilization: (pages swapped out)
--------------------------------------------------------------------------
Physical Swap Free (should not be zero!):                 232MB =
Physical Swap Configured:                                     512MB
Physical Swap Used (pages swapped out):                -      279MB
                                                                            See MemTool
# prtswap

Virtual Swap:
---------------------------------------------------------------
Total Virtual Swap Configured:                            767MB
Total Virtual Swap Reserved:                              513MB
Total Virtual Swap Free: (programs will fail if 0)        253MB

Physical Swap Utilization: (pages swapped out)
---------------------------------------------------------------
Physical Swap Configured:                                 512MB
Physical Swap Free (programs will be locked in if 0):     232MB
                                                                            See MemTool
The prtswap script uses the anonymous accounting structure members to establish how swap space is allocated and uses the availrmem counter, the swapfsminfree reserve, and the swap -l command to find out how much swap is used. Table 6.7 shows the anonymous accounting variables stored in the kernel.
Table 6.7. Swap Accounting Information
Field | Description |
|---|---|
| The total number of reservable slots on physical (disk-backed) swap. |
| The number of physical (disk-backed) reserved slots. |
| The number of memory reserved slots. |
| Total number of unallocated physical slots + the number of reserved but unallocated memory slots. |
| The amount of unreserved memory. |
| The |
The -S option of pmap describes the swap reservations for a process. The amount of swap space reserved is displayed for each mapping within the process. Swap reservations are reported as zero for shared mappings since they are accounted for only once systemwide.
sol9$ pmap -S 15492
15492:  ./maps
 Address  Kbytes    Swap Mode   Mapped File
00010000       8       - r-x--  maps
00020000       8       8 rwx--  maps
00022000   20344   20344 rwx--    [ heap ]
03000000    1024       - rw-s-  dev:0,2 ino:4628487
04000000    1024    1024 rw---  dev:0,2 ino:4628487
05000000    1024     512 rw--R  dev:0,2 ino:4628487
06000000    1024    1024 rw---    [ anon ]
07000000     512     512 rw--R    [ anon ]
08000000    8192       - rwxs-    [ dism shmid=0x5]
09000000    8192       - rwxs-    [ dism shmid=0x4]
0A000000    8192       - rwxs-    [ dism shmid=0x2]
0B000000    8192       - rwxsR    [ ism shmid=0x3]
FF280000     680       - r-x--  libc.so.1
FF33A000      32      32 rwx--  libc.so.1
FF390000       8       - r-x--  libc_psr.so.1
FF3A0000       8       - r-x--  libdl.so.1
FF3B0000       8       8 rwx--    [ anon ]
FF3C0000     152       - r-x--  ld.so.1
FF3F6000       8       8 rwx--  ld.so.1
FFBFA000      24      24 rwx--    [ stack ]
-------- ------- -------
total Kb   50464   23496
You can use the swap reservation information to estimate the amount of virtual swap used by each additional process. Each process consumes virtual swap from a global virtual swap pool. Global swap reservations are reported by the avail field of the swap(1M) command.
It is important to stress that while you should consider virtual reservations, you must not confuse them with physical allocations (which is easy to do since many commands just describe them as “swap”). For example:
# pmap -S 236
236:    /usr/lib/nfs/nfsmapid
 Address  Kbytes    Swap Mode    Mapped File
00010000      24       - r-x--   nfsmapid
00026000       8       8 rwx--   nfsmapid
00028000    7768    7768 rwx--     [ heap ]
...
FF3EE000       8       8 rwx--   ld.so.1
FFBFE000       8       8 rw---     [ stack ]
-------- ------- -------
total Kb   10344    8272
Process ID 236 (nfsmapid) has a total Swap reservation of 8 Mbytes. Now we list the state of our physical swap devices on this system:
$ swap -l
swapfile             dev  swaplo blocks   free
/dev/dsk/c0t0d0s1   136,9      16 2097632 2097632
No physical swap has been used.