Crystal Reports in the Real World—Advanced Charting
Nothing enables users to visualize data better than a chart. With a glance, charts enable users to see relative distribution, peaks, and valleys of values. This section describes how to use charting in creative ways. The following creates a report that charts the sum of sales and distribution of customers by country:
1. | Open the World Sales Report from C:Program FilesCrystal DecisionsCrystal Reports 10SamplesEnReportsGeneral Business and stretch the chart so it takes the full width of the page. In the left margin, right-click on the text Group Footer 1 and from the menu choose Suppress. |
2. | Right-click on the chart and choose Chart Expert. For Chart Type choose Bar and from the buttons that refine which type of bar chart, choose the lower left option described as Side by Side with 3D (see Figure 9.10). |
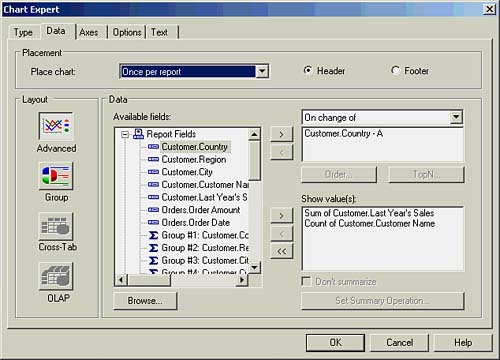
3. | Click on the Data tab and the Advanced button. From the list of available fields select Customer.Country and add it to the window below On Change Of. Again, from the list of available fields choose Customer.Last Year's Sales and Customer.Customer Name and add them to the Show Values (see Figure 9.11). |
4. | Click the Options tab and uncheck the Show Label option. Click OK to close the window. |
5. | The bar chart is almost complete. It contains the correct data so it is technically accurate, but because the scale of the values is so different it is unreadable for the user. See Figure 9.12. |
6. | Because the scale of the data is significantly different, the chart needs to be broken into two axes. Right-click on the chart and choose Chart Options, Template. Click the Dual Axis check box, and click OK. The resulting chart should look like Figure 9.13. |
7. | Finally, a trend line can be added to the chart to show a trend in the data. Right-click on the customer name bar and choose Chart Options, Series. Click the Trend Line tab and add a check to the Show Trend Lines check box and click OK. The resulting chart should resemble Figure 9.14. Save the report as World Sales Report with Charts.rpt. |


..................Content has been hidden....................
You can't read the all page of ebook, please click here login for view all page.