In this chapter, we will discuss how to create some drilldown dashboards, and add some fun functionality such as contextual drilldowns and passing variables from form to form. Form-based dashboards ease the Splunk adoption process and enable a developer to build apps that a user can simply point and click, and report on the information that they need. This helps less knowledgeable users get value out of the data that is being consumed by Splunk.
We will learn about:
- Reports
- Dashboards
- Form-based
- Search-based
- Drilldown
- Report/Data model
- Modules
- Data input
- Chart
- Table
- Single value
- Map module
- Tokens
- Building a form-based dashboard
The differences in dashboards and reports is pretty slight, although important to note, because in Splunk you can do different things with each of these, and in some cases you can build dashboards with reports that enhance the performance of your dashboard.
Reports are basically saved searches that you can access by clicking a link. They can be referenced by dashboards in order to create specific panels, and you can accelerate their performance with Splunk's acceleration option. You cannot accelerate a dashboard without leveraging a report or a data model of some sort. Reports are individual searches that populate results into a single panel.
I'll start by using one of the most common report examples for an operations infrastructure team, the disk space utilization report. I'm going to use Linux-based systems for my example. This example will assume that you have the Splunk_TA_nix add-on installed across your entire Linux environment.
Finding the information we are looking for is as simple as looking at our common command outputs for df. In Splunk, the root search starts with this data:
index=os sourcetype=df
This in turn gives us the events of our df output:
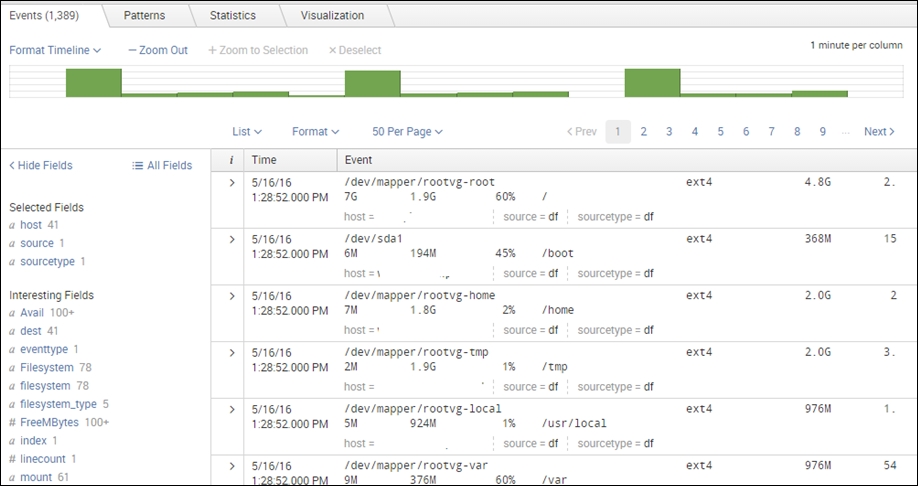
If our deployment was successful at the search tier, indexing tier, and forwarding tier, the fields that we will need to use for this example will be auto-extracted.
Here we will be averaging the used space by mount on every mount within our environment, and which host they live on:
index=nix sourcetype=df
| stats avg(PercentUsedSpace) AS pctSpace by mount host
| eval pctSpace=round(pctSpace)
And then we will add a filter to it, to create relevance to people:
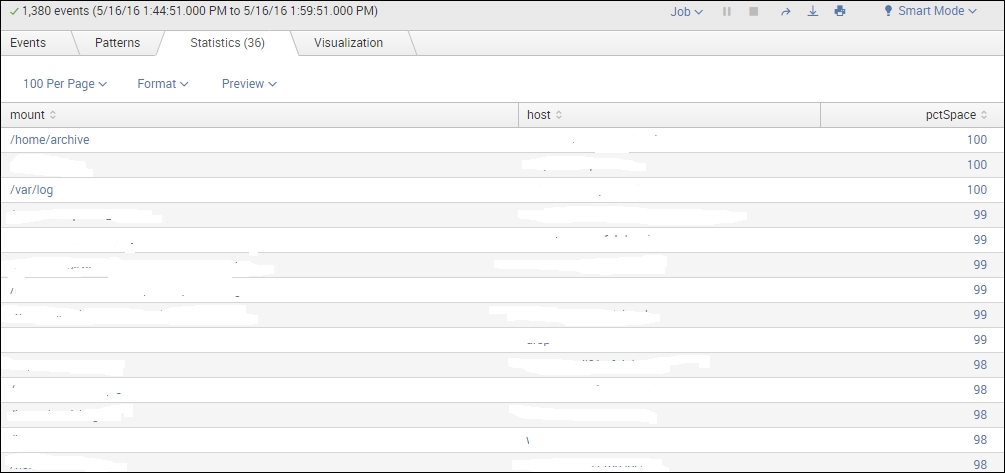
index=nix sourcetype=df
| stats avg(PercentUsedSpace) AS pctSpace by mount host
| eval pctSpace=round(pctSpace)
| where pctSpace > 90
| sort - pctSpace
This will give us a visualization that looks something like this:
Be aware of what you set your time range to, as the report is quite dependent on this. If you want this to run once a day, then set the time range picker to 24 hours.
Once we have that search, we simply click on the Save As feature:

Click Report, and pick a name for this report:

To view this report, simply go to the Reports menu:

And select your newly saved report to have it populate for you through your time range:
From here, you have the option to export, print, or embed these reports, or even send them manually to a person or group of people.
A report is not meant to be triggered in an automated fashion, as this is part of the alert functionality in Splunk.
From here, we can accelerate these reports. Report acceleration is helpful when attempting to get large sets of results to return faster, as it summarizes the data and stores it in virtual memory. We do this by clicking on the Edit function, and clicking Edit Acceleration:
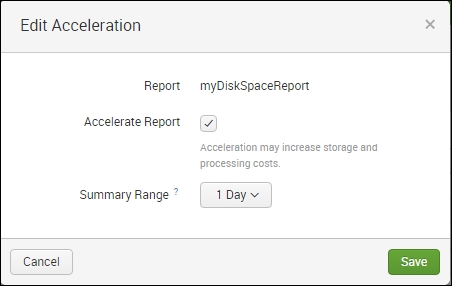
We will then need to choose how long we want the historical data to show, which in this case is a 1 Day period, and click Save.
If we choose, we can then stick these reports in a dashboard, and start off with a good, fast-loading panel.
Dashboards are the culmination of all of the previous things we've discussed concerning knowledge objects, search queries, and reports. These are the things that everybody loves, and truly provide the most value to your user base when made correctly. In short, a dashboard is a collection of searches and/or reports framed inside HTML in different panels.
Dashboarding can be an art form in itself; however, I'm going to suggest that we stick to the basics until people start seeing the value in the Splunk product. Most of what you will need can be downloaded and pulled from the Dashboard Examples app; these are some of the techniques that we will be talking about here in this chapter.
The link to this app is here: https://splunkbase.splunk.com/app/1603/ .
There are a few different types of dashboard to be aware of.
These types of dashboard allow input from a user in order to filter the downstream panels for relevant information. In short, if you want to see a single machine you can type in the name, and only that machine's data populates.
Drilldown dashboards add another layer of complexity, but provide a lot of value by easing the navigation of data. These are the dashboards that are clickable, and each link you click takes you to a view that is more granular than the previous one, effectively drilling into your data for root cause analysis.
Report/data model-based dashboards leverage summary-level information in order to enhance performance while still giving high-level information. These are usually the most complex type of dashboard, but in some cases their results can be automated to send a whole dashboard to an email distribution list in PDF format, which eases weekly reporting. These are also the fastest populating type of dashboards.
While this is the slowest out of the bunch, this is also probably the most common of all of dashboard types. This dashboard has multiple panels, with a unique search set in all of them. Let's say we have a dashboard with 12 panels set up this way. Each of those searches has to run and complete before that panel populates, and none of those searches are accessing summary-level data. They are each searching the raw data before results can be displayed, so this is the equivalent of running 12 searches at the same time, every time this dashboard loads, slowing down the display of these results until each search finishes.
In order to not go down the rabbit hole that is Splunk development, we are going to stick to simplified XML, form-based dashboards.