The Splunk data router is more of a concept than an actual thing. This is basically just a series of heavy forwarders sitting in a global location (preferably a DMZ) that route data to either a single indexer cluster or a series of them depending on your license. I have used the data router successfully in a previous life and it allows developers and security, as well as auditors, a single place to order data from.
I use the word order because you can literally make what I call a menu (which is a list of the data types) and allow different departments to pick what data they want. Just be sure to get approval by leadership, for security reasons.
The following diagram is a realistic representation of how the network segments that we spoke of earlier have a relationship with each other:

As you can see in the preceding diagram, the DMZ is a great place to put the data router, so we will use this for our example.
Let's assume each of these segments has 200+ forwarders in each of them and we have been tasked with sending all of that firewalled data to a single production Splunk instance. However, one of the many development teams also has a Splunk instance that they maintain and use to centralize logging and troubleshoot their applications.
They would like to see production data within their development Splunk instance, but only for their specific application.
The following are a couple of key requirements to make this a reality:
- Universal index naming
- Data to port mapping
Building a data router is as easy as setting up an array of heavy forwarders. The hardest part is the before work, which is creating the data maps and opening the firewalls. There is no quorum to hold on heavy forwarders, so you can have as many as your fault-tolerance requires. In this example, I will use five forwarders as the data router and we will see how to manipulate the data streams within them. We will need to build these forwarders within the DMZ so that all nodes within our environment can send data to them.
We will start with the following high-level diagram of what the data router looks like and its relationship with enterprise data centers:

One of the first things we will need to do is open a firewall request to open (arbitrary number here) 100 ports, and in this case, we will use 9900 to 10000. These can be labelled as splunk ports and we can wrap an Access Control List (ACL) around them.
The next thing we will need to do is start mapping our data inputs to ports within that range. Meaning that Windows (AD) data is on port 9900, Windows events are on 9901, Linux OS data is on 9901, syslog data is on 9902, and so on.
The following is an example data map for reference that we will be using for this example:
|
Data set |
Data port |
|
Windows events |
9900 |
|
MS Exchange |
9901 |
|
Perfmon |
9902 |
|
MSAD |
9903 |
|
Linux (OS) |
9904 |
|
Hadoop (MapR) |
9905 |
|
Syslog |
9906 |
We will then need to open a firewall request from the heavy forwarders to both sets of indexers (production/development). For our example, we will use the default port to communicate with the indexers (9997), windows perfmon, and Linux OS data. Keep in mind that the destination indexer cluster is responsible for data replication to any other site.
The data flow itself will then look something like the following diagram:

The point of opening the firewall for 100 ports is so that in the future you don't have to open the firewall for any other future datasets, as they can simply be assigned to one of the 100 ports. They can also be replicated to any destination set of indexers. Some companies won't allow the opening of 100 ports, so use your best judgment as to what your security team will allow. Also, the request itself is much less cumbersome, as there are only five machines that need access as opposed to 1000, so it poses much less risk.
From a Splunk perspective, we will need to adjust our UF deployment, in order to target the heavy forwarders instead of the indexers. This is done through the outputs.conf on your UF. I would recommend using a deployment server for this type of mass configuring. The settings in outputs.conf would look something like the following:
[tcpout]
forceTimebasedAutoLB = true
autoLB = true
indexAndForward = false

[tcpout:dmz_perfmon]
server = 10.10.10.20:9902, 10.10.10.21:9902, 10.10.10.22:9902, 10.10.10.23:9902, 10.10.10.24:9902

[tcpout:dmz_nix]
server = 10.10.10.20:9904, 10.10.10.21:9904, 10.10.10.22:9904, 10.10.10.23:9904, 10.10.10.24:9904
Tip
The forceTimebasedAutoLB is an important setting here. Splunk will not normally load balance until the TCP connection is broken. This setting forces the data stream to roll to another forwarder/indexer even if the TCP stream isn't broken. This is necessary so all of your data doesn't end up on a single indexer.
Once you have all of the outputs of your forwarders pointing to your data router, the next step is to begin implementing your data inputs.
Keep in mind that our data inputs are assigned to specific ports within our outputs.conf (preceding code) and we will need to call that out with each data input we use.
Let's use a single example of each data type within our inputs.conf:
Windows perfmon:
[perfmon://CPU]
_TCP_ROUTING = dmz_perfmon
counters = *
disabled = 0
instances = *
interval = 60
object = Processor
useEnglishOnly=true
Linux Syslog:
[monitor:///var/log/]
_TCP_ROUTING = dmz_nix
whitelist=(messages|secure|auth|mesg$|cron$|acpid$)
blacklist=(lastlog|anaconda.syslog)
disabled = 0
We will need to use the outputs.conf and the inputs.conf files in order to build this data router as well, and in these two files the majority of our magic takes place.
When we build these files, we will need to deploy them across all five of our HF's, which usually means it's easiest to have them connected to a deployment server. I will continue with the assumption that there is a deployment server configuring the data router.
For the app that is deployed to our data router, we will need to specify all of our indexers that we want to send data to, and as for the inputs.conf, we will need to specify the TCP port for production as well as our development Splunk instance (or whichever port you've designated). The settings in outputs.conf would look something like the following:
[tcpout]
defaultGroup = primaryDC
forceTimebasedAutoLB = true
autoLB = true
indexAndForward = false

[tcpout:primaryDC]
server = primaryIDX1:9997, primaryIDX2:9997, primaryIDX3:9997, primaryIDX4:9997, primaryIDX5:9997, primaryIDX7:9997, primaryIDX8:9997, primaryIDX9:9997, primaryIDX10:9997

[tcpoutput:DRDC]
server = drIDX1:9997, drIDX2:9997, drIDX3:9997, drIDX4:9997, drIDX5:9997, drIDX6:9997, drIDX7:9997, drIDX8:9997, drIDX9:9997, drIDX10:9997

[tcpoutput:applicationDEV]
server = server1:9997, server2:9997, server3:9997, server4:9997, server5:9997
Here we have a list of our entire Splunk indexer cluster. One for primary, one for DR, and finally the one in the development network segment.
After we create the outputs.conf file, we need to have the inputs.conf file in all of our Heavy Forwarders be the same.
When creating inputs.conf of our HF, we will leverage the data map that we created earlier and our stanzas within our outputs.conf:
[tcp://9902]
_TCP_ROUTING = primaryDC,applicationDEV
sourcetype = perfmon
index = perfmon


[tcp://9904]
_TCP_ROUTING = primaryDC,applicationDEV
sourcetype = syslog
index = nix
You'll notice that we are using the same _TCP_ROUTING method to route data from their respective ports to the destination index clusters.
In an attempt to summarize this section, the following is a diagram, with the correlating configurations:
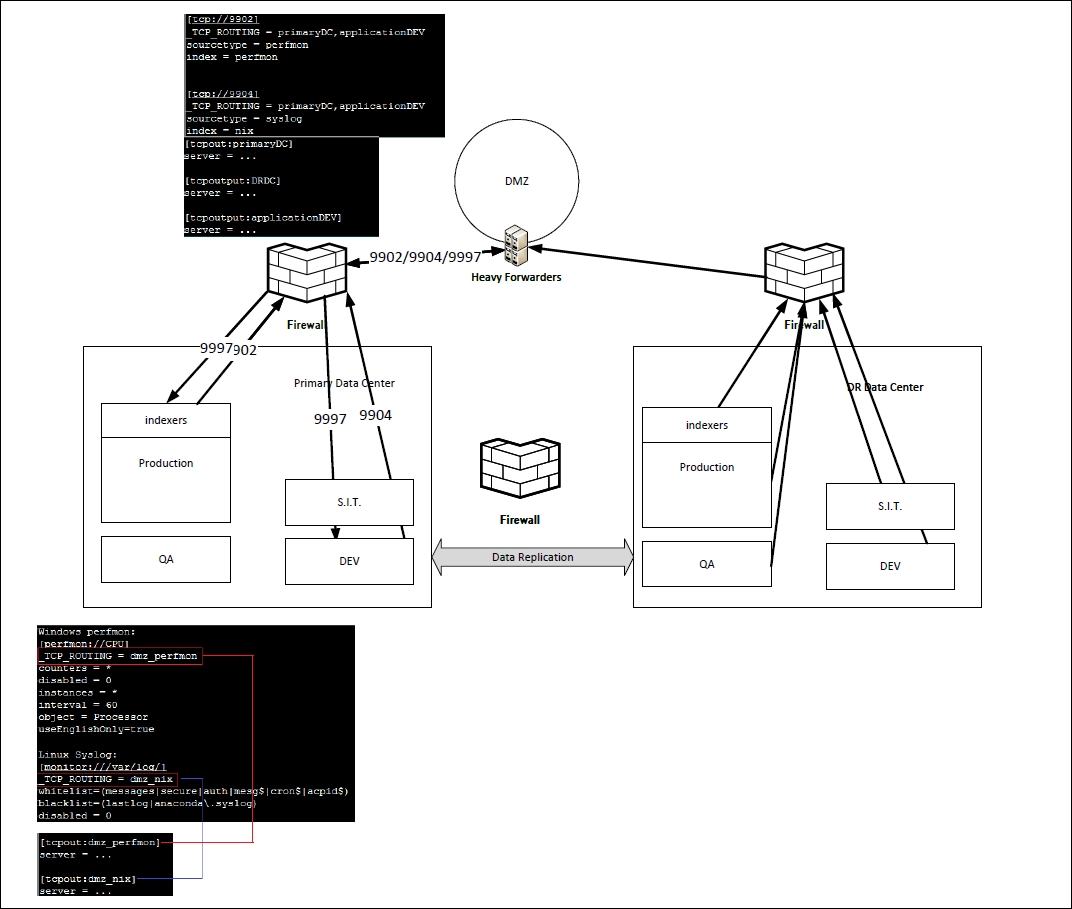
In the preceding diagram, the configurations for the inputs on the forwarder route data to the HF (data router) load balanced and then the data router sends/replicates that data set to both sets of indexers. The cluster master in the production environment is replicating this data to the DR site, so all of your data is now available in three sites.
This architecture can get incredibly complicated depending on how many people are interested in different data sets, as well as what the Splunk team is actually responsible for monitoring and reporting on.
After you get a single instance of this working, you can apply this to any other data set in your universe and replicate or send data to any other Splunk instance in your network, as long as your network team opens a firewall and the license can accommodate the data replication.
This technique can be used in any instance where security is strict and there is a need to limit security vulnerability to a single machine or a handful of machines as opposed to an entire subnet. This can also be handy when working with third-party network vendors, say from a data center, as they will only need to open a handful of addresses as opposed to an entire subnet to allow Splunk data through to your production instance.
No doubt once people understand that you can build a data router, your immediate next step is to track your data map, which will become your menu of sorts. If you choose to market this internally, people will begin to get increasingly curious and specifically if they don't have to purchase a license to test drive their data (which may be as easy as giving them temporary access to an IIS index), word of mouth can start to travel fast.
Make sure to have your processes and policies in place as quickly as you can, because implementing this type of data router into an enterprise class Splunk infrastructure is similar to opening a firehose of possibility into your environment.
I've even known people to charge x dollars for this subset of data and then x dollars for this superset of data subscriptions, which is doable and can affect a departmental budget in a positive way. When licensing is an issue, leveraging this type of methodology or a shared budgeting conversation gets easier.