
Okay, so now we get to play around with some visualizations. Let's create a dashboard with some visualizations of our data from https://meh.com/. For now, we will limit ourselves to the native visualizations. We will start with the meh_products lookup that we have generated. Each product is listed as either New or Refurbished, so let's see how that makes a chart:
| inputlookup meh_products | top product_condition
This will be our basic search that pulls the meh_products lookup, which is kept populated by the saved search we had written earlier. We are only interested in knowing the distribution of product conditions over the entire time range, so we will choose a pie chart from the drop-down menu. This gives us a pie chart like this one:

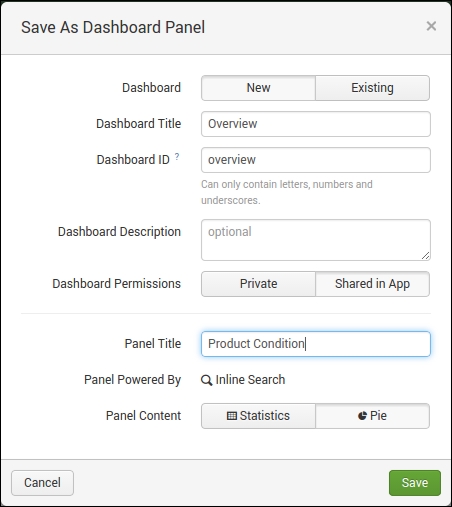
As you can see, at the time of writing this book, and with the amount of data collected, the top condition at 90.909% is New. Now, let's save this as a panel in a new dashboard. We will call the dashboard Overview. We do this by clicking on the Save As drop-down menu in the top-right corner of the screen. You would want to save it as Dashboard Panel. This pops up a dialog to create a new dashboard, or append this visualization to an existing dashboard. We want to create a new dashboard. Fill in the form, as shown in the following screenshot, and then click on Save.
Since we are developing a full-blown App, we want to make sure that this dashboard is created in the App, and not in our user folder. So, make sure that the Shared in App option is selected:
This will create the dashboard and place that pie chart on it. Once you have this created, you need a way to quickly get to the dashboard. Let's edit the default.xml file (located in default/data/ui/nav) and add the name of this dashboard. Add the following line to the XML file, right under the nav tag of the file. Hit the debug/refresh endpoint to load the change:
<view name="overview" default="true" />
When you navigate to the app, this Overview dashboard will be the first to load. Let's add some more data visualizations, shall we? You can add as many as you want, but keep in mind that if more visualizations are added, more searches will need to be dispatched, and this may decrease search performance of the search head.
This is what we came up with; isn't it pretty?

All these data points are calculated from the meh_products lookup file, and they cover all the items located therein. However, what if we want time-based data? Let's create another dashboard. This one will use the summaries of the https://meh.com/ polls that we have been collecting. We won't go step by step as we create the time poll data dashboard; the steps are fairly similar to before. Don't forget to add your new dashboard to the navigation! The following screenshot gives us the poll results:
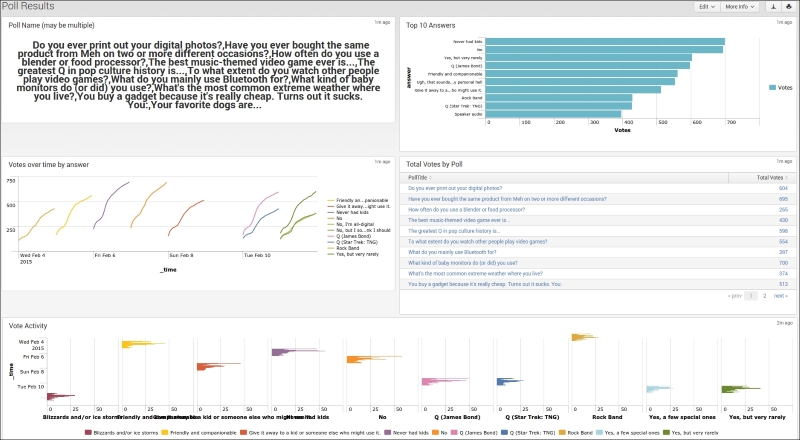
Wow! That was quick. Do you see how we are using line charts and bar charts to display time-based data? But wait! The data looks funny. That is because this dashboard is showing everything over all the time for which we collected data. A new poll starts every day, with new answers, so this dashboard currently shows the aggregate of the entire collection. Not really useful in the grand scheme of things, which leads us to… SimpleXML forms!
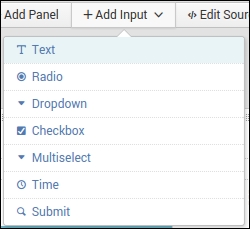
A SimpleXML form allows you to convert a SimpleXML dashboard into a dashboard with inputs. This allows you to narrow down the set of information from all time to a defined range of time. Let's go ahead and convert this dashboard into a form. Find the Edit drop-down menu in the top-right corner of the dashboard, and then choose Edit Panels. Here, you will see Add Input. Click on this and select Time. There are also other options available, as you can see in this screenshot:
Clicking on Time will add a drop-down in the top-left corner of the dashboard. Now, it is considered a form. While still in edit mode, select the time range picker and set the value to Today. This will load only today's data into the form that was created. To leverage this new restriction, you must update each panel. Edit each panel search, click on the Edit Search String item and update Time Range Scope to Shared Time Picker (field1). This will allow each panel to use the time range picked in the drop-down at the top of the form. Once you have edited all the panels, click on the Done button in the top-right corner, and then refresh the page. You will notice that the data is cleaner and displays only a single poll's information. This allows the information to be displayed cleanly and with context. Remember that chart from the bottom of the dashboard? Ugly, wasn't it? Very cluttered and not useful; now that same chart is nicely clean and displays data in two dimensions.
The data here uses a bar chart, with each answer as a different color (and column). This chart gives you a time-based representation of poll results. Time is shown from top (midnight) to bottom. Each different color represents a different poll response, and from left to right is the calculated difference in the number of votes (essentially, it is the distance from one data point to the next in the summary), which shows the number of additional votes that that answer received from the previous time frame in the summary:

Let's look a little closer at a few bars. The following screenshot shows a close-up of the far left answer. As you can see, there is a lot of activity in the first few hours of the day, and it steadily decreases over the course of the day:

While this might not be a common use for bar charts, it represents the data differently, while giving context to each data point.
Now that we have the form responding to a specific time range, let's clean up the search activity. As it currently stands, each panel in this form executes a new search. That's not very effective, especially when the dataset could be massive. So, let's talk about post-processing. What is post-processing? Essentially, we will define a single search element for the dashboard. Then, we will use those search results in every other panel of the dashboard—one base search transformed and processed multiple times. We start by editing the source of the form, located under the Edit drop-down (find the Edit Source option). Now, add in this XML code, right before the first <row> tag:
<search id="baseSearch">
      <query>
        index=summary category=meh_poll | bucket span=1h _time | stats count avg(votes) as votes by _time PollTitle answer | fields - count
    </query>
      <earliest>$field1.earliest$</earliest>
      <latest>$field1.latest$</latest>
</search>
This sets up the base search for all other panels that reference the baseSearch ID. Did you notice the $field1.earliest$ token? It refers to the time picker drop-down that was added earlier in the section where we converted this dashboard into a form. Don't worry about it for now; just add it in there, as shown. Now find your first panel. You will see a <search> tag underneath the <title> tag.
Add base="baseSearch" to the <search> tag and change the <query> tag to have only the stats command. You should end up with something like this:
<search base="baseSearch">
         <query>stats values(PollTitle)</query>
</search>
Do this for each panel in the form. Once you're done, click on the Save button. Now each panel within your form will load as soon as the main search is done. In this way, you can speed up the rendering of the form without extolling a huge search cost on your infrastructure.
Post-processing should only be used on data that has been transformed in some way. It is not a best practice to use raw events, mainly due to the 500,000 event limitation and restriction of the post processing module. There is also a timeout in Splunk Web that may be reached if you are searching for large datasets. In our example, we used the stats command to transform the data into a table with only a selected number of fields and already calculated hourly votes. This helps to optimize the base search and prevents us from reaching the limit.
Another great optimization trick is to use a scheduled search, summary index, or data model as the base search.
Let's circle back to that $field1.earliest$ item we saw earlier. This is a tokenized field. Splunk tokenizes the variable, allowing dynamic drill-downs and conditional displays and capturing inputs. You can then reference the tokenized element using the $variable$ name. We are going to implement one of these to dynamically limit the results shown, based on the number of votes for an answer. Firstly, click on the Add Input button (after entering edit mode, of course), and add a Text box. Once it is placed in the field set in the top-left corner, click on the little pencil icon to edit the field. Enter the values shown in this screenshot:

Click on the Apply button and then on the Done button to finish creating the panel. Now, you would want to add that limitation to your searches, so pick a search that you want to restrict. Add the token name (surrounded by $) to the search as if you were specifying a field. For example, we might only want the answers with more than 100 votes to be displayed on our time-based line chart. The original post process query is this:
where isint(votes) | timechart span=1h max(votes) as Votes by answer useother=f
We will update it to the following:
where isint(votes) AND votes > $min_votes$| timechart span=1h max(votes) as Votes by answer useother=f | eval threshold = $min_votes$.
Save the panel and refresh the form. The default value is 0, which is meant to include all results, but once it is changed to 100, the chart displays only the answers that have more than 100 votes, in effect, showing when each answer crossed the threshold:
