
Because microservices are distributed and fine-grained (small), they introduce a level of complexity to our applications that don’t exist in monolithic applications. Microservices architectures require a high degree of operational maturity, and monitoring becomes a critical part of their administration. If we research service monitoring, we will see that most people agree that it’s a fundamental process, but what exactly is monitoring? We define monitoring as the process of analysis, collection, and data storage such as application, platform, and system event metrics among others, that helps us visualize failure patterns within an IT environment.
Only failures? It is essential to clarify that failure is one of the most apparent reasons why monitoring is fundamental, but it isn’t the only one. The microservice performance also is considered another reason and, indeed, plays a critical role in our applications. We cannot describe the performance as a binary concept that is “up and running” or “down.” Service architectures can operate with a specific state of degradation that may affect the performance of one or more services. In the following sections, we show you how to monitor our Spring Boot microservices using several technologies such as Spring Boot Actuator, Micrometer, Prometheus, and Grafana. So, let’s start.
C.1 Introducing monitoring with Spring Boot Actuator
Spring Boot Actuator is a library that provides monitoring and administration tools for our REST API in a reasonably simple way. It does this by organizing and exposing a series of REST endpoints that allow us to access different monitoring information to check the status of our services. In other words, Spring Boot Actuator provides out-of-the-box operational endpoints that will help us understand and manage our service’s health.
To use Spring Actuator, we need to follow two simple steps. The first is to include the Maven dependencies in our pom.xml file, and the second is to enable the endpoints we are going to use in our application. Let’s look closer at each of these steps.
C.1.1 Adding Spring Boot Actuator
To include Spring Boot Actuator in our microservice, we need to add the following dependency to the pom.xml in the microservice we are working on:
<dependency>
   <groupId>org.springframework.boot</groupId>
   <artifactId>spring-boot-starter-actuator</artifactId>
</dependency>
C.1.2 Enabling Actuator endpoints
Setting up Spring Boot Actuator is a straightforward process. Just by adding the dependency to our microservices, we now have a series of endpoints available to consume. Each endpoint can be enabled or disabled and exposed via HTTP or JMX. Figure C.1 shows all the Actuator endpoints enabled by default. To enable a specific endpoint, we only need to use the following format property:
management.endpoint.<id>.enabled= true or false
For example, to disable the beans endpoint, we need to add the following property:
management.endpoint.beans.enabled = false
For this book, we enable all the default Actuator endpoints for all our microservices, but feel free to make the changes that best fit your needs. Remember, you can always add security to the HTTP endpoints by using Spring Security. The following code shows the Spring Boot Actuator configuration for our licensing and organization services:
management.endpoints.web.exposure.include=*
management.endpoints.enabled-by-default=true
With this configuration, if we enter the http://localhost:8080/actuator endpoint in Postman, we’ll see a list like the one shown in figure C.1, with all the endpoints exposed by Spring Boot Actuator.

Figure C.1 Spring Boot Actuator default endpoints
C.2 Setting up Micrometer and Prometheus
Spring Boot Actuator offers metrics that allow us to monitor our application. However, if we want to have more precise metrics for our application, and we want to obtain those metrics, we will need to use additional tools like Micrometer and Prometheus.
C.2.1 Understanding Micrometer and Prometheus
Micrometer is a library that provides application metrics and is designed to add little or no overhead to the metrics collection activity in our applications. Micrometer also allows metrics data to be exported to any of the most popular monitoring systems.
Using Micrometer, the application abstracts the metric system used and can be changed in the future if desired. Alternatively, one of the most popular monitoring systems is Prometheus, which is responsible for collecting and storing metrics data exposed by the application. It offers a data query language with which other applications can visualize the metrics in graphs and control panels. Grafana is one tool that allows you to view the data provided by Prometheus, but Micrometer can also be used with other monitoring systems like Datadog, SignalFx, Influx, New Relic, Google Stackdriver, Wavefront, and more.
One of the advantages of using Spring Boot for our microservices is that it allows us to choose one or more monitoring systems containing different views to analyze and project our results. With Micrometer, we will be able to measure metrics that allow us to understand the performance of our systems as a whole; through several components of a single application or instances of clusters; and so forth. The following list contains some of the metrics we can obtain with Micrometer:
For this book, we chose Prometheus as the monitoring system because it integrates with Micrometer and Spring Boot 2 simply. Prometheus is an in-memory dimensional time series database and also a monitoring and alert system. When we talk about storing time series data, we refer to storing data in chronological order and measuring variables over time. Time series–focused databases are exceptionally efficient for storing and querying this data. Prometheus’s main objective is to work as a pull model, scraping the metrics from the application instances periodically. Some of the main characteristics of Prometheus are these:
-
Flexible query language—It contains a custom query language that allows us to query data straightforwardly.
-
Efficient storage—It efficiently stores the time series in memory and on a local disk.
-
Multidimensional data models—All time series are identified by a metric name and a set of key-value pairs.
-
Multiple integrations—It allows integration with third parties like Docker, JMX, and more.
C.2.2 Implementing Micrometer and Prometheus
To export the data to Micrometer and Prometheus using Spring Boot 2, we need to add the following dependencies. (Note that Prometheus comes with the Micrometer package.)
<dependency>
   <groupId>io.micrometer</groupId>
   <artifactId>micrometer-registry-prometheus</artifactId>
</dependency>
<dependency>
   <groupId>io.micrometer</groupId>
   <artifactId>micrometer-core</artifactId>
</dependency>
For this book, we enabled all of the default Actuator endpoints for all our microservices. If you only want to expose the Prometheus endpoint, you should include the following property in the licensing and organization service application properties:
management.endpoints.web.exposure.include=prometheus
By executing these steps and by entering the http://localhost:8080/actuator URL in Postman, you should now be able to see a list of Actuator endpoints like the ones shown in figure C.2.
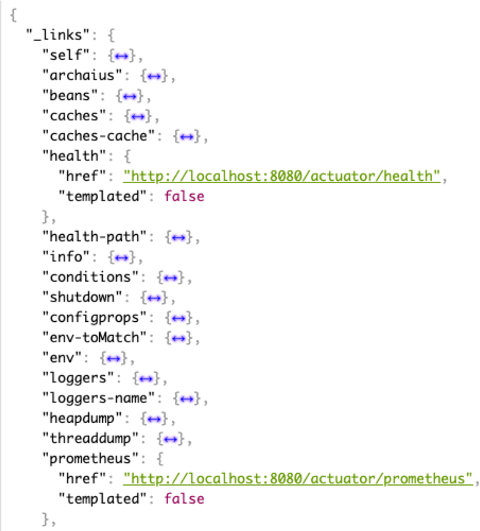
Figure C.2 Spring Boot Actuator endpoints including the actuator/prometheus endpoint
There are several ways to set up Prometheus. In this book, we use a Docker container to run the Prometheus services using the official images that are ready to use. But feel free to use the one that best suits your needs. If you want to use Docker, make sure you have the service defined in the Docker Compose file as shown in the following listing.
Listing C.1 Setting up Prometheus in the docker-compose file
prometheus:
    image: prom/prometheus:latest
    ports:
      - "9090:9090"
    volumes:
    - ./prometheus.yml:/etc/prometheus/prometheus.yml
    container_name: prometheus
    networks:
      backend:
        aliases:
          - "prometheus"
For the Prometheus container, we’ve created a volume for the Prometheus configuration file, which is called prometheus.yml. This file contains the endpoints that Prometheus uses to pull the data. The following listing shows the content of this file.
Listing C.2 Setting up the prometheus.yml file
global:
  scrape_interval:     5s                       ❶
  evaluation_interval: 5s                       ❷
scrape_configs:
  - job_name: 'licensingservice'
    metrics_path: '/actuator/prometheus'        ❸
    static_configs:
    - targets: ['licensingservice:8080']        ❹
  - job_name: 'organizationservice'
    metrics_path: '/actuator/prometheus'
    static_configs:
    - targets: ['organizationservice:8081']     ❺
❶ Sets the scrape interval to every 5 seconds
❷ Sets the evaluate rules time to every 5 seconds
❸ URL for the actuator/prometheus endpoint that exposes metrics information in the format that Prometheus expects
❹ URL for the licensing service
The prometheus.yml file defines the configurations for the Prometheus service. For example, with the previous values, the service scrapes all the /Prometheus endpoints every 5 seconds and adds the data to its time series database.
Now that we have the configuration set up, let’s run our services and verify that the scraping was successful. To confirm this, visit the URL http://localhost:9090/targets to see a page similar to the one shown in figure C.3.
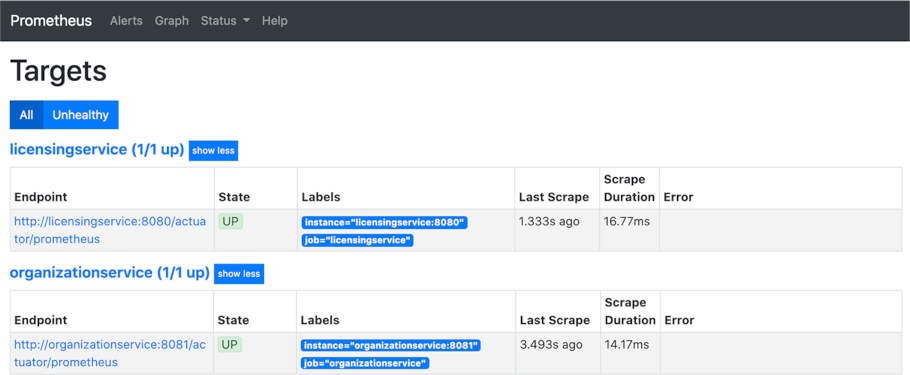
Figure C.3 Prometheus targets configured in the prometheus.yml file.
C.3 Configuring Grafana
Grafana is an open source tool that displays time series data. It offers a set of dashboards that lets us visualize, explore, add alerts, and understand the application data. Grafana also enables us to create, explore, and share dashboards. The main reason we chose Grafana in this book is that it is one of the best options for displaying dashboards. It contains incredible graphics and multiple functions, is flexible, and most important, it is easy to use.
There are several ways to set up Grafana as well. In this book, we use the official Grafana Docker image to run the service. But feel free to use the one that best suits your needs. If you want to use Docker, make sure you have the service defined in the docker-compose file as shown in the following listing.
Listing C.3 Configuring Grafana in the docker-compose file
grafana:
    image: "grafana/grafana:latest"
    ports:
      - "3000:3000"
    container_name: grafana
    networks:
      backend:
        aliases:
          - "grafana"
Once the configuration is added to the docker-compose file, you can execute the following command to run your services:
docker-compose -f docker/docker-compose.yml up
When it finishes, Grafana should be up and running on port 3000, as set in listing C.3. Visit the http://localhost:3000/login to see the page shown in figure C.4.

Figure C.4 Grafana login page showing the default username and password (admin admin)
Figure C.4 shows the default username and password for Grafana. We can change this default once we log in, or we can define a username and password in the docker-compose file. The following listing shows how to do this.
Listing C.4 Configuring the admin username and password for Grafana
grafana:
    image: "grafana/grafana:latest"
    ports:
      - "3000:3000"
    environment:
      - GF_SECURITY_ADMIN_USER=admin           ❶
      - GF_SECURITY_ADMIN_PASSWORD=password    ❷
    container_name: grafana
 ... rest of the file removed for conciseness
To finish the configuration in Grafana, we need to create a data source and a dashboard configuration. Let’s start with the data source. To create the data source, click the Data Sources section on the main page in Grafana, click the explore icon on the left, and select Add Your First Data Source, as shown in figure C.5.

Figure C.5 Grafana Welcome page. This page shows the links to set the initial configuration.
When you are at the Add Data Source page, select Prometheus as the time series database as shown in figure C.6.

Figure C.6 Selecting the time series database for Prometheus in Grafana
The final step is to configure the Prometheus URL (http://localhost:9090 or http://prometheus:9090) for our data source. Figure C.7 shows you how.
NOTE We use localhost when we run the services locally, but if we run the services with Docker, we need to use the Prometheus service backend alias we defined in the docker-compose file. For the Prometheus service, we defined the prometheus alias. You can see this in listing C.1.
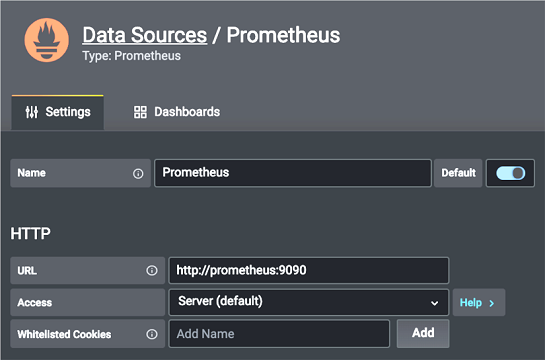
Figure C.7 Configuring the Prometheus data source using a local or a Docker Prometheus URL
Once filled, click the Save and Test button at the bottom of the page. Now that we have our data source, let’s import a dashboard for our Grafana application. In order to import a dashboard, in Grafana click the Dashboard icon on the left menu, select the Manage option, and click the Import button.
On the Import page, you will see the following options:
For this example, we’ll select Import Via grafana.com to import the following dashboard: https://grafana.com/grafana/dashboards/11378/. This dashboard contains the Spring Boot 2.1 statistics by Micrometer-Prometheus. To import this dashboard, copy the URL or the ID to the clipboard, paste it into the Import Via grafana.com field, and click the Load button. Clicking the Load button redirects you to the Dashboard Configuration page where you can rename, move to a folder, or select a Prometheus data source. To continue, select the Prometheus data source and click the Import button.
If the configuration is successful, you should now see your dashboard page with all the Micrometer metrics. Figure C.8 shows the Spring Boot 2.1 System Monitor dashboard.

Figure C.8 The Grafana Spring Boot 2.1 System Monitor dashboard
We recommend that you visit the official documentation if you want to know more about Grafana and Prometheus at these links:
C.4 Summarizing our discussion
Our microservices architecture needs to be monitored for the same reasons as any other type of distributed system. The more complex our architecture gets, the more challenging it is to understand the performance and to troubleshoot the issues.
When we talk about monitoring an application, we often think of failure, and yes, failure is one of the most common reasons why adequate monitoring is essential. Still, it is not the only reason. Performance is another excellent reason for monitoring. As we mentioned in the first chapters, services are not only up or down; they can also be up and running but with a degraded state that can damage our best intentions.
With a reliable monitoring system like the one we explained in this appendix, you can prevent performance failures and can even visualize possible errors in your architecture. It is essential to note that you can add this monitoring code to any of your application development stages. The only requirements you need to execute the code in this book are Docker and a Spring Boot application.