Chapter 16
Discovering Screening Tools
IN THIS CHAPTER
![]() Beginning with the basics of screening tools
Beginning with the basics of screening tools
![]() Locating stocks with stock screeners
Locating stocks with stock screeners
![]() Finding exchange-traded funds with an ETF screener
Finding exchange-traded funds with an ETF screener
When you’re spanning the stock-investing world, it can be daunting to see literally thousands of stocks to choose from — and that’s just the U.S. stock markets. Many thousands more are across the global stock market realm. Where would a stock investor (especially a novice investor) begin to look?
Well, you’re doing the right thing by first reading a book like this (thank you and, uh, you’re welcome!). Why? Because a book like this gives you some parameters and guidelines to help you make a sound choice among the companies that are available as publicly traded stocks. As I often emphasize, you may be purchasing a stock, but you’re really investing in a company. That company has financial data and other information that you can review and use to narrow your search by keeping to some definable (and searchable) standards.
This is why I love stock screening tools! A stock screening tool is an online program found on many financial websites and brokerage sites that sifts through tons of stocks and their relevant data (profits, sales, and so on) with parameters that you set. It works like a search engine but within a huge closed database that is regularly updated with public company data. You’ll find one or more stocks that fit the parameters you set.
In this chapter, I provide the most common parameters for tools that screen stocks and exchange-traded funds (ETFs). But first, I give you some basics about these tools. Keep in mind that with these tools, you’re looking for companies based on your search criteria. You can find stocks and ETFs based on a variety of critical standards and metrics that you define and set.
 For some great sites that have stock screening tools (especially for fundamental analysis), check out the following:
- Investing.com (
www.investing.com) - MarketWatch (
www.marketwatch.com) - Nasdaq (
www.nasdaq.com) - TradingView (
www.tradingview.com) - Yahoo! Finance (
http://finance.yahoo.com)
Understanding the Basics of Screening Tools
After you familiarize yourself with the components and practicality of stock screening tools, you’ll be hooked, and you’ll wish that you had used them sooner. In the following sections, I break down the essentials.
Choosing the category
The first thing you typically see with a stock screening tool is the category. Actually, this means the sector or industry (see Chapter 13 for an introduction to industries). Many screeners (such as the one at Yahoo! Finance, https://finance.yahoo.com/screener) go into subcategories. Yahoo! Finance can help you screen stocks in the equity screener found at the top of the page; also useful are a mutual fund screener and an ETF screener.
If, for example, you’re looking to invest in a technology company, you click the equity screener link, go to the sector choice Technology, and then go to the industries within it. The industry choices (I found 12 at the time of writing) range from Information Technology Services and Electronic Components to the last one, Solar.
Distinguishing “min” versus “max”
Min and max are the yin and yang of the stock screening world. When you set your parameters for stocks, you need to set a minimum and a maximum. Some sites use terms such as “greater than,” “less than,” and “equals,” or they let you set a definable range between two specific numbers. If a stock screening tool uses the term “profitable stock,” that means you need to set a parameter of minimum profit. The stock investor takes the long view and stays patient and focused for successful value investing (find out more about this topic in Chapter 8).
 Keep in mind that some stock screeners use a different approach than “min” and “max,” such as “less than” and “greater than,” but it essentially serves the same purpose for your searches.
Setting value ranges
In some cases, you may need to choose a range. Perhaps you’re looking for stocks in a particular price range. A stock screening tool may provide choices such as 0–10, 10–20, 20–30, 30–40, 40–50, and over 50. Other typical ranges you may see are market capitalization (the total market value of the company’s stock) and dividend yields (the dividend amount divided by the stock price).
Searching regardless of your entry
Most screening tools allow you to do a search whether you enter one value or parameter or many. If you choose to search for a stock in all categories and enter only, say, a dividend yield with a minimum value of 2 and a maximum value of 999 and no other entries, you’ll get hundreds of stocks.
However, if you input plenty of parameters, then you’ll get very few stocks (or none at all). If you ask for stocks with features A, B, C, D, and E, then you won’t get as many results. Be selective — that’s the whole point of using stock screeners — but don’t go overboard trying to find the perfect stock because it may not exist.
Getting close to perfection is probably good enough, but the more important point is to avoid the bad choices such as companies that have too little income, have net losses, or carry too much debt.
Touring a Stock Screening Tool
Most stock screening tools have some basic elements that are very useful in helping you narrow your search for the right stocks in your portfolio. Figure 16-1 shows a typical stock screener from Yahoo! Finance (https://finance.yahoo.com/screener); the following sections walk you through the major fields of this tool.
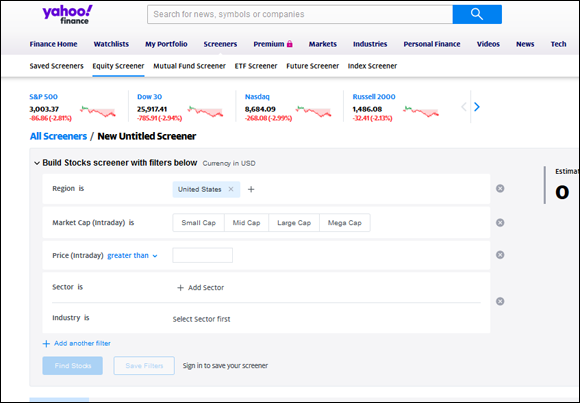
Source: Yahoo! Finance
FIGURE 16-1: A typical stock screening tool.
Keep in mind that with the minimums and maximums in the following sections, there will be variations. Also, some market analysts and financial advisors are more or less lenient than I am with these numbers. Don’t sweat it. Do your research and come up with similar numbers that you’re comfortable with.
Before you begin: Selecting your screener
At the Yahoo! Finance stock screener page (https://finance.yahoo.com/screener), you see the following links at the top:
- Saved screeners: When you design your own screeners, you can save them for future use. This option will come in handy as you become experienced and proficient with screeners.
- Equity screener: This option is for finding and analyzing stocks. I work with this particular screener in the upcoming sections.
- Mutual fund and ETF screeners: When you’re looking for the right mutual fund or ETF, these screeners will help. (Check out Chapter 5 for an introduction to ETFs.)
- Future and index screeners: These categories are more for the speculators and traders in the world of futures and indexes, so I don’t cover them in this chapter (or book).
First up: The major categories
After you choose the equity (stock) screener in Yahoo! Finance, you have to address a few major categories first before you get to the “guts” of screening stock data (refer to Figure 16-1):
- Region: Here you enter data about your chosen country to refine your search. If you’re looking for U.S. stocks, the choice of course is “United States.” In the menu, you see countries with public stock exchanges ranging from Argentina to Vietnam.
Market cap: In the Market Cap (Intraday) category, you can designate the criteria for your search based on market capitalization and choose Small Cap, Mid Cap, Large Cap, or Mega Cap.
Looking for growth potential? Go for small cap or mid cap. Looking for more safety? Go to large cap or mega cap. Find out more about market capitalization in Chapter 1.- Price: In the Price (Intraday) field, enter criteria based on share price, such as “greater than” or “less than” your chosen price. There are also options for “equals” and “between.”
- Sector and industry: A sector is a group of interrelated industries. For example, the healthcare sector has varied industries such as hospitals, medical device manufacturers, pharmaceuticals, drug retailers, and so on. Choosing an industry rather than a sector narrows your choices, as you find out in the earlier section “Choosing the category.” Flip to Chapter 13 for more information on sectors and industries.
The main event: Specific filters
After you make choices in the major categories covered in the preceding section, you drill down to find stocks that meet your standards with various filters. I don’t cover all the metrics here since there are literally too many to cover, but in the following sections, I briefly touch on the most relevant subcategories and then you can dive in. (To get to these filters in the Yahoo! Finance screener, just click Add Another Filter, as shown in Figure 16-1.)
Share statistics
In the Share Statistics menu in the Yahoo! Finance screener, you find over 40 stock-related criteria ranging from share price action (the 52-week high or low) to fundamentals such as total assets or total liabilities. One area I like to focus on is the price-to-earnings (P/E) ratio. This ratio is one of the most widely followed ratios, and I consider it the most important valuation ratio (it can be considered a profitability ratio as well). It ties a company’s current stock price to the company’s net earnings. The net earnings are the heart and soul of the company, so always check this ratio.
All things being considered, I generally prefer low ratios (under 15 is good, and under 25 is acceptable). If I’m considering a growth stock, I definitely want a ratio under 40 (unless there are extenuating circumstances that I like and that aren’t reflected in the P/E ratio).
 Generally, beginning investors should stay away from stocks that have P/Es higher than 40, and definitely stay away if the P/E is in triple digits (or higher), because that’s too pricey. Pricey P/Es can be hazardous, as those stocks have high expectations and are very vulnerable to a sharp correction. In addition, definitely stay away from stocks that either have no P/E ratio or show a negative P/E. In these instances, it’s a stock where the company is losing money (net losses). Buying stock in a company that’s losing money is not investing — it’s speculating.
Make sure your search parameters have a minimum P/E of, say, 1 and a maximum of between 15 (for large cap, stable, dividend-paying stocks) and 40 (for growth stocks) so that you have some measure of safety (or sanity!).
If you want to speculate and find stocks to go short on (or buy put options on), two approaches apply:
- You can put in a minimum P/E of, say, 100 and an unlimited maximum (or 9,999 if a number is needed) to get very pricey stocks that are vulnerable to a correction.
- A second approach is putting in a maximum P/E of 0, which would indicate that you’re searching for companies with losses (earnings under zero).
Income
In the Income menu in the Yahoo! Finance screener, there are some important metrics tied to sales and profits. Keep in mind that income in terms of sales and profits are among your most important screening criteria.
For sales revenue (called Total Revenue in the Yahoo! Finance tool), there may be absolute numbers or percentages. In some stock screeners, there may be ranges such as “under $1 million in sales” up to “over $1 billion in sales.” On a percentage basis, some stock screeners may have a minimum and a maximum. An example of this is if you wanted companies that increased their sales by at least 10 percent. You’d enter 10 in the minimum percentage and either leave the maximum blank or plug in a high number such as 999. Another twist is that you may find a stock screener that shows sales revenue with an average percentage over three or five years so you can see more consistency over an extended period.
Profit margin (called Net Income Margin % in the Yahoo! Finance tool) is basically what percent of sales is the company’s net profit. If a company has $1 million in sales and $200,000 in net profit, the profit margin is 20 percent ($200,000 divided by $1,000,000). For this metric, you’d enter a minimum of 20 percent and a maximum of 100 percent because that’s the highest possible (but improbable) profit margin you can reach.
Keep in mind that the data you can sift through isn’t just for the most recent year; some stock screeners give you a summary of three years or longer, such as what a company’s profit margin has been over a three-year period, so you can get a better view of the company’s consistent profitability. The only thing better than a solid profit in the current year is a solid profit year after year (three consecutive years or more).
Valuation measures
For value investors (who embrace fundamental analysis), the following parameters are important to help home in on the right values (check out Appendix B for more details on ratios):
- Price-to-sales ratio: A price-to-sales (PSR) ratio close to 1 is positive. When market capitalization greatly exceeds the sales number, then the stock leans to the pricey side. In the stock screener’s PSR field, consider entering a minimum of 0, or leave it blank. A good maximum value is 3.
- PEG ratio: You obtain the PEG ratio (price/earnings to growth) when you divide the stock’s P/E ratio by its year-over-year earnings growth rate. Typically, the lower the PEG, the better the value of the stock. A PEG ratio over 1 suggests that the stock is overvalued, and a ratio under 1 is considered undervalued. Therefore, when you use the PEG ratio in a stock screening tool, leave the minimum blank (or 0), and use a maximum of 1.
Other valuation ratios: Some stock screeners may include other ratios. A good one is the average five-year ROI (return on investment), which gives you a good idea of the stock’s long-term financial strength. Others may have an average three-year ROI.
Because this is an average (in percentage terms) over five years, do a search for a minimum of 10 percent and an unlimited maximum (or just plug in 999 percent). If you do get one that’s anywhere near 999 percent, by the way, call me and let me know!
Dividends and splits
For income-minded folks, go to the Dividends and Splits menu in the Yahoo! Finance screener to enter criteria such as Dividend Per Share (DPS) and Dividend Yield %. For more information on dividends, head to Chapter 9.
ESG scores
For many investors in recent years, nonfinancial and nonmarket aspects of corporate governance have gained greater importance. In the category of ESG Scores (environmental, social, and governance criteria) in the Yahoo! Finance screener, you can enter aspects of corporate behavior that you seek (or want to avoid) in the public company that you’re considering for investment.
Checking Out an ETF Screening Tool
In addition to stock screeners, there are also screeners for bonds, mutual funds, and now exchange-traded funds (ETFs; see Chapter 5). Figure 16-2 is a typical ETF screener like many online.
You won’t find minimum and maximum with ETF screeners as much as with stock screeners. There are more varied categories to filter through and different performance criteria. The following sections cover the main categories.
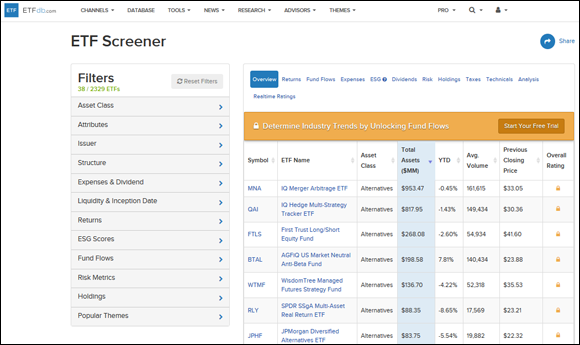
Courtesy of ETFdb.com
FIGURE 16-2: A typical ETF screening tool.
Keep in mind that most of the popular financial sites (such as Yahoo! Finance and MarketWatch) have good ETF screeners (as well as stock screeners); most of the stock brokerage sites have search and screening tools as well. Some other popular sites that have ETF screening tools include the following:
- ETF.com (
www.etf.com) - ETF Database (
www.etfdb.com/screener); you see this screener in Figure 16-2 - ETF Screen (
www.etfscreen.com)
Asset class
Choosing your asset class is the first search criteria, and of course in a book like this, the focus is stocks (equity). However, this category shows the range of choices that ETFs have to offer. There are ETFs that concentrate on bonds, currencies, precious metals, real estate, basic commodities, or “multi-asset” portfolios. There are also inverse ETFs, which have within their portfolio speculative derivatives such as put and call options (found in the asset category called “alternatives”).
Attributes
In the Attributes category in the ETF Database tool (refer to Figure 16-2), you can choose Active, Passive, or Any. ETFs, by and large, are passive, meaning that the portfolio isn’t actively managed like a typical mutual fund portfolio. However, in recent years some ETFs have become more active in their portfolios (meaning more active buying and selling of positions within the portfolio). If you aren’t sure, just click Any as your choice.
Issuer
Looking for an ETF that was issued by a financial institution such as iShares, State Street SPDR, or VanEck? If the issuer is an important consideration, check out the comprehensive list of financial firms that issue and sponsor ETFs.
Structure
Although you’re most likely looking for a conventional ETF, you can find other structures, such as a commodity pool or exchange-traded notes (ETNs). For most beginners, the standard ETFs are fine.
Expenses and dividends
In the Expenses & Dividend category in the ETF Database screener, you can perform your search using an expense ratio and/or a dividend yield. Maybe you want an ETF with a relatively low expense ratio — say, under 2 percent. You can then adjust your search with this criteria, and the search will exclude all ETFs with expense ratios higher than 2 percent.
As for the dividend yield (and you know I am a big fan of dividends if you read earlier chapters), you can adjust it based on your preference. Indicate that, for example, you want ETFs with a minimum yield of 2.5 percent, and the screener will exclude all ETFs with a reported dividend yield lower than that percentage.
Liquidity and inception
The typical criteria in the Liquidity & Inception Date category shown in Figure 16-2 are the following:
- Assets ($MM): This field measures the market capitalization of the ETF in case you want to make sure that you’re buying a large ETF versus a smaller ETF that has a lower market capitalization. For novice ETF investors, go for the higher market capitalization (larger asset size).
- Average Daily Volume: This field refers to how many shares of a particular ETF are traded in the market on a typical trading day. Novice ETF investors want a higher trading volume, which indicates greater liquidity and hence is easier to buy and/or sell.
- Share Price: Here you indicate whether you have a limit as to share price. For example, if you can afford ETFs only at $50 per share or lower, use that criteria. Easy!
- Inception Date: Here you put in the criteria, if you wish, regarding how long an ETF has been around. All things being equal, an ETF around for 15 years or longer is a safer investing vehicle to choose than one that started just last year.
Returns
Looking for ETFs based on how well they have performed over a year or longer? Then the Returns search criteria shown in Figure 16-2 is for you. You can designate a time frame such as year to date or a longer one such as one year, three years, or five years.
I take seriously the admonition that “past performance is not necessarily indicative of future results,” but check out the returns since they help confirm that an ETF’s portfolio is a good consideration. After all, all things being equal and you’re choosing between one ETF that went up 87 percent in the past three years and another ETF that dropped 12 percent in the same time frame, your choice should be a no-brainer (Put away that coin! No heads or tails here).
ESG scores
Are social or other nonfinancial considerations important to you? Perhaps you’re worried about the environmental effects of corporate activity. Maybe moral considerations are important because you want to invest in companies that are “good citizens” or that do not exhibit practices you disagree with. Given that, the ESG Scores category in Figure 16-2 will be a prime consideration in your search criteria.
In the ETF Database screener, there is a single composite ESG score ranging from 0 to 10, with 10 being the most favorable — the higher, the better.
Fund flows
The Fund Flows metric in the ETF Database screener tracks how much money is flowing into an ETF over a given period such as one week, one year, or five years. Fund flow essentially means that when you tally money coming into and out of various financial assets, you can gauge the popularity (or unpopularity) of a given asset. If there is a net inflow of money for a given asset, then ETFs with that asset are in a bullish position (and that’s a good thing for your ETF’s share price).
Risk
The Risk Metrics category in Figure 16-2 touches on volatility and beta characteristics of a particular ETF. It also includes the price-to-earnings (P/E) ratio if available. You can find out whether an ETF has lower or higher volatility (compared to the total market).
Higher volatility means ultimately greater risk. A tech stock ETF, for example, has higher volatility than a utilities stock ETF. ETFs with portfolios that have a higher P/E ratio can be riskier than those with a lower P/E ratio. The bottom line is that if you’re concerned about risk, select search criteria with low P/E ratio and low volatility. Flip to Chapter 4 for more about risk.
Holdings
Holdings criteria cover what asset(s) are in an ETF. Does the ETF have one asset or 50? In addition, this category covers how balanced and deep an ETF is relative to its peer group. In other words, is this ETF’s holdings in the top 10 percent, 15 percent, or 50 percent of their peers in the category?
Themes
You can see the top ETFs in terms of popular themes in the final category in Figure 16-2. At the time of writing, the most popular themes are artificial intelligence, blockchain, marijuana, and FAANG (referring to Facebook, Apple, Amazon, Netflix, and Google).
The problem here is that what is popular today may not do well next year, so novice investors should focus on long-term profitability and the fundamentals for more assured success over time.
A Few Final Points to Keep in Mind
Listen: Don’t go nuts with all the parameters and search criteria because you want to find the “perfect stock” (although if you do find it, let me know). For investors, your best approach is to use criteria that focuses on the key fundamentals:
- A winning sector/industry: Make sure that the sector/industry is enduring and growing. This is why I focus on “human need” such as food and beverage, utilities, and so on.
- Market leadership: Does the company rank among the best in its industry?
- Profit: Make sure the company is consistently profitable.
- Sales: Make sure the company has growing sales.
- A good balance sheet: Ensure that assets are greater than liabilities (in other words, the company has low debt).
- Dividends: Where possible, make sure the company has dividends.
That should hold you for now, grasshopper. Now go forth and search!