Chapter 2
Knowing Your Business

What’s in this chapter:
- Understanding how your organization makes money and its business model.
- Understanding how your business tracks its money flow and ultimate net profit.
- How to identify and understand your stakeholders so you can increase their support and alignment with your business goals.
The first step in the Strategic Learning Alignment Model is Knowing Your Business—the foundation on which you can build value for your business partners. Knowing your business is about understanding how your organization makes money, which includes understanding the key elements of revenue, expenses, and profit. It is also about understanding your business partners’ key financial metrics and why these are important to them. This knowledge allows you to identify strategic opportunities for learning to add the most impact to your business. And it also enables you to speak the language of your key stakeholders and helps you build the business case for your learning solutions.
Mention business financials and the discomfort begins for many people as balance sheets, income statements, and financial ratios immediately come to mind. Rather than being an expert at calculating financial ratios or creating income statements, you need to interpret the basics of this financial data to spot issues and identify how business strategy, external trends, and the marketplace affect these numbers. No one, including your business partners, expects learning professionals to be financial experts. However, you do need to understand your organization’s basic business model and business drivers. The good news is that only a basic understanding of business and financial data is required for learning professionals. To use an old adage, you don’t need to know all the specifics of how your watch is made, you just need to know how to read the time.
For many years, business leaders viewed learning professionals solely as functional specialists or “trainers.” As learning professionals, we have perpetuated this viewpoint by not readily identifying ourselves as businesspeople, not speaking the “language” of business, and not understanding or using the tools of business. However, where do we work? We work in business! We are both functional specialists and businesspeople. In the book Finance Intelligence for HR Professionals (Berman and Knight 2008, 21), John Hofmeister, the president of Shell Oil, sums this up aptly when he says that “anyone working in a business is a businessperson—so human resources people, for example, are businesspeople with a specialty in human resources.”
A study by the U.S. Securities and Exchange Commission found that only half of all American adults could pass a basic financial literacy test. How many professionals sit in business meetings every day and don’t understand a business concept or financial term? Not wanting to look stupid in front of others, they just keep quiet rather than ask for clarification. Learning professionals cannot afford to be in this silent group.
This chapter provides a basic primer on business acumen for the learning professional, in three sections:
- How does your business make money?
- What is your company’s business model?
- How does your business track its money flow and ultimate net profit?
After we consider this business acumen primer, I’ve also included a section on strategies and tools for applying your business knowledge so that you can better understand your stakeholders’ needs. In addition, we’ll look at strategies and tools for managing your relationships with these stakeholders. You will find that the knowledge you gain from this chapter can be used in preparing business cases and communications for learning.
The statements in worksheet 2-1, a business language quiz, are direct quotations from business leaders captured from their conversations with learning professionals. These quotations are good examples of the language of business. Even if you score well on the quiz, this chapter will serve as a refresher. And if you miss any items in the quiz, by the close of this chapter you will have the knowledge to make the correct choices.
How Does Your Business Make Money?
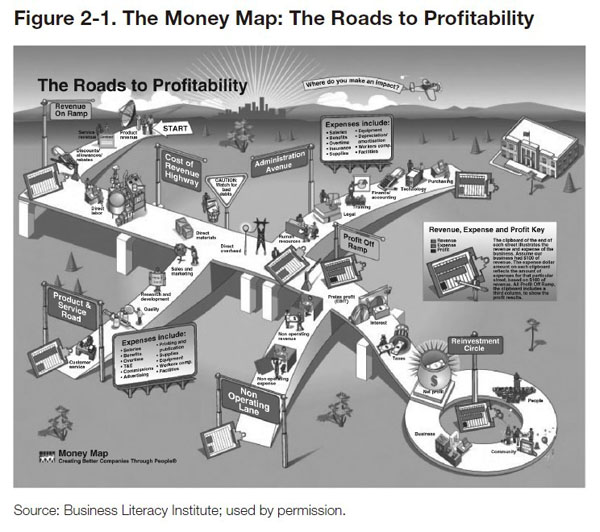
Virtually every business involves revenue, expense, and profit. The money map, figure 2-1, uses the visual metaphor of a highway system to illustrate how money flows through a business as revenue flows in, expenses flow out, and what remains is profit. This map of roads to profitability, which was created by the Business Literacy Institute, provides an easy-tounderstand visual of how a business makes money.
Worksheet 2-1. Business Language Quiz
Match the numbered statements with the “translation” choices; each translation will only be used once. For the correct answers, see page 42—but don’t peek before you try the exercise!
1. ____ “Our DSO ranks in the bottom third of our industry.”
2. ____ “We’re losing margin due to the increased prices of direct materials.”
3. ____ “Revenue volume is up, but we’re not seeing that transfer to price realization.”
4. ____ “SG&A is increasing.”
5. ____ “Channel development is key.”
6. ____ “Inventory turns are slowing.”
7. ____ “Our expense in warranties is trending upward from last year’s figures.”
Matching “translation” choices:
- Our profit is decreasing as we pay higher prices for manufacturing materials.
- We are not collecting our accounts receivables as fast as we should.
- We are incurring more costs due to poor quality of our products.
- Although our sales are high, our salespeople are offering too many discounts such as free freight.
- Profitable selling through our third party is important.
- Overhead costs are not trending positively.
- We are not syncing demand and timely delivery between our sales, warehouses, and operations.
Typically, a business is selling a product or service to a buyer for more than what it costs the business to make, sell, and deliver. The cash proceeds of the sale are referred to as revenue. However, this does not equal net profit (profit minus expenses) for the business. It costs money to make and sell the product or to deliver the service. Some of these costs are more directly linked to the making, selling, and/or delivery of the product or service. A few examples of these direct costs are materials, manufacturing labor, equipment, advertising, sales salaries, and commissions. There are also more indirect costs that go to support the overall business’s efforts in making, selling, or delivering the product or service. Indirect costs are support or “administration,” including such services as human resources, legal, training, and finance. The direct and indirect costs are subtracted from the revenue the seller received.
Business leaders view indirect or administrative costs as “overhead” and not directly related to generating profit. This underscores the importance of aligning your learning with the business to ensure that you are clearly contributing to achieving net profit. At the end of the day, this is what interests business leaders.
So, now that direct and indirect costs have been subtracted, does the business get its profit from the revenue it has collected? Not quite yet. There are still other expenses, such as interest on loans and taxes, that must be deducted. Then the business can collect its profit, which is referred to as its net profit. Viewed as a formula, this would be
Profit – (Direct costs + Indirect costs) = Net profit
These same basic building blocks of business exist whether the business is a company or a multinational Fortune 100 business. All these steps in the business process offer opportunities for you, as a learning professional, to affect the business’s net profit. Understanding the basics of how your business makes its net profit is required for you to add value back to the business. A host of other tools to build your business acumen can be found on the Business Literacy Institute’s website (www.business-literacy.com). Different levels of stakeholders in your business will focus on different aspects of revenue, expenses, and profit. Senior leaders will focus on the entire “highway system” of profitability.
What Is Your Company’s Business Model?
From the general components of any business (revenue, expenses, profit) we now move to the way a particular company makes money. This is called the company’s business model. Think of a business model as a blueprint for how a company implements its strategy. It gives you a big-picture snapshot of your company’s strategic priorities and how your company is designed to make money. Understanding how your company makes money is important for you as a learning professional. This knowledge can help you understand the key levers that drive the entire business, helping you to align your strategic learning solutions with these levers. In Business Model Generation, Alexander Osterwalder and Yves Pigneur (2009) identify nine building blocks of a business model:
- customer segments—customers grouped by common needs, behaviors, and attributes
- value propositions—how a product or service solves a customer’s problem or satisfies a need
- channels—how a company communicates and reaches its customers
- customer relationships—the level of relationship, ranging from highly personalized to automated services
- revenue streams—cash generated from customer segments
- key resources—the physical, financial, and human resources required to implement the business model
- key activities—the most important actions for the company to operate successfully
- key partnerships—the company’s network of suppliers and partners
- cost structure—the most important costs incurred for the company to operate successfully.
A familiar business model is that of Wal-Mart, the discount department store and chain of warehouses. In 2010, the Forbes Global 2000 (based on revenue size) named Wal-Mart the world’s largest public corporation. Wal-Mart’s business model is a low-price strategy, “everyday low prices.” It accomplishes this through economies of scales in purchasing, advanced inventory and shelf management, and leveraging “float” or interest-free loans by paying its suppliers in 90 days while selling its products within seven days. Learning solutions for Wal-Mart will thus emphasize supply chain management to ensure that its purchasing and inventory capabilities are strong.
Gillette (owned by Procter & Gamble) uses a different business model. Gillette, which manufactures disposable razors and other personal care products, sells the razor handle at a low cost, knowing that its profit comes from sales of disposable blades that fit the razor handle. It spends a great deal of money on research and development and heavily patents its products to ensure that they dominate the razor blade market. Learning solutions for this type of business model will emphasize innovation and strategic product management.
The fast food giant McDonald’s Corporation, the largest restaurant chain in the world, uses yet another type of business model. Its model is one of speed, quality, consistency, and real estate. Standardized meals and drinks produced with an assembly-line workflow create the speed— hence “fast” food. McDonald’s uses standardization to create a consistent customer experience from one restaurant to another. It sets tight quality standards for its franchises. And its standardization of meals also allows it to gain economies of scale in food purchasing. A big part of its business model is real estate, because it subleases to its franchisees. Knowledge of McDonald’s business model helps those involved in the learning function understand the importance of and emphasize standard work practices.
Figure 2-2. The Business Model Canvas
| Key
Partners (Company’s network of suppliers and partners ) |
Key
Activities (The most Important actions for the company to operate successfully) |
Value
Propositions (How product or service solves a customer’s problem or satisfies a need) |
Customer
Relationships (Level of relationship from highly personalized to automated services) |
Customer
Segments (Customers grouped by common needs, behaviors and attributes) |
| Key
Resources (Physical, financial, and human resources required to implement the business model) |
Channels (How a company communicates and reaches its customers) |
|||
| Cost Structure (Most important costs incurred for the company to operate successfully) | Revenue Streams (Cash generated from customer segments) | |||
Source: “Business Model Canvas” (www.businessmodelgeneration.com). This work is licensed for public use under the Creative Commons Attribution-Share Alike 3.0 Unported License (http:// creativecommons.org/licenses/by-sa/3.0/). |
||||
In Business Model Generation, Osterwalder and Pigneur incorporate their nine business model building blocks into a visual Business Model Canvas, which is shown in figure 2-2. The business strategy and how the business is designed to make money are captured in a one-page snapshot.
Figure 2-3 depicts a Business Model Canvas for a personal products company. The company’s business model emphasizes recurring revenue streams through disposable products. For the consumer, the initial razor handle purchase is inexpensive or even free. The ongoing, recurring purchase is the blades. The blades are disposable and are sold at a high margin or profit. Its key resources include a patent strategy that blocks other consumer product companies from gaining market share from this personal products company.
How Does Your Business Track Its Money Flow and Ultimate Net Profit?
Although the business model maps the way a business makes money, financial statements show you how the company is performing. Think of these financial statements as a scoreboard for business performance showing how money flows through a business, where it comes from, where it goes, and what ends up being net profit to the business. So to understand how your business tracks its money flow and ultimate net profit, you need to have a basic understanding of three main financial statements:
- the income statement
- the balance sheet
- the statement of cash flows.
Understanding the basics of these financial statements will help you answer these questions about your business:
- Is your business profitable?
- Are your revenues growing or decreasing?
Figure 2-3. A Business Model Canvas for a Personal Products Company
| Key
Partners (Company’s network of suppliers and partners ) Manufacturers and retailers |
Key
Activities (The most Important actions for the company to operate successfully) Marketing, research and development, and logistics |
Value
Propositions (How product or service solves a customer’s problem or satisfies a need) Razor handle Blades |
Customer
Relationships (Level of relationship from highly personalized to automated services) Locked in with proprietary razor handle purchase |
Customer
Segments (Customers grouped by common needs, behaviors and attributes) Adult men primary segment, growing adult women segment in North America |
| Key
Resources (Physical, financial, and human resources required to implement the business model) Brand and patents |
Channels (How a company communicates and reaches its customers) Retail stores |
|||
| Cost Structure (Most important costs incurred for the company to operate successfully) Manufacturing, marketing, research and development, and logistics |
Revenue Streams (Cash generated from customer segments) One-time handle purchase, frequent blade replacements |
|||
Source: Adapted by the author from “Business Model Canvas” (www.businessmodelgeneration.com). This work is licensed for public use under the Creative Commons Attribution-Share Alike 3.0 Unported License (http://creativecommons.org/licenses/by-sa/3.0/). |
||||
- How effectively is your business using its assets?
- How efficient is your business in collecting the money it is owed by customers?
- How effective is your business in clearing out inventory?
- How effective is your business at controlling costs?
- Does your company have a low, moderate, or high rate of debt?
- How well is your business positioned to withstand an economic downturn?
- How does your business compare with other industry competitors?
It’s not necessary that you memorize or practice calculating financial formulas; you just need to understand why a few of these data points are important to your business leaders. Don’t sweat the formulas—just follow the money!
The examples used in the rest of this section represent financial statements from a multi-billion-dollar global industrial manufacturing company, “Company X.” The company is fictional, but the financial statements are representative of a large manufacturing company. Many sources used to teach the basics of financial statements utilize overly simplified examples. Financial statements reflecting the simplicity of a teenager’s lawn-mowing company do not remotely resemble the financial statements of more complex businesses. Though these do address the theory behind the financial statements, these simplistic examples do not prepare the learner to view and understand the real thing. In this book, we use real-life, publicly available financial statements, but do not identify the company.
Business is numbers oriented. Financial statements are used to report these numbers to assess business performance. To ensure alignment, learning professionals must understand the numerical performance metrics with which their business leaders are measured. By understanding the key financial indicators, a learning professional can track business trends and identify critical performance opportunities for the business. This enables the learning to support the business with strong alignment and a proactive approach to adding value.
The Income Statement: Is Your Business Profitable?
It is important for learning professionals to understand how profitable their company is at any given time. Imagine requesting a large learning investment from senior executives without knowing the state of the business. If profits are down, your investment request will only serve to highlight your disconnection from the business. So instead, how can you, as a learning professional, proactively offer learning solutions to improve your company’s levels of profitability?
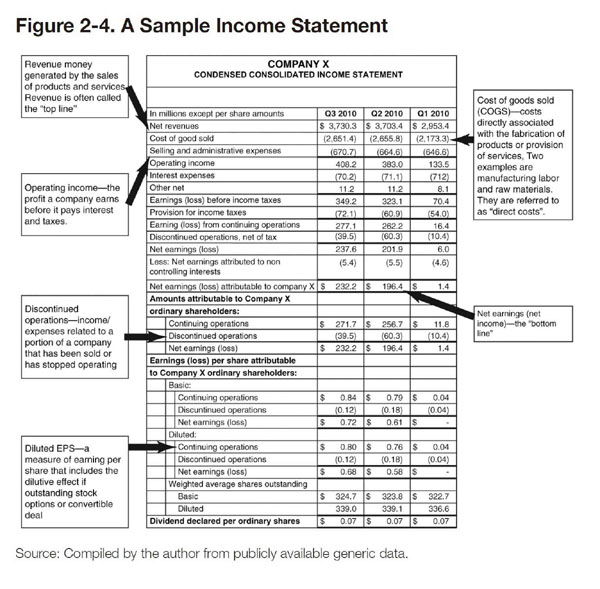
One tool for determining a company’s profitability is its income statement. The income statement is sometimes referred to as a profitand-loss statement, or P&L, or earnings statement. This statement shows revenues (sales), expenses, and profit for a defined period of time. Ultimately, it measures your company’s profitability. Important components include the metrics of the gross margin and the operating margin. Figure 2-4 depicts an income statement.
The Gross Margin
The gross margin measures your company’s manufacturing and distribution efficiency during production. Higher margins show better performance. If your company has high gross margins, it will have more money left over to spend on other business operations, such as research and development or marketing.
Here are the basic aspects of the gross margin, organized as bare-bones formulas and sample calculations (note that Q1 = the first quarter of a four-quarter fiscal year, and that all revenues and cost of goods sold are in millions of dollars):
- Formula: (Revenue – Cost of goods sold) / Revenue.
- Purpose: Measures the percentage of sales retained after production costs are incurred.
- Q1 2010: (2,953.4 – 2,173.3) / 2,953.4 = 26.4%.
- Q2 2010: (3,703.4 – 2,655.8) / 3,703.4 = 28.3%.
- Q3 2010: (3,730.3 – 2,651.4) / 3,730.3 = 28.9%.
- Q2 2010 average among Company X’s peer companies: 31.2%.
The Operating Margin
Operating margins measure your company’s pricing strategy and operating efficiency. Again, higher margins are better. Your business leaders look closely at the operating margin to determine if their pricing management is effective. They also look at the operating margin to determine if the operating expenses of the company are too high. These expenses include selling, general, and administrative costs, referred to as SG&A. The learning function is typically considered part of SG&A, or “overhead.”
Here are the basic aspects of the operating margin, again organized as bare-bones formulas and sample calculations (note that Q1 = the first quarter of a four-quarter fiscal year, and that all revenues and cost of goods sold are in millions of dollars):
- Formula: Operating income / Revenue.
- Purpose: Measures the profitability of a company before interest and tax expenses.
- Q1 2010: 133.5 / 2,953.4 = 4.5%.
- Q2 2010: 383.0 / 3,703.4 = 10.3%.
- Q3 2010: 408.2 / 3,730.3 = 10.9%.
- Q2 2010 average among Company X’s peer companies: 11.8 percent.
Earnings per Share From Continuing Operations
Most income statements include a calculation of earnings per share, or EPS. This calculation tells you how much money shareholders would receive for each share of stock they own if the company distributed all its net income for the period.
Here are the basic aspects of earnings per share, again organized as bare-bones formulas and sample calculations (note that Q1 = the first quarter of a four-quarter fiscal year, and that all revenues and cost of goods sold are in millions of dollars):
- Formula: Net earnings attributable to company shareholders / Weighted-average diluted shares outstanding.
- Purpose: Measures the profitability of a company.
- Q1 2010: 11.8 / 336.6 = $0.04.
- Q2 2010: 256.7 / 339.1 = $0.76.
- Q3 2010: 271.7 / 339 = $0.80.
Summing Up
Why are an income statement and its key metrics useful to a learning professional? Understanding the components of profitability enables a learning professional to identify learning solutions that will drive increased profit. For example, if operating margins are lower than forecast, a number of potential learning solutions could be applicable. Perhaps the sales force is discounting products at a high rate, causing decrease margins. Possible learning solutions on negotiation skills and pricing management could be useful here. If the G&A (general and administrative costs) are higher than target, there is an opportunity to reduce the expenses incurred by your learning function. Perhaps you could increase your use of virtual delivery to decrease overall company travel expenses. Or minimally, you may delay your request for additional headcount resources for your learning function.
The Balance Sheet: What Is Your Company Worth?
As a learning professional, you need to understand what your company owns and what it owes at a given point in time. In addition to understanding what is needed to drive profitable growth, learning professionals should also be aware of how much debt and other liabilities it takes to create that profit. If their company has a heavy amount of debt, it would not be wise for a learning leader to request a large dollar investment that would require the company to borrow even more funds. Through understanding a company’s debt and other liabilities, a learning professional can provide learning solutions resulting in improved time to payment from customers or in increased movement of inventory into cash. The company balance sheet provides this information for the learning professional.
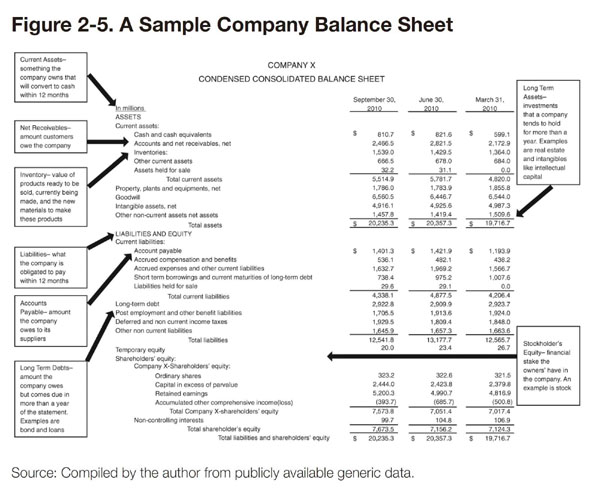
The company balance sheet, shown in figure 2-5, depicts your company’s financial position, including what it owns, what it owes, and the amount invested by shareholders. In other words, it tells what your company is worth. There are three major parts to the balance sheet: assets, liabilities, and shareholder’s equity. By design, the balance sheet must balance. The balance sheet goes beyond the income statement, which shows only profit. The balance sheet shows your company’s amount of debt. Your company could be making a profit, but it could also have high debt to fund the business operations.
The Debt-to-Equity Ratio
Your company’s assets (items of economic value) should be greater than its liabilities (debt). This allows your company to withstand periods of financial problems, such as a recession. When your company seeks loans, the prospective lenders look to see if your company’s balance sheet has manageable levels of debt compared with its assets. This signals your company’s ability to repay its debt.
Here are the basic aspects of the debt-to-equity ratio, again organized in a simple formula and sample calculations (note that Q1 = the first quarter of a four-quarter fiscal year, and that all revenues and cost of goods sold are in millions of dollars):
- Formula: Total liabilities / Shareholders’ equity.
- Purpose: Measures the amount of debt and equity financing a company is using.
- Q1 2010: 12,565.7 / 7,124.3 = 1.8.
- Q2 2010: 13,177.7 / 7,156.2 = 1.8.
- Q3 2010: 12,541.8 / 7,673.5 = 1.6.
Days Sales Outstanding
Anything your company owns that can potentially generate cash is considered an asset. Assets are listed on the balance sheet in order of how easily they can be converted to cash. Assets include the money owed your company by customers who purchased products or services on credit, known as accounts receivable. If customers do not pay on time, your company cannot pay other debts, because it has money tied up in the customers’ products or services. You want to see a high turnover, or shorter time elapsing between the customers’ receipt of products or services and payment of the invoice or bill. The more quickly your company can collect its accounts receivable, the less money it has tied up in these receivables and the more money it can use to pay its debts or reinvest in the company.
Here are the basic aspects of days sales outstanding, presented in a simple formula and with sample calculations (note that Q1 = the first quarter of a four-quarter fiscal year, and that all revenues and cost of goods sold are in millions of dollars):
- Formula: (Period ending net receivables balance / Current quarter revenues annualized) * 365.
- Purpose: Measures the average number of days a company takes to collect cash after a sale has been made.
- Q1 2010: (2,172.9 / 2,953.4 * 4) * 365 = 67 days.
- Q2 2010: (2,821.5 / 3,703.4 * 4) * 365 = 69 days.
- Q3 2010: (2,466.5 / 3,730.3 * 4) * 365 = 60 days.
- Q2 2010 average among peer companies: 59 days.
Inventory Turns
Another measurement of good asset management is how quickly your company sells its inventory of products. The faster your company turns over (sells) inventory (sells), the less money your company has tied up in its inventory. The longer inventory sits on your shelves, the longer the money invested in this inventory is unavailable to your company.
Here are the basic aspects of inventory turns, organized as a bare-bones formula with sample calculations (note that Q1 = the first quarter of a four-quarter fiscal year, and that all revenues and cost of goods sold are in millions of dollars):
- Formula: Current quarter cost of goods sold annualized / Period ending inventory balance.
- Purpose: Measures the number of times inventory is used in a period of time.
- Q1 2010: (2,173.3 * 4) / 1,364.0 = 6.4 turns.
- Q2 2010: (2,655.8 * 4) / 1,429.5 = 7.4 turns.
- Q3 2010: (2,651.4 * 4) / 1,539.0 = 6.9 turns.
- Q2 2010 average among peer companies: 6.8 turns.
Summing Up
Why are a balance sheet statement and its key metrics useful to a learning professional? Understanding how your company’s assets (items of economic value) compare with its liabilities (debt) helps you target learning that increases assets and decreases reliance on debt. For example, you might provide learning to the employees in the Accounts Receivable Department on how to negotiate payment from a customer. In another example, you could provide learning on integrated planning targeted to managers in sales, inventory, and operations. This could be an optimal time to demonstrate your learning function’s effectiveness at streamlining key processes, resulting in financial savings for the company.
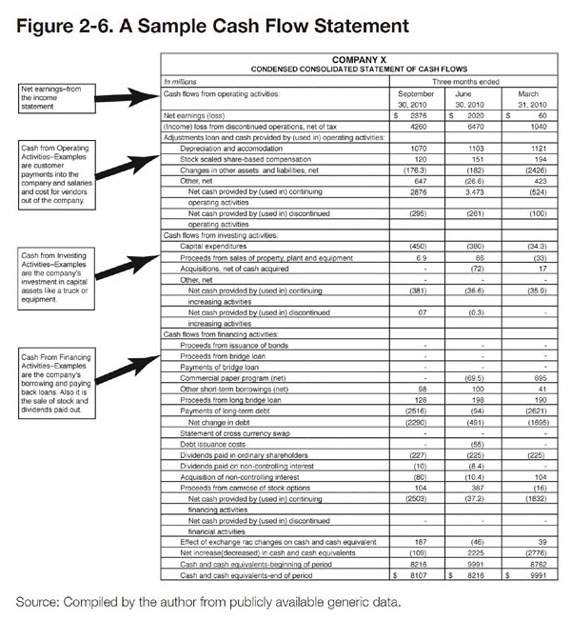
The Cash Flow Statement: How Does Your Company Source and Use Cash?
Understanding how cash flows in and out of the company helps the learning professional understand the health of a business and the strategic priorities of the business leaders. Is the company generating cash from its operations, signaling an efficiently run workplace? To what extent is the company investing its cash in research and development, signaling growth? Does the company have a high level of debt to pay down, signaling high interest expenses and limiting other investments? The cash flow statement provides answers to these questions.
The cash flow statement shown in figure 2-6 reports the cash generated and used during the time interval specified in its heading. The cash flow statement shows how a company is paying for its operations and future growth by detailing the “flow” of cash between the company and the outside world. Positive numbers represent cash flowing in; negative numbers represent cash flowing out. Simply put, this statement tells you where money comes from and where it is spent by organizing and reporting the cash generated and used in these three categories:
- Operating cash flow—often referred to as working capital—is the cash flow generated from internal operations. It includes the cash used to run the business; cash coming in from sales of the product or service; and cash going out to pay for salaries, vendors, raw materials, and the like.
- Investing cash flow is generated internally from nonoperating activities. It includes capital investments in plant and equipment or other fixed assets, or investment in research and development.
- Financing cash flow is the cash going to and coming from external sources, such as lenders, investors, and shareholders.
The most important of these three categories is cash flow from operating activities. A company needs to generate cash from its operations and cannot sustain itself on borrowing or its financial investments. You want the cash flow from operations to be at least equal to the net income profit. This tells you that the company is generating at least as much cash as it is reporting in its net income (profit) earnings. A company with a more positive cash flow is effective at turning its profits into cash. Having more cash available internally reduces the need for a company to borrow money and pay high interest rates.
The Return on Invested Capital
The return on invested capital (ROIC) is a commonly used financial measure that quantifies how well a company generates cash flow relative to the capital it has invested in its business. ROIC, in basic terms, is the amount of profit that a company earns for every $1.00 of capital invested in the business.
Here is the formula to calculate ROIC, accompanied by sample calculations (note that Q1, Q2, and Q3 indicate the particular quarter of the four-quarter fiscal year, and that the figures in the formula are in millions of dollars):
- Formula: Trailing quarter operating income (after tax) annualized / Period ending invested capital.
- Invested capital = Net receivables + Net inventory + Prepaid expenses and other current assets + Total noncurrent assets – Accounts payable – Accrued compensation and benefits – Other accrued expenses.
- Purpose: Measures the return management is generating on company-funded investments.
- Q1 2010: (133.5 * 0.80)*4) / (2,172.9 + 1,364.0 + 684.0 + 14,896.7 – 1,193.9 – 438.2 – 1,566.7) = 2.7%.
- Q2 2010: (383.0 * 0.80)* 4) / (2,821.5 + 1,429.5 + 678.0 + 14,575.6 – 1,421.9 – 482.1 – 1,969.2) = 7.8%.
- Q3 2010: (408.2 * 0.80)* 4) / (2,466.5 + 1,539.0 + 666.5 + 14,720.4 – 1,401.3 – 536.1 – 1,632.7) = 8.2%.
- Q2 2010 average among peer companies: 8%.
Summing Up
Why are a cash flow statement and its key metrics useful to a learning professional? Determining whether your company has a healthy cash flow can help you target high value learning solutions to increase positive cash flow. For example, you could provide learning for the entire workforce on how each employee contributes to positive cash flow. Each employee could enter a specific action and potential range of savings. Partnering with the Finance Department, you could track these quantitative improvements to cash flow. Recognizing cash flow opportunities and proactively recommending suitable learning solutions will strengthen your alignment with business partners.
Identifying and Understanding Your Stakeholders
The business acumen primer you have just reviewed will help you better understand the needs and wants of your key stakeholders, which is critical to your creating alignment with these stakeholders. Imagine living in a foreign country and not understanding the local language. How well would you truly get to know the local people? It is the same premise for learning professionals with our key stakeholders.
There are various definitions of stakeholders. Stakeholders typically have an interest (or stake) in a project, process, or initiative. They can be both internal and external to the organization. Here is a quick checklist to help you identify if a person or group is your key stakeholder:
- Do they control the resources you need or use?
- Can they block your project (process, initiative), either directly or indirectly?
- Do they have approval power over your work?
- Do they own a key process affected by your work?
- Do they have influence that shapes the thinking of other key stakeholders?
If you answered yes to any of these questions, you identified a stakeholder in your learning function. The learning function has a number of key stakeholders—including the CEO, other senior leaders, human resource leaders, information technology leaders, finance leaders, purchasing/sourcing leaders, employee managers, end users of the learning solutions, and external vendors, just to name a few. Within these groups are people who are more influential than other stakeholders. The sidebar on pages 38–39 gives a true scenario of a time, early in my career, when I did not understand the value of stakeholder management.
Once you identify and assess your key stakeholders, you are in a stronger position to align with and address their interests and concerns. In addition, you can now customize their engagement in your learning processes to match their interests and concerns. It is useful to ask others to provide input into your stakeholder identification and assessment. With this additional help, you may gain valuable new perspectives about the stakeholders. These aspects are explored further in worksheet 2-2 on stakeholder analysis.
Managing Stakeholders
The company was a large financial services organization that had just made a large acquisition. I was hired by its largest division—reporting to the division’s president—to help transform it into a customer-focused organization. The president was passionate about driving excellence, including our many customer service call centers, and he provided the funds to invest in top-notch learning solutions. I was co-located with him in the corporate office—sounds ideal.
I did not fully sense that he was a new leader to the company and thus had not fully built alignment with his vision among the other division leaders. But I began driving the customer-focused transformation, and it did not take long for me to hit a speed bump.
The division’s existing leadership team was a legacy from the acquired company. Although the team’s members nodded agreement with the new division president, their actions were the opposite. For instance, a train-thetrainer model was a key part of the learning rollout. The division’s call center leader—who was influential and outspoken—would rescind her resources at the last minute due to ostensible call volume increases and pull certified trainers into different, nontraining roles. This left me with canceled classes, wasted expenses, and little progress at the call center. Another key influencer was the head of finance. He felt all learning solutions were a complete waste of time and conveyed this openly and often. He made requesting funds for the transformation a complete nightmare. But the division president did not see this blocking behavior of his finance person and call center leader. I was convinced the answer was for me to quit the company.
At the time, I was in graduate school and was taking a course on organizational development, much of which was dedicated to managing change. The change management concepts started to sink in, I was exposed to stakeholder mapping as a tool to create alignment for change, and I began to use it at my current company. I could instantly see the landscape of stakeholders, their influence, and their level of support for customer-centered learning.
The call center leader was neutral at best toward the customer-focused transformation. But why was this happening? With further thought, I realized that she felt that the new division president and his new team were actually critiquing her leadership of the call center. She believed that she already had working solutions to drive customer excellence, and that this transformation had been imposed on her. Furthermore, I discovered that she had repeatedly asked for a capital expenditure to upgrade her facility but that it had been denied due to the company’s overall finances. How could I move her from a neutral level of nonopposition (I was optimistic) to a favorable level?
First, I formed a governance group, ensured that she had a key role, and asked the division president to sponsor it. We worked together to identify the why and the how of the customer-focused transformation. I shared with her the positive financial impact this initiative could have on reducing customer-mishandling calls and related fines. If she could be perceived as driving increased operating and financial performance, she might get the funds for her capital expenditure vision. Over time, she clearly began to feel part of the solution. I made sure that the division president recognized her efforts and was careful to manage the transformation as building on her past good work while moving us to an even greater customer focus. I positioned the train-thetrainer role as a high potential opportunity and retention tool, so the training skills could transfer beyond the current customer-focused initiative and help her build her own stronger training team.
Now, how could I reach the finance leader? He viewed the learning solutions and me as overhead expense. He was concerned that the fines we paid for poor customer service were negatively affecting our operating income. Certainly costly fines were negatively affecting the profit we generated from running the company. Armed with this knowledge, I pulled together the business reasons why we needed this transformation. Working with my division president, I presented this data at a monthly financial review meeting. We could clearly reduce the customer call mishandling errors that resulted in fines for us from the banks we served. This attracted his attention. In effect, even a 10 percent reduction in call mishandling fines would easily pay for the entire learning solution. I asked the finance leader to join our steering committee and sponsor our learning effectiveness measurement activities. He helped set the metrics and personally monitored the result.
By identifying who wielded the greatest influence, assessing their current level of support, and understanding their stake in the learning solutions, I was able to persuade the call center leader and the division’s other blockers to become supporters. A key factor is applying your understanding of how your business makes money and what performance metrics are most important to each stakeholder. The call center leader connected with the increased cash flow available from reduced fines and how this could be repositioned for a capital expense. The finance leader was focused on increasing earnings and reducing costs such as fines. Stakeholder management became a standard activity of the customer-focused transformation project and my learning function. We did achieve the results we targeted. I had the support and engagement of these two leaders throughout my tenure with this company. It was well worth the time it took to identify, assess, and manage my key stakeholders.
Worksheet 2-2. Stakeholder Analysis
Use this stakeholder analysis tool to assess your stakeholders and their level of influence. Engage other team members and leaders to help you with this exercise. Also, note the 1–5 rating on level of influence. The red, yellow, and green status rating shows current level of support of each stakeholder. Red indicates the stakeholder views your activity in a negative way; yellow indicates he or she is neutral, and green means the training is viewed favorably. The goal is to move all stakeholders to green.
Stakeholder Analysis: Use the worksheet to list stakeholders and assess their influence and supportiveness of the change initiative.
| Stakeholder | Role | Influence (1-5) | Unfavorable | Neutral | Favorable | Follow-Up Actions | Who | Date | Status |
| Stakeholder name | Role in the organization | Rate this individual’s level of influence in the organization: 1 = no/little influence; 5=highly influential | Place an “X” in the box that most closely depicts this individual’s attitude toward the change initiative. | Consult the matrix for tips on how to influence different stakeholders. | Team member accountable | Due date | Status (red, yellow, green) | ||
| Red | |||||||||
| Yellow | |||||||||
| Green | |||||||||
A person or group that fits one or more of these criteria should be on your stakeholder list:
- Controls critical resources
- Can block the change directly or indirectly
- Must approve certain aspects of the change
- Shapes the thinking of other critical constituents
- Owns a key process that is affected by the change.
Keep this document confidential!
Engaging business leaders in your key learning activities—such as governance, program design, and/or leaders as teachers—are all strategies to manage your stakeholders (see chapter 4). In the customer-focused transformation scenario highlighted earlier in the sidebar, the call center leader was recruited to serve on a learning governance board to increase her exposure to champions and to engage her in steering the learning solutions associated with the customer-focused transformation initiative.

Key Points for Knowing Your Business
- Business acumen is critical to creating alignment of learning with the business. Learning professionals are both functional specialists and businesspeople.
- Learning professionals need to know the basics of how any business makes money. Three important components are revenue, expense, and profit.
- In addition, learning professionals need to understand the business strategies and how their business implements this strategy. This is referred to as the company’s business model. A business model describes the way a particular company makes money.
- Financial statements are scoreboards for business performance, showing how the company is performing. The three key financial statements are the income statement, the balance sheet, and the cash flow statement. These will tell you if your company is profitable, what it is worth, and how it sources and uses cash.
- To truly know your business, you must know what aspects of the business are important to your various stakeholders. These are people who have a vested interest in your project, process, or initiative.
Exercise 1: How Does a Business Make Money?
Using the money map in figure 2-1 above, identify how your learning function can add value to the key elements of revenue, expense, and profit depicted on the map.
Exercise 2: Understanding Your Company’s Business Model
Using the business model canvas in figure 2-2 on page 23, below complete the nine building blocks for your business. To gain feedback on your responses, review your completed Business Model Canvas with a business partner. An additional option is to repeat this exercise with your learning team.
Note: A poster-size copy of this business model canvas is available at www.businessmodelgeneration.com. For the conditions of use, see http://creativecommons.org/licenses/by-sa/3.0/ke 3.0Unported License.
Exercise 3: Using Financial Statements for Further Analysis
Using the sample financial statements and referring to the accompanying text in this chapter, answer the following questions about this sample business. These questions should look familiar because they are the same questions that opened the discussion of financial statements in this chapter. (The correct answers are included at the end of these exercises.)
- Is the company profitable?
- Are its revenues growing or decreasing?
- How efficient is the company in collecting the money it is owed by customers?
- How efficient is the company in clearing out its inventory?
- How effective is the company at controlling costs?
- Does the company have a low, moderate, or high rate of debt?
- How well is the company positioned to withstand an economic downturn?
- How does the company compare with other industry competitors?
Exercise 4: Identifying and Understanding Your Stakeholders
Use the stakeholder analysis in worksheet 2-2 to identify and analyze two or three of your key stakeholders.
The correct answers to exercise 3 above on using financial statements for further analysis:
- Is the company profitable? YES. See the operating margin on the income statement.
- Are the revenues growing or decreasing? GROWING. Slight growth over previous quarter. See the net revenues on the income statement.
- How efficient is the company in collecting money it is owed from customers? SLIGHTLY BELOW AVERAGE. The company’s best performance was 60 days, while the peer average is 59 days. Calculated from the balance sheet—days sales outstanding.
- How efficient is the company in clearing out its inventory? ABOUT AVERAGE WITH ITS PEER COMPANIES. The company’s last inventory turn performance was 6.9 turns. Peer companies average 6.8 turns.
- How effective is the company at controlling costs? BELOW ITS PEER AVERAGE. Peer companies average 11.8% operating margin, while the company’s last quarter performance was 10.9%. This is calculated from the income statement.
- Does the company have a low, moderate, or high rate of debt? MODERATE. Calculated from the cash flow statement, the company’s debt-to-equity ratio in the previous quarter was 1.6. Its peer companies average 1.7.
- How well is the company positioned to withstand an economic downturn? IT MUST CONTINUE TO LOWER ITS DEBT AND INCREASE ITS OPERATING MARGIN TO ADEQUATELY WITHSTAND AN ECONOMIC DOWNTURN.
- How does the company compare with other industry competitors? ABOUT AVERAGE TO ITS PEER GROUP.
Correct answers to the business language quiz on page 19: 1—B; 2—A; 3—D; 4—F; 5—E; 6—G; 7—C.