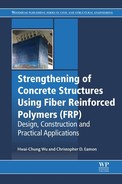
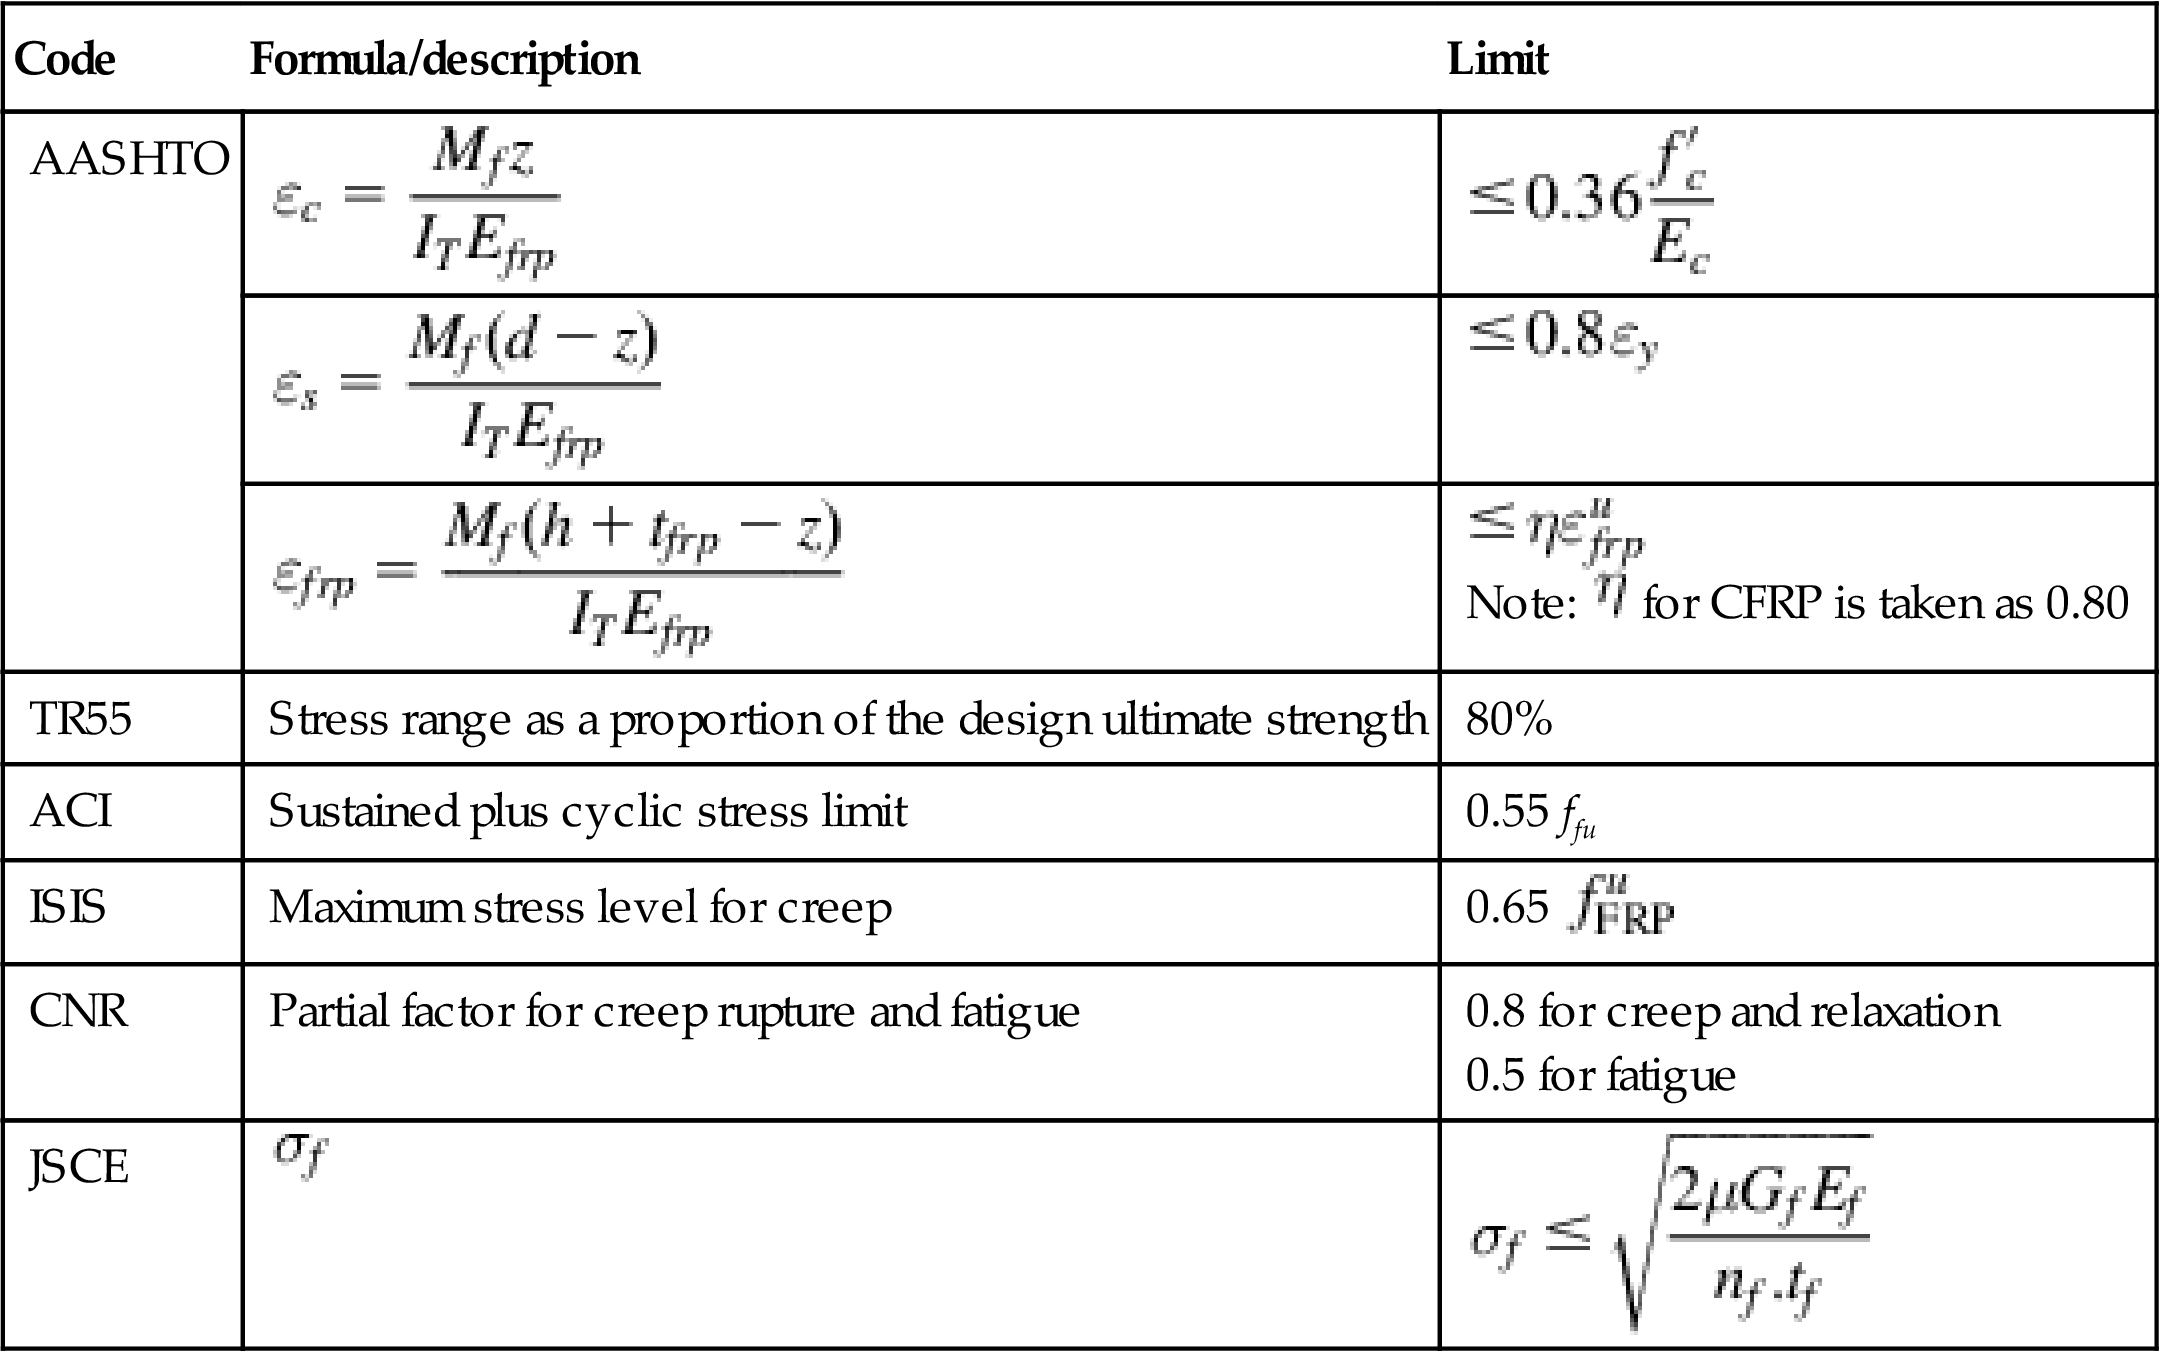
Fig. 4.12 summarizes reduction factors for carbon, aramid, and glass fiber to guard against creep rupture and fatigue. In general, ACI, AASHTO, and ISIS factors are similar, while ACI and AASHTO generally provide the most conservative factors.
4.2.8 End peeling
4.2.8.1 ACI
An end peeling failure frequently occurs due to a high stress at the FRP termination point causing a splitting away of the concrete cover at plane of the steel reinforcement. In ACI, to prevent this failure, the FRP reinforcement requires anchorage if the factored shear Vu at the termination point is greater than 2/3 of the concrete shear strength ![]() , or
, or
(4.37)
where
(4.38 – ACI 318, Eq. 11-3)
The anchoring is generally done using a transverse FRP U-wrap with an area ![]() .
.
4.2.8.2 AASHTO
The peel stress at the point of end termination of externally bonded reinforcement is required to meet following limit:
(4.39)
In which
(4.40)
where
(4.41)
![]() Poisson’s ratio of the adhesive, and is taken as 0.35.
Poisson’s ratio of the adhesive, and is taken as 0.35.
(4.42)
 (4.42)
![]() the characteristic value of the limiting shear stress in the adhesive (ksi). In the absence of experimental data a value of 5.0 can be used.
the characteristic value of the limiting shear stress in the adhesive (ksi). In the absence of experimental data a value of 5.0 can be used.
AASHTO discusses three possible modes of debonding at the termination point of an externally bonded FRP reinforcing system when the structure is subjected to shear and flexure. One possibility is critical diagonal crack debonding with or without concrete cover separation and plate-end interfacial debonding. In this case, if the FRP termination point is in a zone of high shear and the amount of steel reinforcement is insufficient, critical diagonal cracking may occur. In such cases a critical diagonal shear crack forms and intersects the FRP, then propagates toward the end of the member. A second possibility occurs in beams with higher amounts of existing steel shear reinforcement, instead of a single critical diagonal crack, multiple diagonal cracks of smaller width may occur. In this case, concrete cover separation is generally the controlling debonding failure mode. Here, failure of the concrete cover is initiated by a crack near the FRP termination point. The crack then propagates to and then along the level of the steel tension reinforcement. This mode of failure has been demonstrated experimentally for beams with externally bonded steel plates and FRP reinforcement, and is the mode of failure discussed in Section 4.2.8.1.
A third possibility occurs when high interfacial shear and normal stresses near the end of the FRP exceed the strength of the weakest element, generally the concrete, and plate-end interfacial debonding is initiated. Debonding in this case propagates from the FRP termination point toward the middle of the structural member, near the FRP–concrete interface. Note that this failure mode is only likely to occur when the FRP is significantly narrower than the beam section. AASHTO does not quantify a threshold for a ratio at which debonding initiates and propagates.
Although a wide range of predictive models that include numerical, fracture mechanics, data-fitting, and strength of material-based methods have been developed to address end peeling failures (Yao, 2004), AASHTO recommends a simplified equation based on the approximate analysis of Roberts (1989). At present, AASHTO does not specify a standard test method for determining the peel strength of an FRP reinforcement system from the concrete surface. However, AASHTO recommends for this purpose the use of ASTM Standard Test Method D 3167, Standard Test Method for Floating Roller Peel Resistance of Adhesives (2010). The ASTM method can be used for determining the peel resistance of adhesive bonds between rigid and flexible surfaces adhered together. For cases in which the peeling occurs within the concrete layer, AASHTO recommends that the peeling strength be limited to ![]() and if the peeling stress exceeds
and if the peeling stress exceeds ![]() , mechanical anchors at the FRP termination point must be used.
, mechanical anchors at the FRP termination point must be used.
4.2.8.3 TR55
TR55 refers to early research on FRP separation failure and suggests a number of possible approaches for combating this problem, including: the use of plate-end anchorage devices, flexible adhesives, and imposing limits on the plate aspect (i.e., breadth/thickness) ratio. Bolted systems, bonded angle sections and composite straps bonded across the soffit plate are examples of plate-end anchorage devices that have been proposed as possible methods of preventing FRP separation failure. Generally, TR55 states that end plate separation failure can be avoided by meeting two criteria: (1) limiting the longitudinal shear stress between the FRP and the substrate, and (2) anchoring the FRP by extending it beyond the point at which it is theoretically no longer required.
To meet the first criterion, TR55 notes that field experience indicates that limiting the longitudinal shear stress at the ultimate limit state to a value no greater than 0.8 N/mm2, premature peeling failure can be avoided. TR55 also presents a procedure to calculate the minimum anchorage length as it relates to the maximum ultimate bond force. The longitudinal shear stress, ![]() , can be calculated using the following expression (Eq. (4.43)):
, can be calculated using the following expression (Eq. (4.43)):
(4.43)
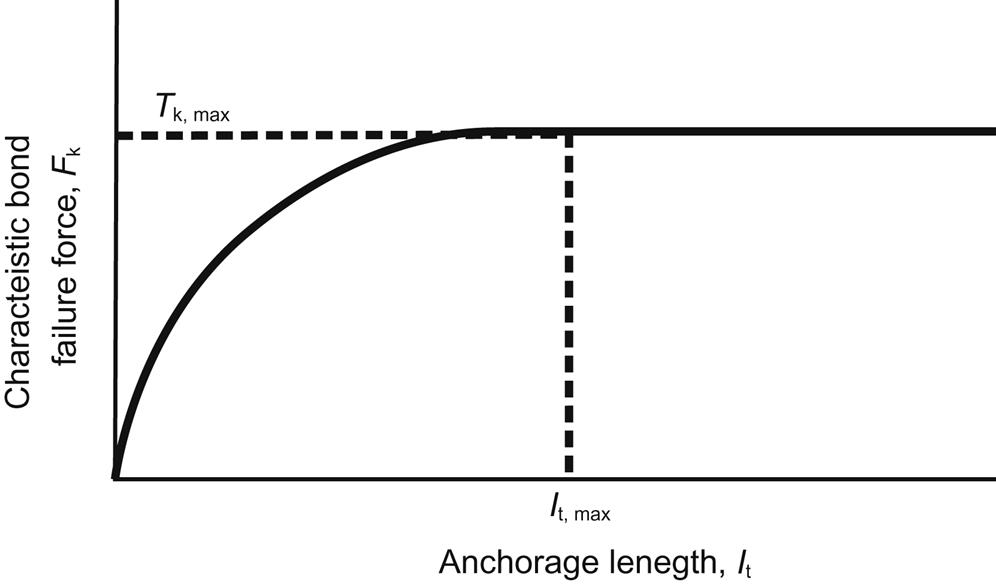
The relationship between the bond force,![]() , and the corresponding anchorage length,
, and the corresponding anchorage length, ![]() is presented in Fig. 4.13. It is further recommended that a minimum anchorage length of 500 mm should be provided. In situations where it is not possible to provide the maximum allowable anchorage length, the bond force should be less than the following:
is presented in Fig. 4.13. It is further recommended that a minimum anchorage length of 500 mm should be provided. In situations where it is not possible to provide the maximum allowable anchorage length, the bond force should be less than the following:
(4.44)
Additionally, TR55 considers using an anchorage device, provided its capacity has been verified by testing.
4.2.8.4 JSCE
JSCE does not clearly specify design equations other than the following limiting peeling stress expression:
(4.45)
 (4.45)
JSCE notes how the interfacial fracture energy factor ![]() varies with the strengthening system, the number of plies, and the anchoring system used, and states that this value should be determined through testing. When testing cannot be performed, JSCE recommends using a
varies with the strengthening system, the number of plies, and the anchoring system used, and states that this value should be determined through testing. When testing cannot be performed, JSCE recommends using a ![]() value of 4 lb/in. (0.7 N/mm).
value of 4 lb/in. (0.7 N/mm).
4.2.8.5 CNR
The following equation is used to limit the peeling stress in CNR:
(4.46)
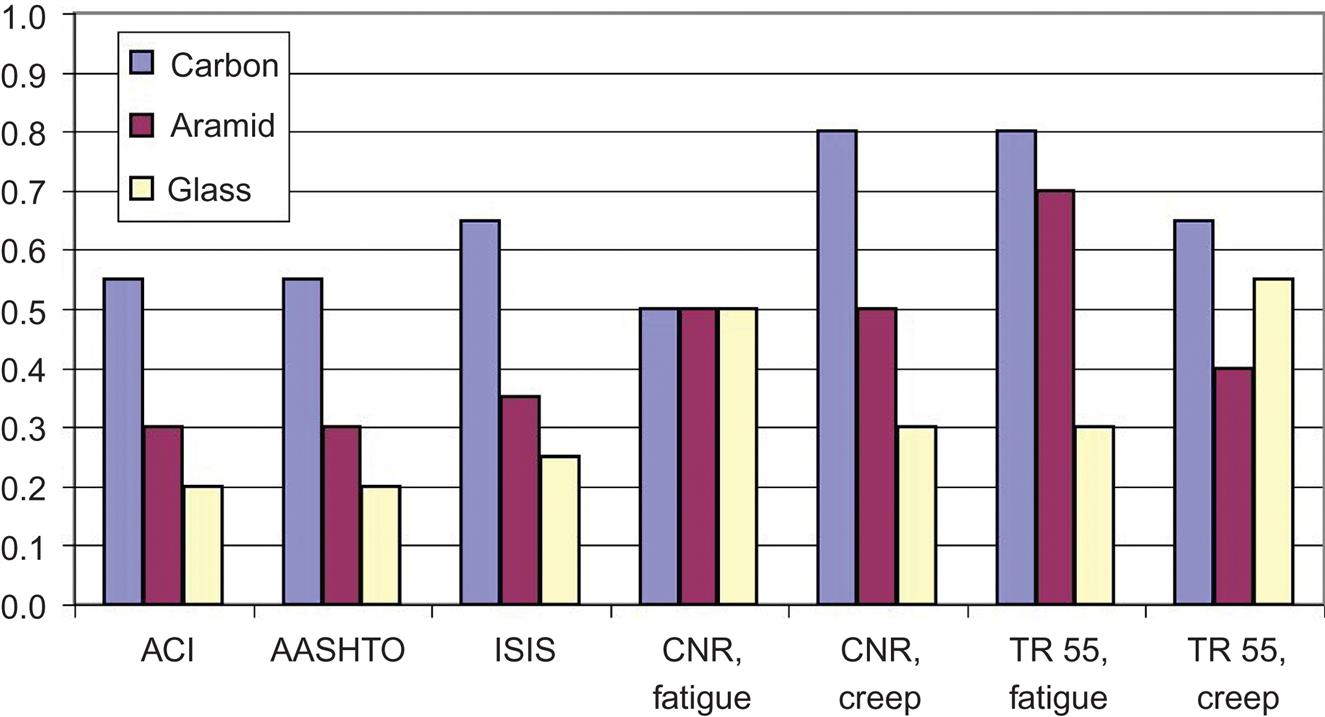
Per Eq. (4.46), to prevent peeling failure, the equivalent shear stress ![]() should be less than the design bond strength (
should be less than the design bond strength (![]() ). If the shear stress is higher, an anchorage device must be used. The equivalent shear stress is given by Eq. (4.47):
). If the shear stress is higher, an anchorage device must be used. The equivalent shear stress is given by Eq. (4.47):
(4.47)
where ![]() a coefficient (≥1) accounting for shear and normal stresses close to the anchorage ends, assumed to be 1.0.
a coefficient (≥1) accounting for shear and normal stresses close to the anchorage ends, assumed to be 1.0.
(4.48)
![]() =average shear stress;
=average shear stress; ![]() =shear force acting on the section where FRP strengthening ends; tf=fiber thickness; nf=modular ratio,
=shear force acting on the section where FRP strengthening ends; tf=fiber thickness; nf=modular ratio, ![]() ; xe=distance from the extreme compression fiber to the neutral axis;
; xe=distance from the extreme compression fiber to the neutral axis; ![]() moment of inertia of the transformed section.
moment of inertia of the transformed section.
(4.49)
![]() design bond strength, a function of the characteristic tensile strength of the concrete,
design bond strength, a function of the characteristic tensile strength of the concrete, ![]() .
.
The peeling stress is then given as
(4.50)
where
(4.51)
(4.51)References are not provided for the basis of the safety factors ![]() . Environmental factors are not accounted for. A value of 116 psi (0.8 N/mm2) is recommended for use as an upper limit to avoid premature peeling failure.
. Environmental factors are not accounted for. A value of 116 psi (0.8 N/mm2) is recommended for use as an upper limit to avoid premature peeling failure.
4.2.8.6 Anchorage methods for FRP
For cases of high peeling or shear stress an anchorage system may be required to avoid debonding failure. In these cases an anchorage system might allow the use of a FRP strengthening plan that otherwise would not meet design code provisions. For example, anchorage may allow greater strengthening or the use of a wider range of possible FRP geometries and material properties. A drawback of the use of many anchorage systems is the added cost and complexity of installation.
NCHRP 678 (Belarbi et al., 2011) describes several anchorage systems, including the near-surface mounted system, where the end of the FRP wrap or preformed plate is bent and embedded into a groove cut into the concrete, then secured with epoxy. Another system available involves anchoring the FRP to the concrete with a spike made from a bundle of fibers. In this process, half of the spike length is covered with resin and allowed to harden. The precured spike end is then inserted into a resin-filled hole that is drilled into the concrete, and the dry fibers on the other end of the spike are spread apart on the surface of the FRP layer to be anchored, and then saturated with resin. Yet other types of anchorage systems involve embedding nails or rods into the concrete to secure steel plates on top of the FRP layer to be anchored.
ISIS also describes several common anchorage systems, including bonding an additional FRP strip along the edges of the applied FRP; anchoring FRP shear stirrups into the bottom of the slab in T-beam applications; and clamping the FRP strips with plates and bolts, as later illustrated in Section 4.3.2.3.
4.2.8.7 Summary
A summary of peeling limits and procedures are given in Table 4.20.
Table 4.20
| Code | Quantity | Formula | Limit |
| ACI 440.2R | |||
| AASHTO | |||
| CNR-DT 200 | Bond shear strength | ||
| TR55 | Shear stress | ||
| JSCE | Shear stress | 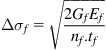 |
 |
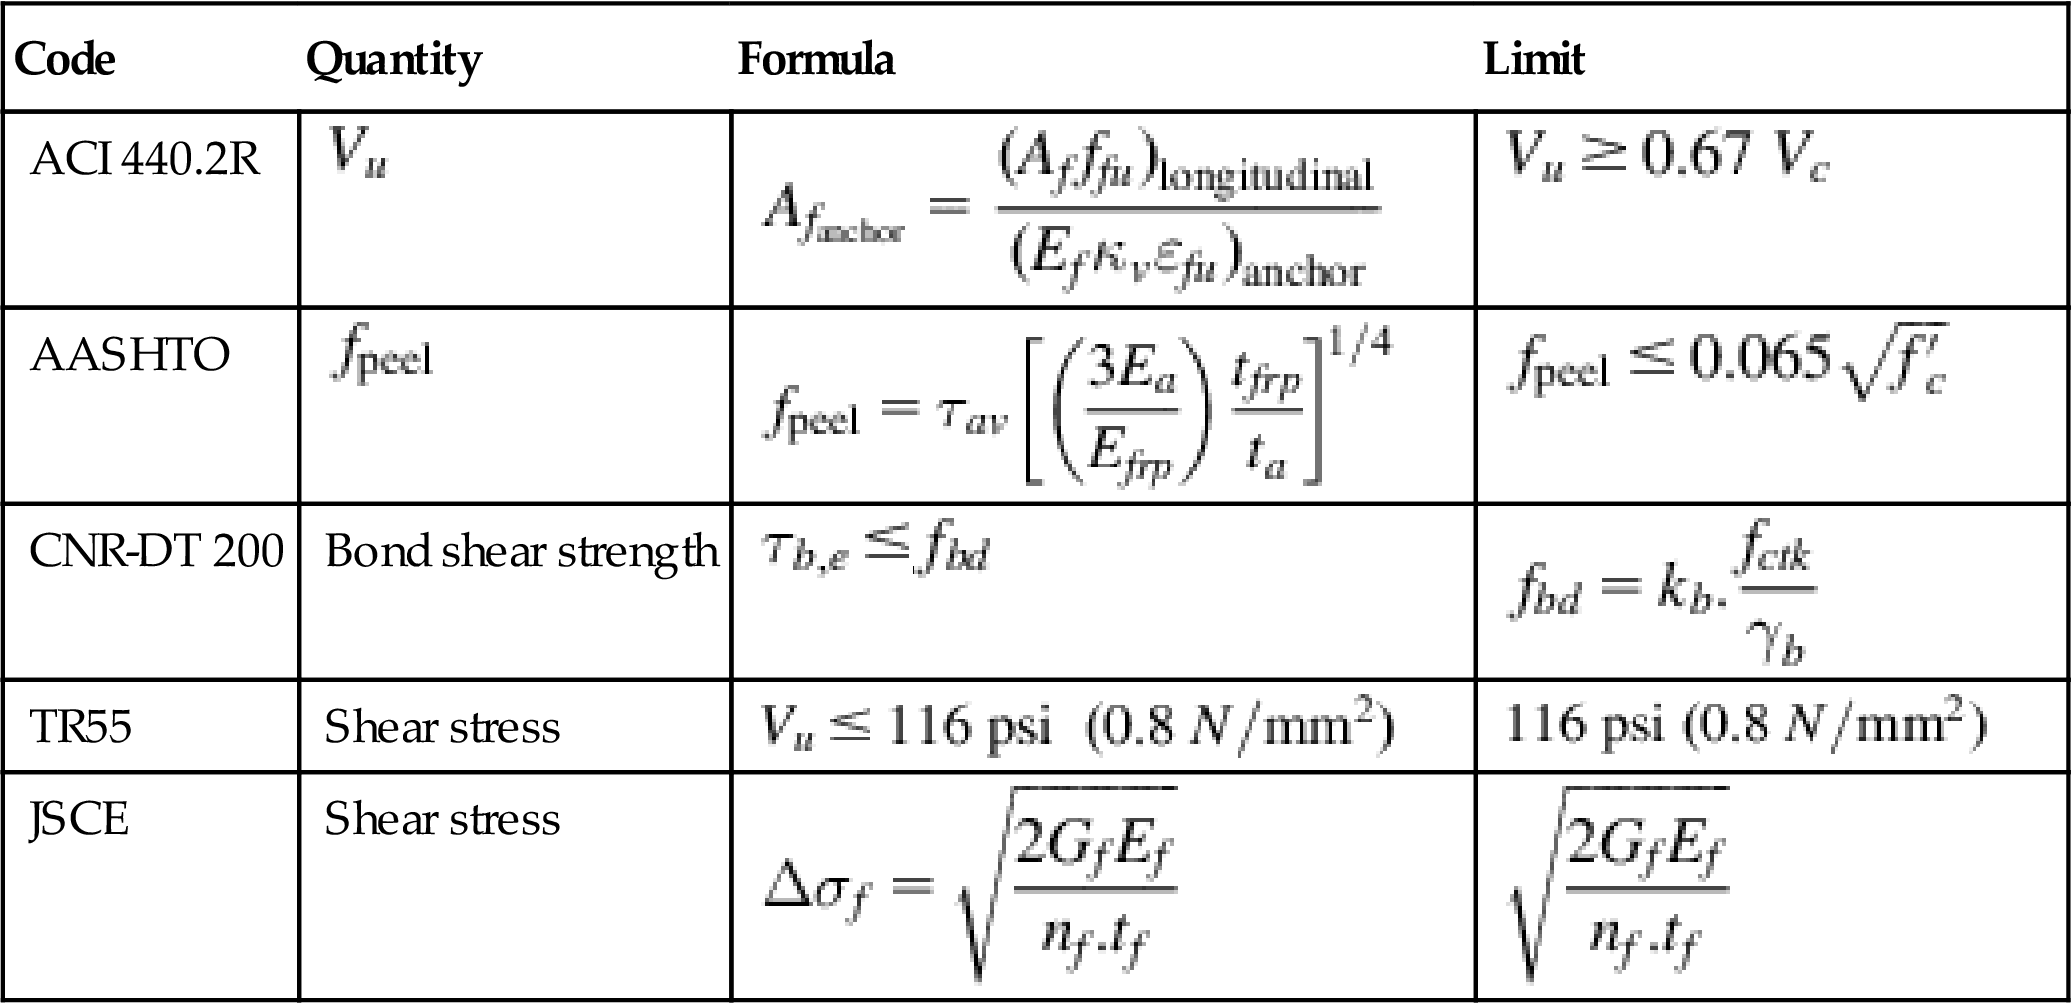
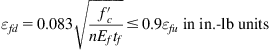
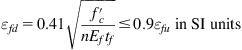
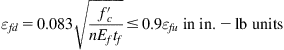
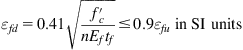
As shown in the table, different methods are used to evaluate peeling for the various codes. ACI uses a peeling limit evaluating the shear capacity of concrete at the FRP termination point, expressed as a function of ![]() and section shear capacity and demand (
and section shear capacity and demand (![]() ). AASHTO and CNR limits are similar, and are a function of
). AASHTO and CNR limits are similar, and are a function of ![]() and
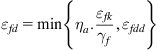
and ![]() respectively, while JSCE expresses the limit in terms of FRP-related quantities. To compare code expressions a rectangular concrete beam of h=30 in and b=18 in is considered as an example. The beam is assumed to have the following properties: factored shear force at the reinforcement end termination=100 kips; factored moment at the reinforcement termination=500 kip-in; materials properties of Mbrace Saturant and Mbrace CF130 wrap are used, such that fiber thickness (one ply)=0.0065 in.; fiber modulus of elasticity=33,000 ksi; adhesive thickness=0.0022 in.; adhesive modulus of elasticity=440 ksi; Poisson ratio of adhesive=0.40;
respectively, while JSCE expresses the limit in terms of FRP-related quantities. To compare code expressions a rectangular concrete beam of h=30 in and b=18 in is considered as an example. The beam is assumed to have the following properties: factored shear force at the reinforcement end termination=100 kips; factored moment at the reinforcement termination=500 kip-in; materials properties of Mbrace Saturant and Mbrace CF130 wrap are used, such that fiber thickness (one ply)=0.0065 in.; fiber modulus of elasticity=33,000 ksi; adhesive thickness=0.0022 in.; adhesive modulus of elasticity=440 ksi; Poisson ratio of adhesive=0.40; ![]() (assumes a frequent load combination (for CNR)). Peeling stresses and limits are evaluated as a function of the amount of FRP strengthening (Fig. 4.14), and concrete compressive strength
(assumes a frequent load combination (for CNR)). Peeling stresses and limits are evaluated as a function of the amount of FRP strengthening (Fig. 4.14), and concrete compressive strength ![]() (Fig. 4.15).
(Fig. 4.15).
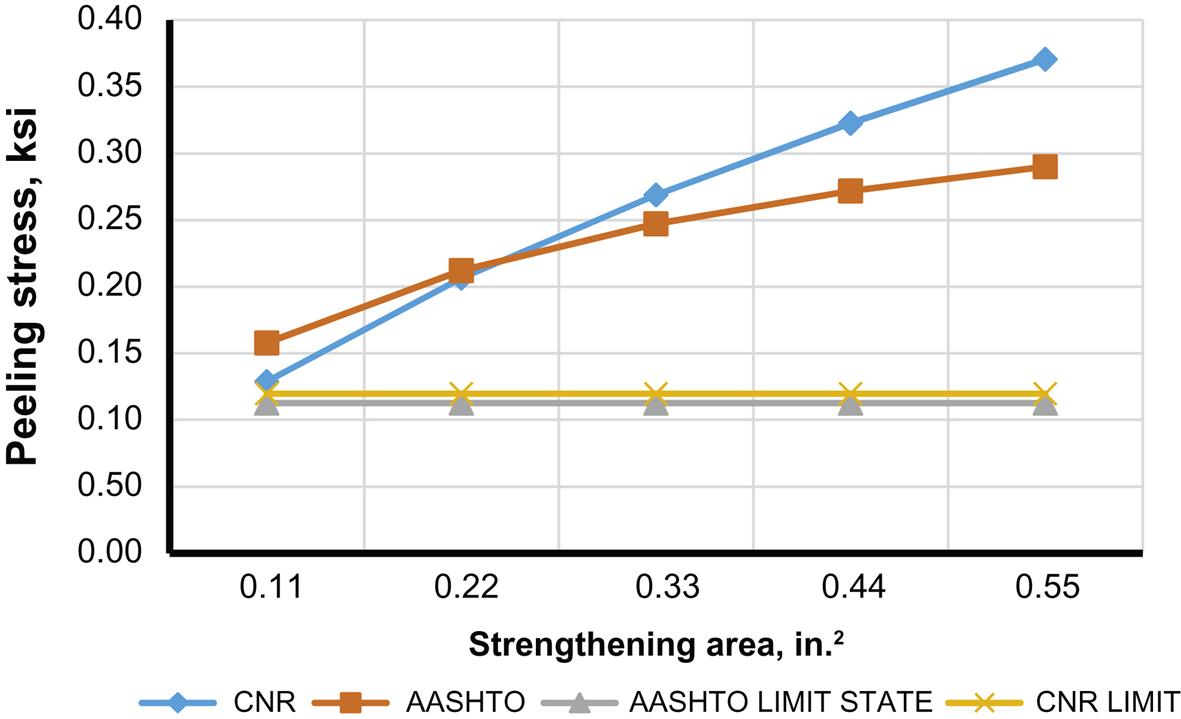
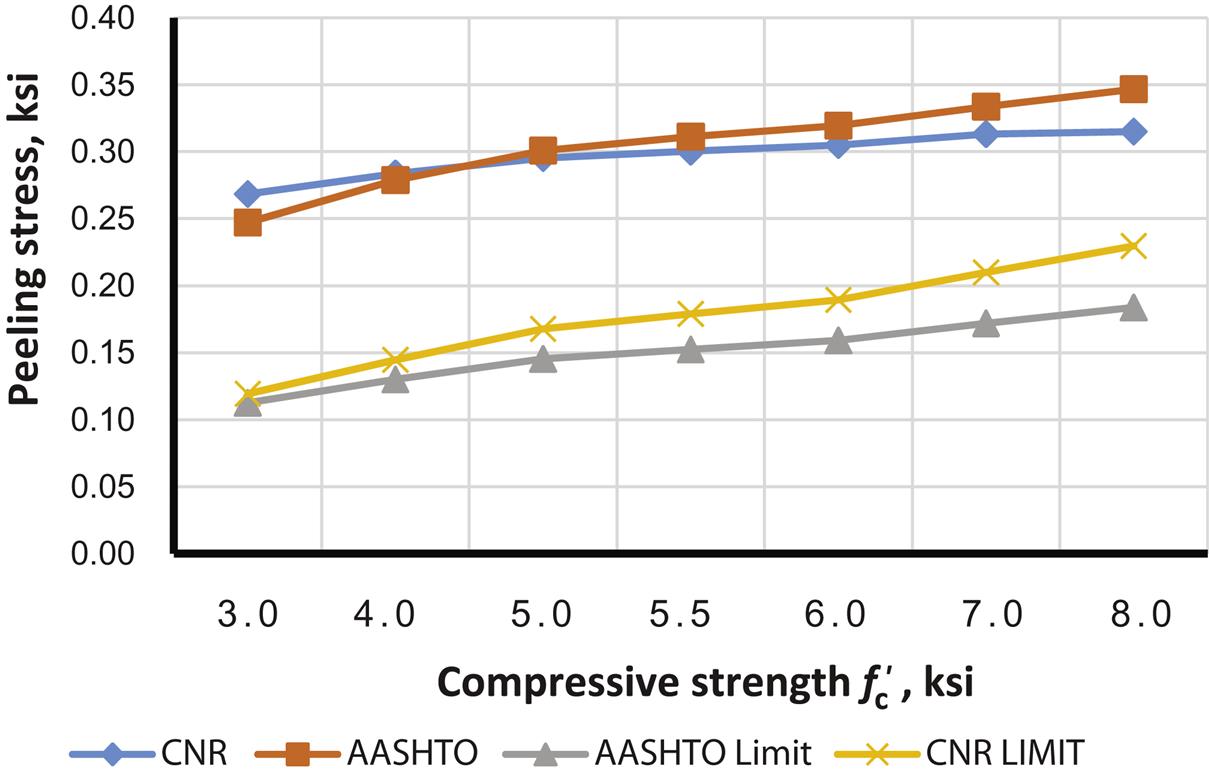

Two notable observations are that: (1) for the example beam, the peeling stress exceeds the peeling limit in all cases, and end anchorage is required; and (2) peeling stresses significantly increase as ![]() increases, and marginally increases as the amount of FRP strengthening increases. However, peeling limits are independent of the amount of FRP strengthening, but vary with the increase in
increases, and marginally increases as the amount of FRP strengthening increases. However, peeling limits are independent of the amount of FRP strengthening, but vary with the increase in ![]() . AASHTO and CNR are similar in the treatment of peeling stresses and peeling limits, although AASHTO peeling limits are slightly more conservative than those of CNR.
. AASHTO and CNR are similar in the treatment of peeling stresses and peeling limits, although AASHTO peeling limits are slightly more conservative than those of CNR.
4.2.9 Development length
4.2.9.1 AASHTO
In AASHTO the tension development length, ![]() , is taken as
, is taken as
(4.52)
where ![]() =tensile force in the FRP reinforcement corresponding to an FRP strain of 0.005;
=tensile force in the FRP reinforcement corresponding to an FRP strain of 0.005; ![]() =interface shear transfer=0.065
=interface shear transfer=0.065 ![]() .
.
The specified development length is required to allow the full tension strength of the FRP to be developed in the region of maximum moment.
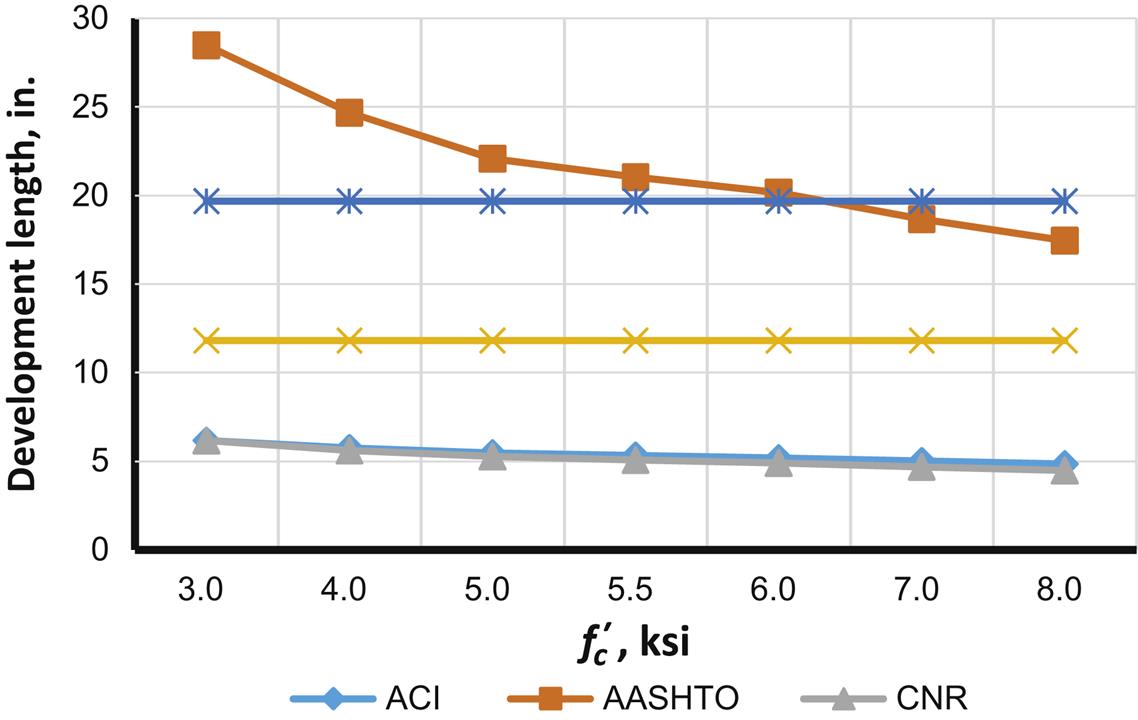
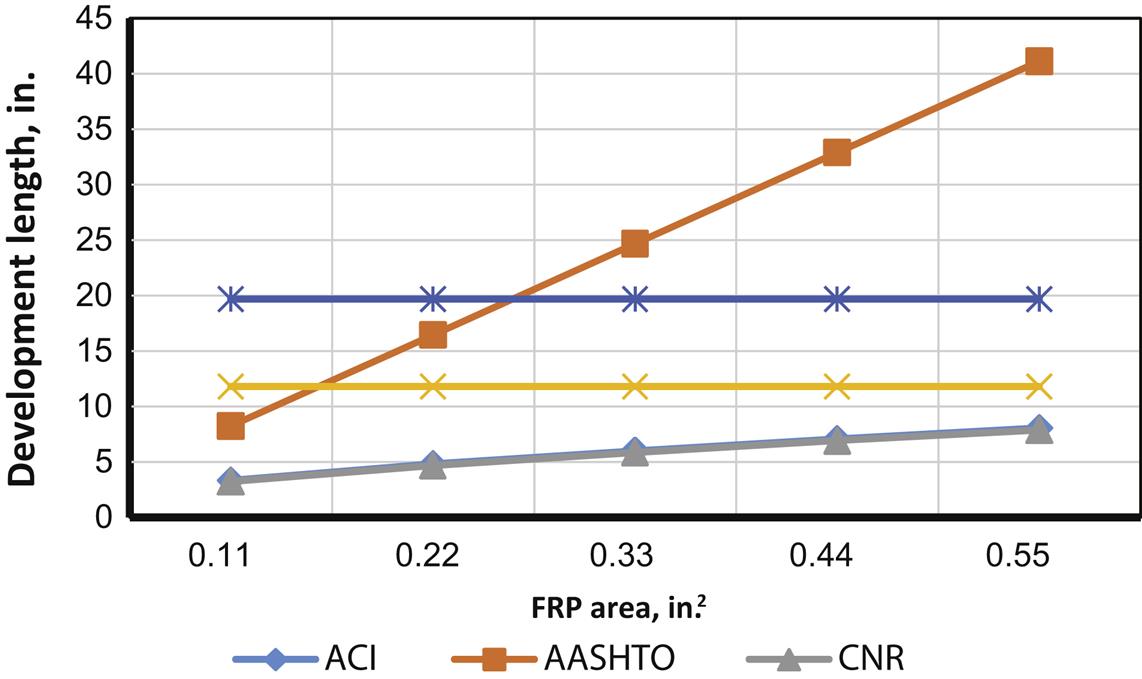
As will be shown below, the AASHTO development length calculations produce more conservative values as FRP area increases. It was also found that AASHTO development length values are most conservative at lower values of ![]() , producing values as well as trends that are significantly different from the other codes studied (see Figs. 4.16 and 4.17). Other code results appear to be independent of the changes in FRP area as well as
, producing values as well as trends that are significantly different from the other codes studied (see Figs. 4.16 and 4.17). Other code results appear to be independent of the changes in FRP area as well as ![]() (ISIS and TR55) or slightly dependent on these factors (ACI and CNR). To understand the reasons for these discrepancies, the basis of AASHTO’s development length methodology is reviewed.
(ISIS and TR55) or slightly dependent on these factors (ACI and CNR). To understand the reasons for these discrepancies, the basis of AASHTO’s development length methodology is reviewed.
The interface shear transfer strength (τint) given in AASHTO is based on the recommendation of Naaman and Lopez (1999), who conducted tests on uncracked and precracked reinforced concrete beams externally bonded with FRP reinforcement and subjected to accelerated freeze–thaw cycles. This shear limit represents a lower bound of the experimental data found from short-term direct tension tests of FRP reinforcement bonded to concrete surfaces (Haynes, 1997; Bizindavyi and Neale, 1999). This research was conducted for MDOT and is detailed in Report RC-1372, “Repair and strengthening of reinforced concrete beams using CFRP laminates, behavior of beams subjected to freeze-thaw cycles.”
In the experimental program, reinforced concrete beams were subjected to a maximum of 300 freeze–thaw cycles according to ASTM C666. The parameters investigated were two different adhesive systems, the Tonen CFRP sheet system (MBrace), and the Sika CFRP system (Carbodur); as well as the degree of cracking prior to strengthening. It was found that freeze–thaw cycles influenced the behavior of reinforced concrete beams with glued-on CFRP laminates, and the recommended value of interface shear transfer strength (τint) represents the lower bound of the test results.
4.2.9.2 ACI
In ACI the bond capacity of FRP is developed over a critical length ![]() . To develop the effective FRP stress at a given section, the available anchorage length of FRP should exceed the value given in the equation below:
. To develop the effective FRP stress at a given section, the available anchorage length of FRP should exceed the value given in the equation below:
(4.53)
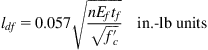 (4.53)
(4.54)
 (4.54)
4.2.9.3 ISIS
ISIS specifies the minimum required anchorage length for the externally bonded FRP beyond the point where no strengthening is required, ![]() . According to the S6-06 bridge code,
. According to the S6-06 bridge code, ![]() may be evaluated as follows:
may be evaluated as follows:
(4.55 – ISIS Eq. 5.29)
Anchorage lengths longer than ![]() must be provided if required by the manufacturer’s installation procedure. For cases where
must be provided if required by the manufacturer’s installation procedure. For cases where ![]() is not provided, suitable anchorage mechanisms must be used.
is not provided, suitable anchorage mechanisms must be used.
4.2.9.4 CNR
The optimal bonded length ![]() may be estimated as follows:
may be estimated as follows:
(4.56 – CNR Eq. 4.1)
 (4.56 – CNR Eq. 4.1)
where ![]() is in mm; the value from Eq. (4.56) should be multiplied by 0.03937 to obtain
is in mm; the value from Eq. (4.56) should be multiplied by 0.03937 to obtain ![]() in inches.
in inches.
4.2.9.5 TR55
TR55 specifies a threshold anchorage length, ![]() , above which no increase in the bond failure force is possible. The maximum anchorage length,
, above which no increase in the bond failure force is possible. The maximum anchorage length, ![]() , needed to activate this bond force is calculated using the following expressions:
, needed to activate this bond force is calculated using the following expressions:
(4.57 – TR55 Eq. 6.19)
where
(4.58 – TR55 Eq. 6.22)
4.2.9.6 Summary
Generally, all expressions (with the exception of ISIS), express development length as a function of tension in the FRP and concrete compressive strength ![]() . The ISIS formula
. The ISIS formula ![]() sets a minimum limit of 11.81 in. (300 mm), while TR55 sets the development length minimum value at 19.69 in. (500 mm). A comparative evaluation of development length is given in Figs. 4.16 and 4.17 (note that to evaluate CNR,
sets a minimum limit of 11.81 in. (300 mm), while TR55 sets the development length minimum value at 19.69 in. (500 mm). A comparative evaluation of development length is given in Figs. 4.16 and 4.17 (note that to evaluate CNR, ![]() is assumed to be
is assumed to be ![]() in accordance with the Eurocode, since CNR does not provide an expression for the value). Two scenarios are considered; the first (Fig. 4.16) varies
in accordance with the Eurocode, since CNR does not provide an expression for the value). Two scenarios are considered; the first (Fig. 4.16) varies ![]() , while the second (Fig. 4.17) varies FRP area from one to five plies of BASF MBrace CF130 CFRP wrap (see article 4.2.8.7 in this book for example beam properties and other relevant data).
, while the second (Fig. 4.17) varies FRP area from one to five plies of BASF MBrace CF130 CFRP wrap (see article 4.2.8.7 in this book for example beam properties and other relevant data).
It can be seen from the figures that a significant variation in development length requirements exist. For ISIS and TR55 the lower limits specified generally controlled. For AASHTO, development length is independent of FRP modulus, while all other codes have expressions for development length as a function of FRP modulus. The AASHTO expression is also significantly more sensitive to FRP area. As discussed above, AASHTO recommendations differ significantly from the other codes and generally provide conservative results. However, the values considered by AASHTO were specifically based on testing conducted for MDOT at the University of Michigan that included freeze–thaw conditioning relevant to Michigan.
4.2.10 Flexural design approach and assumptions
4.2.10.1 AASHTO
In AASHTO the calculation of the flexural strength of reinforced concrete members externally reinforced with FRP materials assumes perfect bond between the reinforcing steel, FRP reinforcement and the concrete; that the contribution of tension stress in the concrete to flexural strength is neglected; the stress–strain behavior for FRP reinforcement is linear-elastic until failure; the stress–strain behavior of steel reinforcement is bilinear, with elastic behavior up to yielding and perfectly plastic behavior thereafter; the maximum usable compression strain in the concrete is equal to 0.003; and the maximum usable strain at the FRP/concrete interface is 0.005.
When concrete compressive strain is less than 0.003, the concrete compression stress distribution is to be modeled with a parabolic shape according to the following equation:
(4.59)
where
(4.60)
![]() is the concrete strain corresponding to the maximum stress on the concrete stress–strain curve.
is the concrete strain corresponding to the maximum stress on the concrete stress–strain curve.
The factored resistance, ![]() , of a steel-reinforced concrete rectangular section strengthened with FRP externally bonded to the beam tension surface is be taken as
, of a steel-reinforced concrete rectangular section strengthened with FRP externally bonded to the beam tension surface is be taken as
(4.61)
where ![]() =resistance factor=0.85.
=resistance factor=0.85.
(4.62)
n=number of FRP reinforcement plates; Nb=FRP reinforcement strength per unit width, corresponding to 0.5% strain in the FRP reinforcement when subjected to tension in accordance with ASTM D3039; assumed to be 1.07.
4.2.10.2 JSCE
JSCE considers carbon and aramid fibers. It employs five partial safety factors: material, load, member, structure, and analysis. However, JSCE does not include explicit design equations for flexure. Due to the lack of a clear procedural description of flexural capacity evaluation, JSCE was not further considered for moment capacity analysis and comparison.
4.2.10.3 CNR
Similar to JSCE, CNR also provides no explicit capacity expression, but the flexural failure mode and capacity can be determined from strain compatibility, section equilibrium, and the required material strength limits. In CNR the concrete stress block is not specified, so the FIB 14 procedure (2001) is used, where the coefficient representing the resultant of the compressive stress can be expressed as follows:
=0.8—(![]() -50)/400 for
-50)/400 for ![]() >7.3 ksi (eq. in MPa).
>7.3 ksi (eq. in MPa).
λ=coefficient representing the extreme compression fiber;
Finally the maximum strain in FRP is to be calculated as follows:
(4.12)
 (4.12)
For comparison to other codes (as applicable in Figs. 4.18–4.35) the following assumptions are used in CNR flexural calculations: steel yield strength is reduced by the specified partial safety factor of ![]() =1.15 such that
=1.15 such that ![]() =
=![]() ; the mean value of concrete tensile strength
; the mean value of concrete tensile strength ![]() (not explicitly defined in CNR, but taken from Eurocode; concrete compressive strength is taken as
(not explicitly defined in CNR, but taken from Eurocode; concrete compressive strength is taken as ![]() , with the partial safety factor taken as
, with the partial safety factor taken as ![]() .
.


4.2.10.4 ACI
ACI assumes that the maximum concrete compressive strain is 0.003. The FRP strain limit is imposed using Eq. (4.8) as shown below:
(4.8 – ACI Eq. 10.2)
 (4.8 – ACI Eq. 10.2)
(4.9)
 (4.9)
(4.9)
Eq. (4.63) (ACI Eq. 10.13) is typically used to evaluate the nominal moment capacity of the section:
(4.63 – ACI Eq. 10.13)
For the special case when ![]() is smaller than 0.003, values for
is smaller than 0.003, values for ![]() and
and ![]() are evaluated as follows:
are evaluated as follows:
(4.64)
(4.65)
Using ![]() and
and ![]() the neutral axis location can be evaluated from Eq. (4.66).
the neutral axis location can be evaluated from Eq. (4.66).
(4.66)
Steel and FRP service stresses are calculated using Eqs. (4.20) and (4.21) to ensure compliance with serviceability requirements.
(4.20 – ACI Eq. 10.14)
(4.21 – ACI Eq. 10.15)
An environmental reduction factor CE (taken as 0.85 assuming exterior exposure) and the additional reduction factor ![]() specific to FRP are considered in the factored moment calculations.
specific to FRP are considered in the factored moment calculations.
4.2.10.5 ISIS
The ISIS design procedure is straightforward with the assumptions given in the code. The neutral axis is determined using strain compatibility and section balance. In ISIS, it is assumed that concrete maximum compressive strain is ≤0.0035; the maximum FRP strain (per the bridge code)=0.006; and, the appropriate reduction factors are used as specified earlier in this chapter.
4.2.10.6 TR55
TR55 is similar to the other codes in its assumptions of the applicability of basic engineering mechanics to establish section capacity. Specific to TR55 are the following recommendations for flexural capacity: the FRP strain limit to prevent debonding is taken as 0.008 for uniformly distributed loads and 0.006 for load effects of simultaneous high shear and moment; and the ultimate compressive strain in concrete ![]() =0.0035.
=0.0035.
Unique to In TR55, an additional moment capacity, ![]() , representing the FRP contribution, is added to the original section nominal moment capacity. Assuming a flexural section is to be strengthened to carry a larger moment M than its current capacity, with a singly-reinforced section, the nominal moment is evaluated as follows:
, representing the FRP contribution, is added to the original section nominal moment capacity. Assuming a flexural section is to be strengthened to carry a larger moment M than its current capacity, with a singly-reinforced section, the nominal moment is evaluated as follows:
(4.67 – UK Eq. 6.14)
where
4.2.10.7 Summary
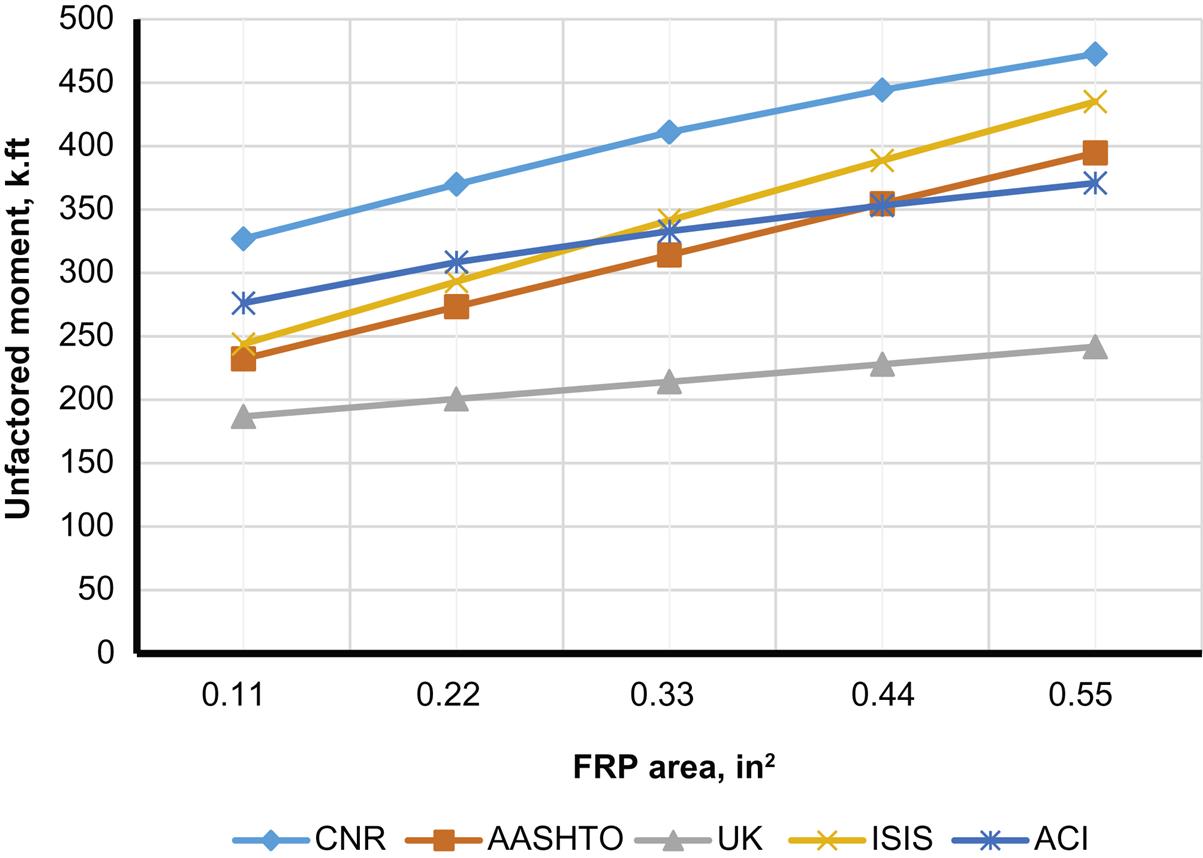
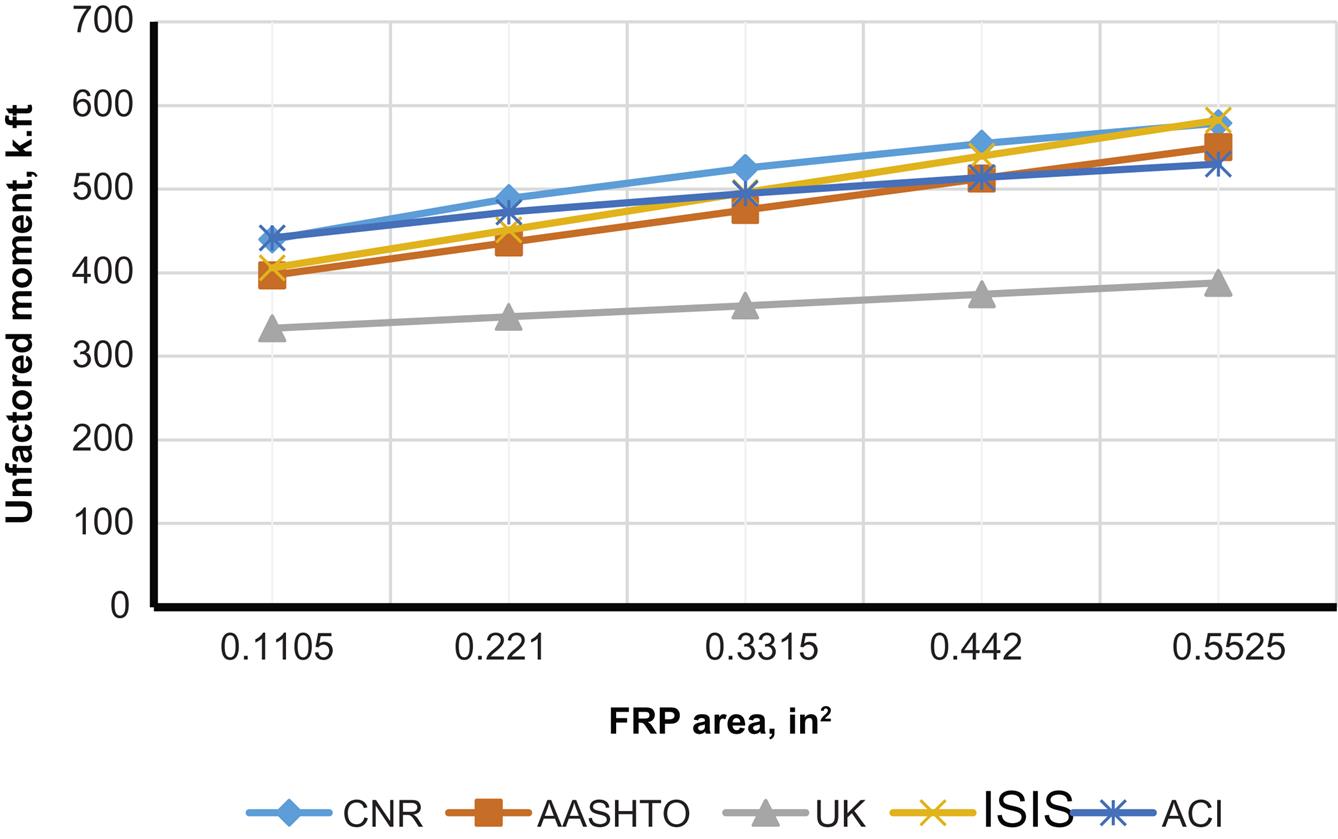
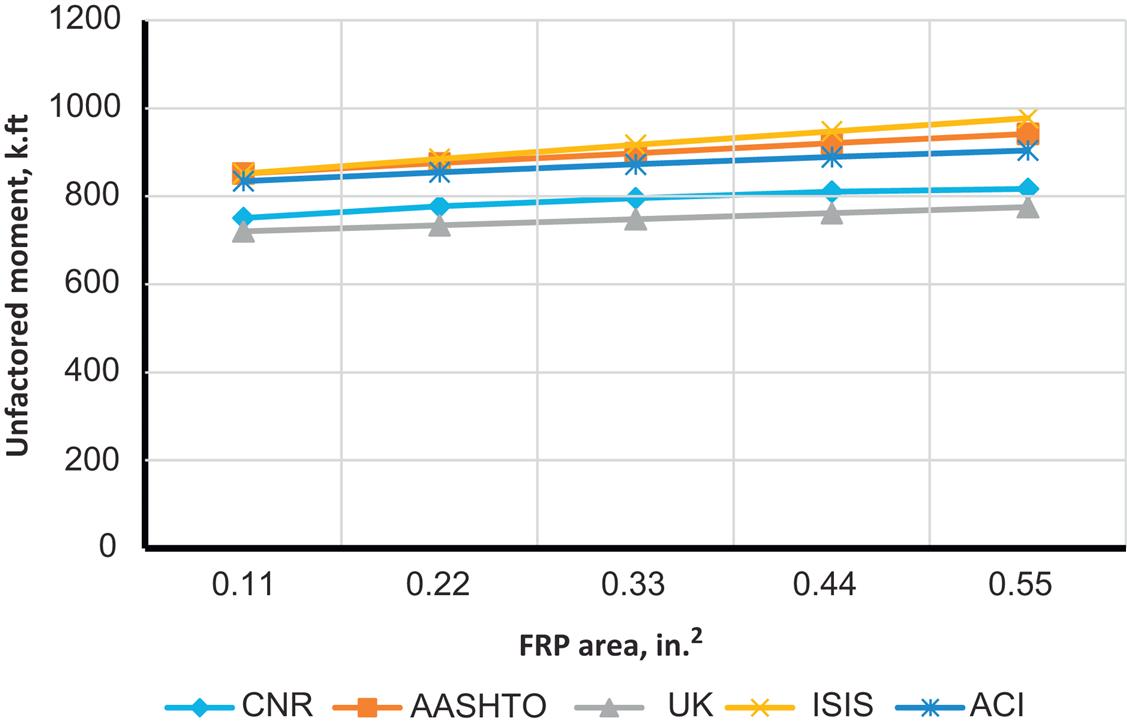
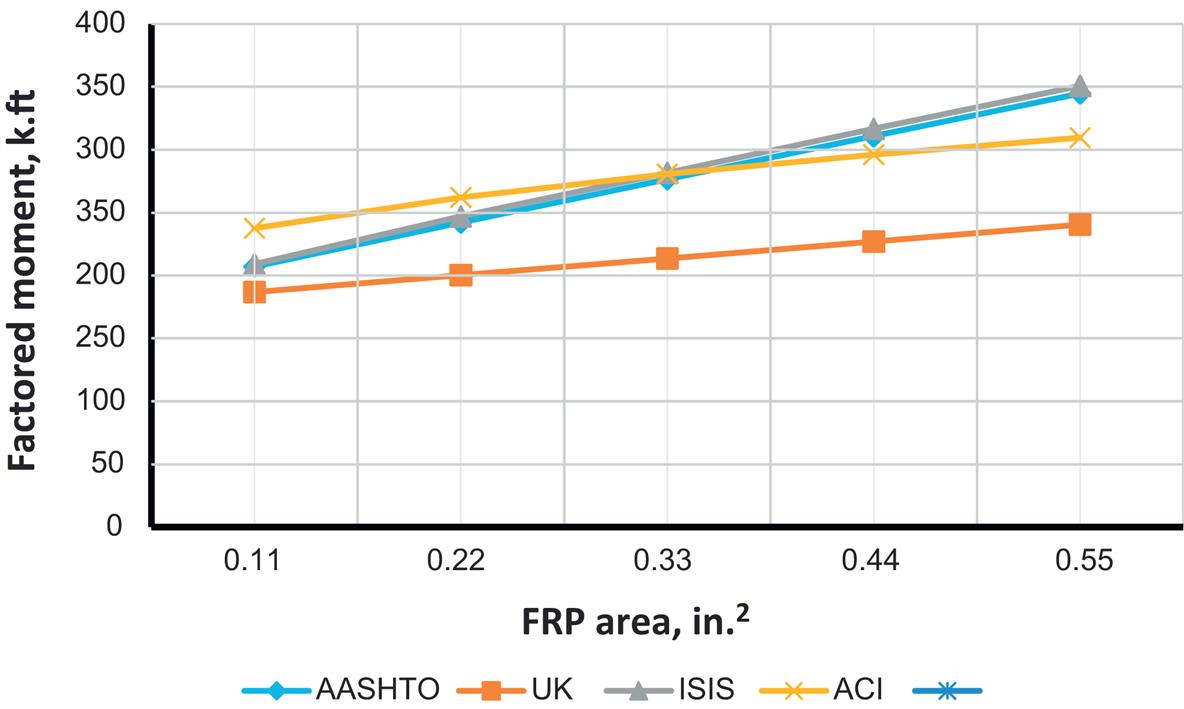
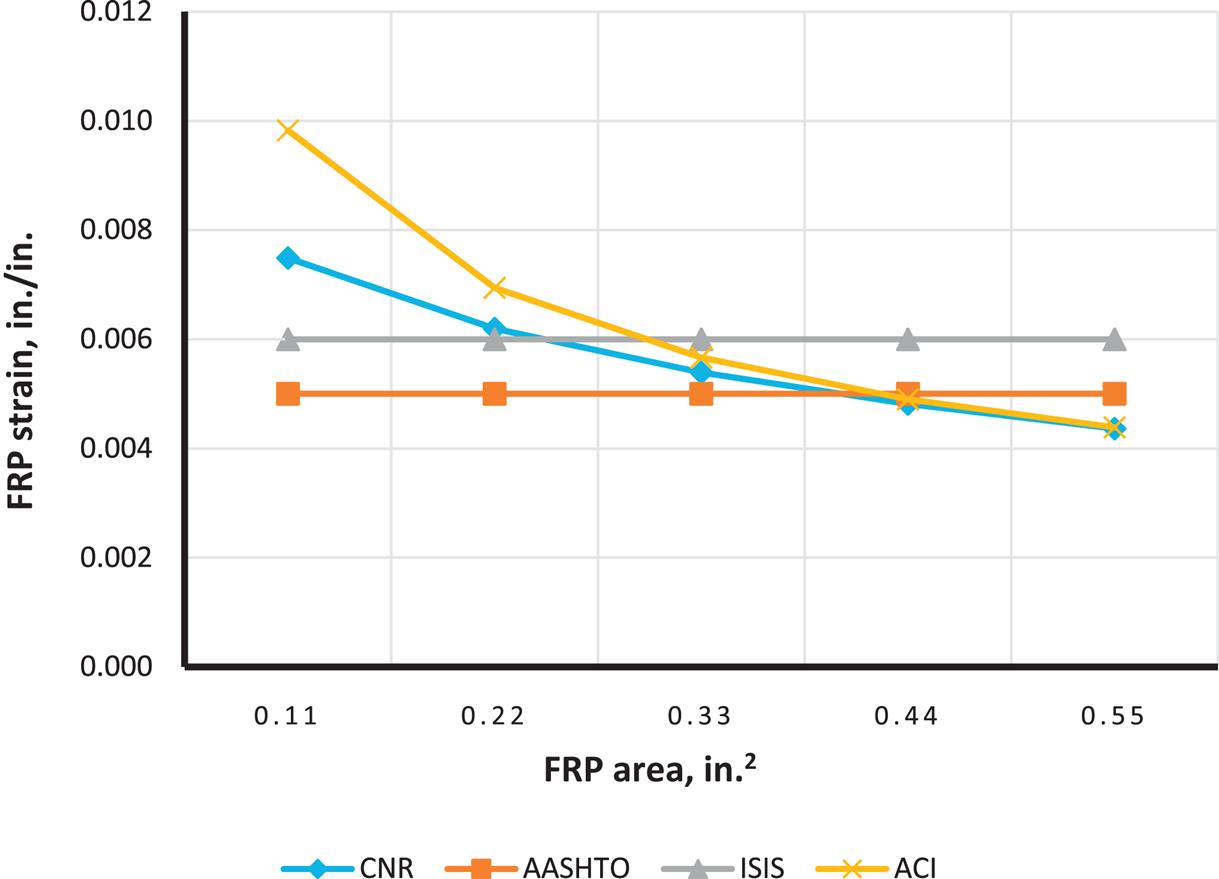
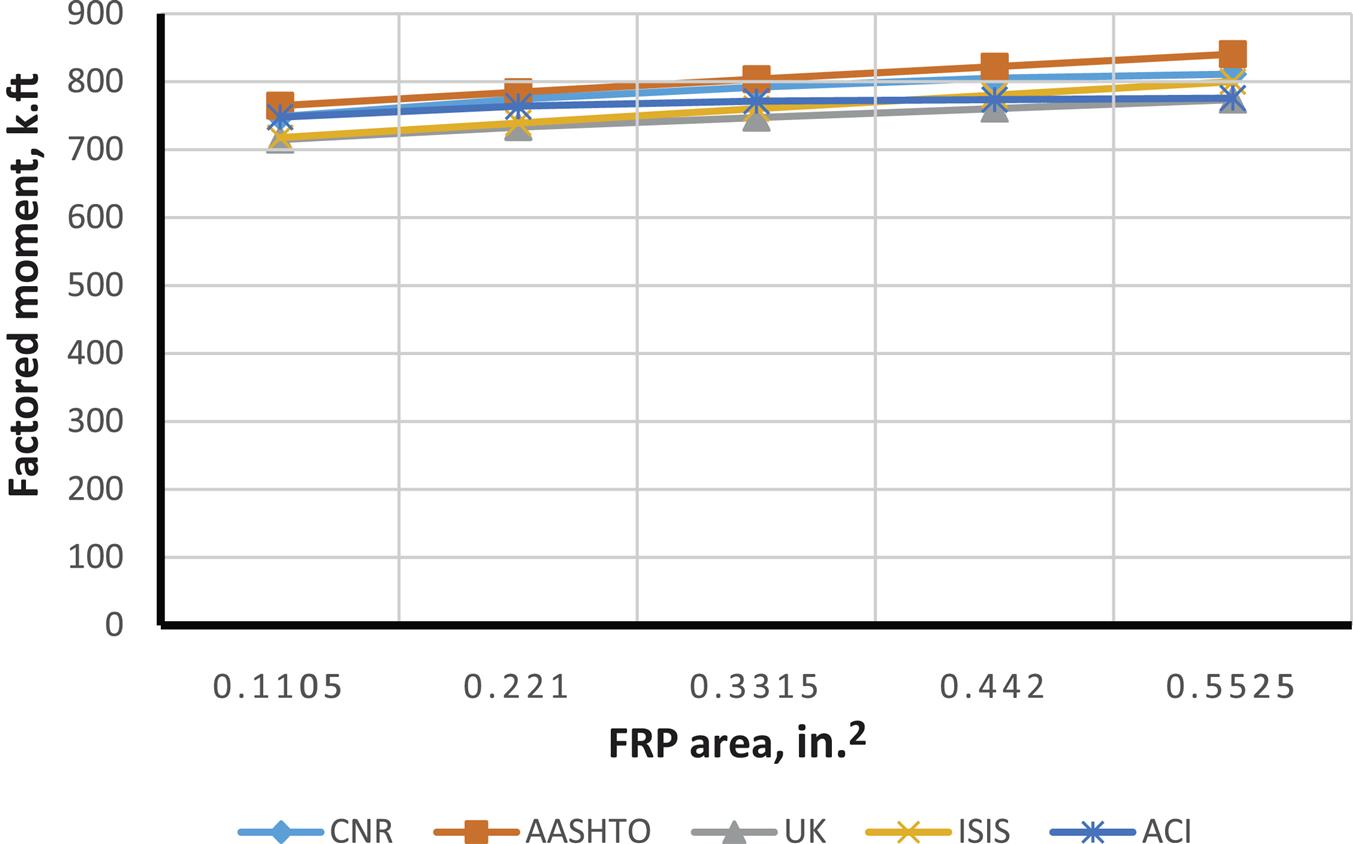
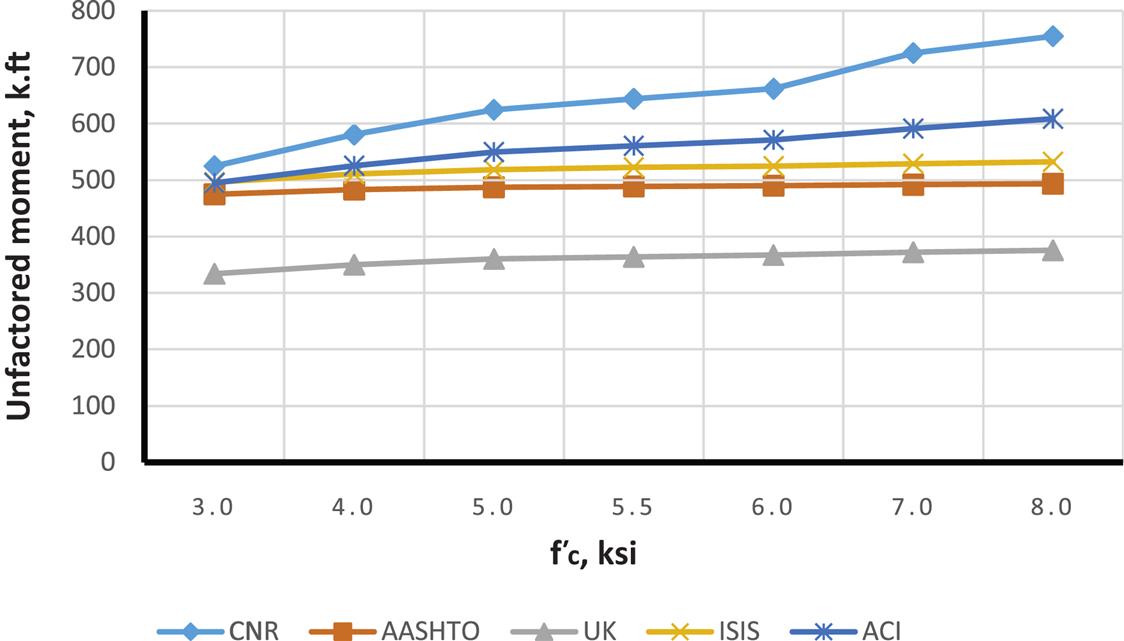
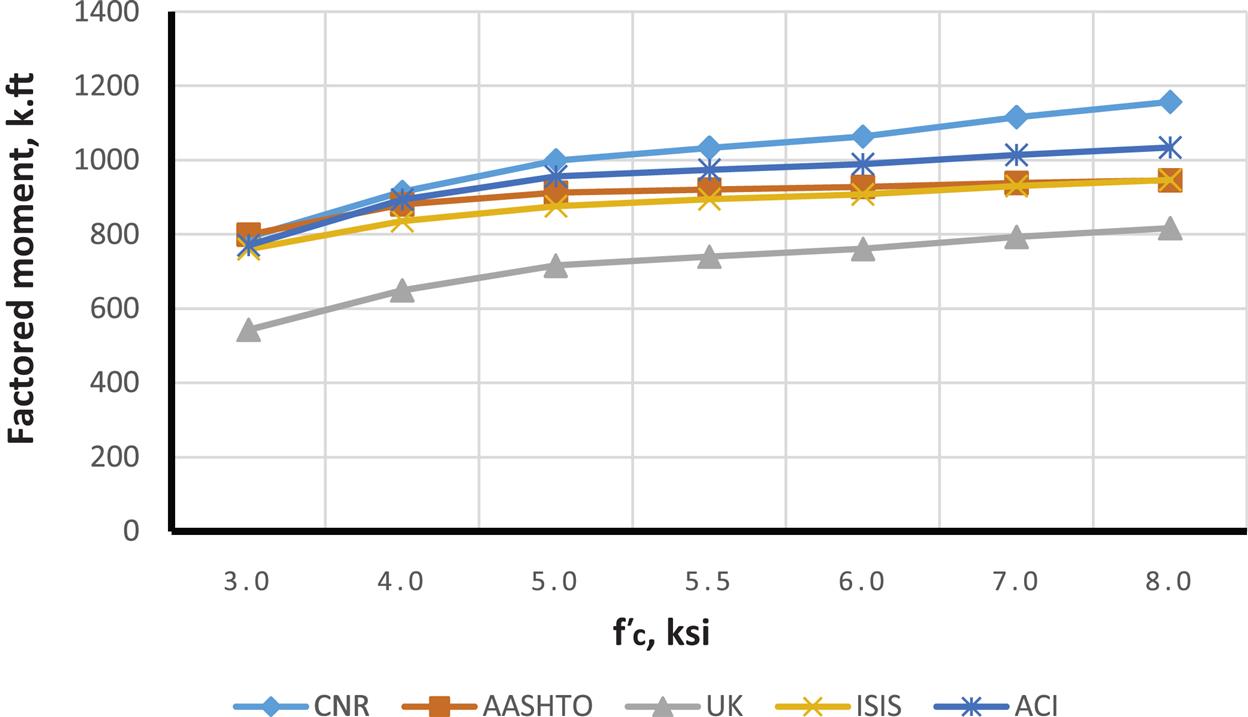
For comparison of different code results a rectangular reinforced concrete beam with b=18 in and h=30 in is considered for strengthening with MBrace CF130 CFRP. Figs. 4.18–4.26 illustrate how moment capacity changes as a function of FRP area and initial steel reinforcement ratio. It was found that, as expected, an increase in moment capacity accompanies an increase in FRP area. An exception is observed for ACI with a steel ratio of 0.0171 (Fig. 4.25—factored moment case). This exception occurs because the steel reinforcement strain falls in the transition zone between a tension and compression controlled failure, causing a reduction in the value of ![]() and thus reducing the factored moment as FRP area increases. It was also found that as steel reinforcing ratio increases, a compression failure is observed in some codes but not in others. For example, AASHTO and CNR develop compression failures at a steel reinforcement ratio of 0.0171 for all values of FRP strengthening. It is important to note that the compression failures were obtained for the relatively low
and thus reducing the factored moment as FRP area increases. It was also found that as steel reinforcing ratio increases, a compression failure is observed in some codes but not in others. For example, AASHTO and CNR develop compression failures at a steel reinforcement ratio of 0.0171 for all values of FRP strengthening. It is important to note that the compression failures were obtained for the relatively low ![]() chosen for the evaluation beam of 3000 psi. This low value was specifically chosen such that the behavior of different code procedures considering different beam failure modes (i.e., tension and compression controlled) could be compared. In most cases, where
chosen for the evaluation beam of 3000 psi. This low value was specifically chosen such that the behavior of different code procedures considering different beam failure modes (i.e., tension and compression controlled) could be compared. In most cases, where ![]() is greater that 3000 psi, the likelihood of developing a compression failure is reduced for the same amount of FRP reinforcement.
is greater that 3000 psi, the likelihood of developing a compression failure is reduced for the same amount of FRP reinforcement.
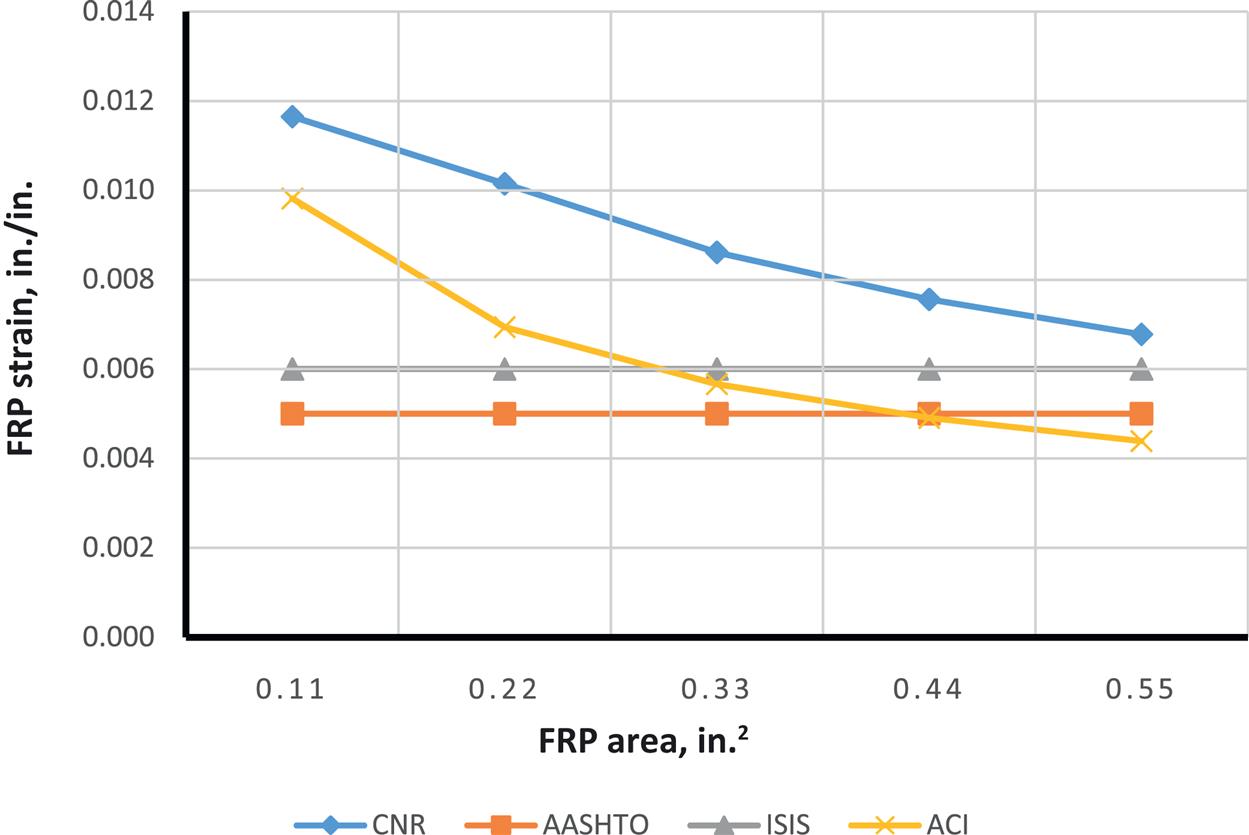
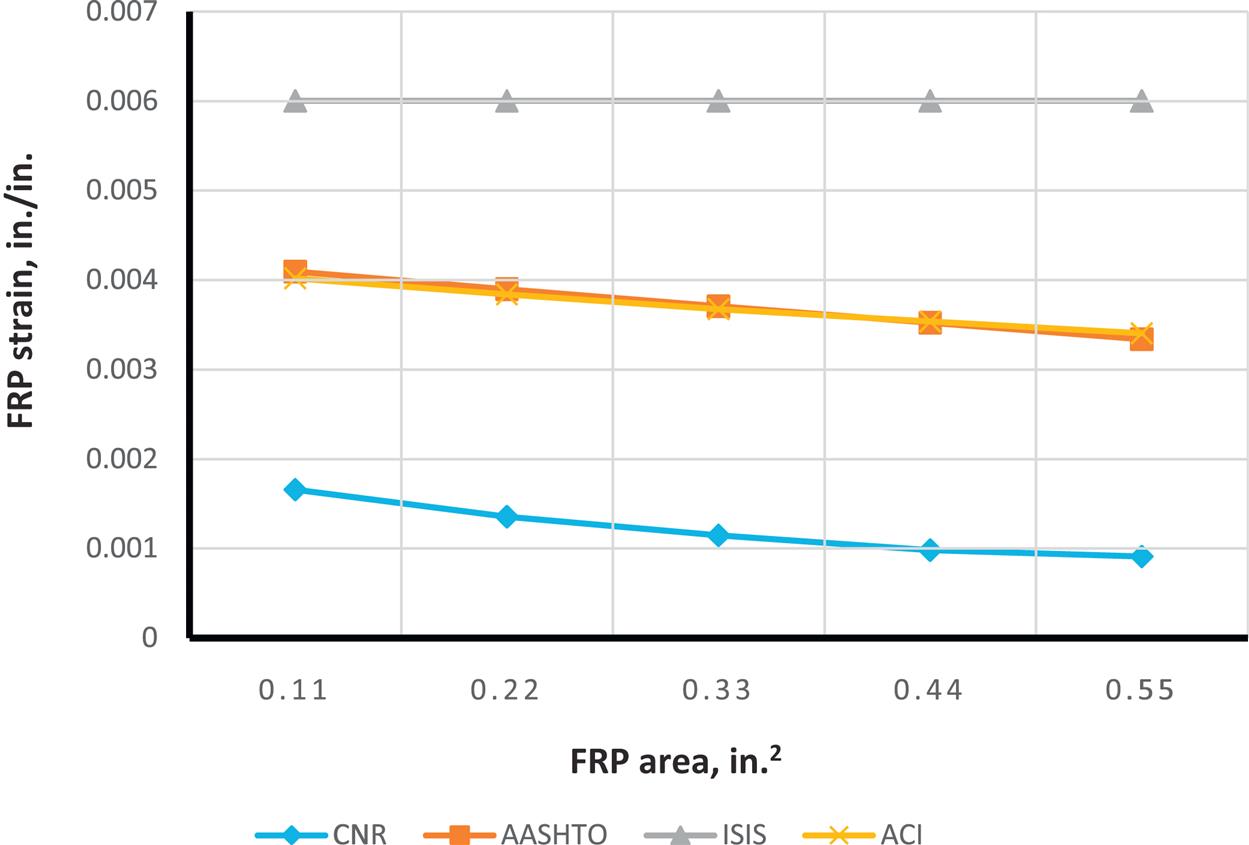
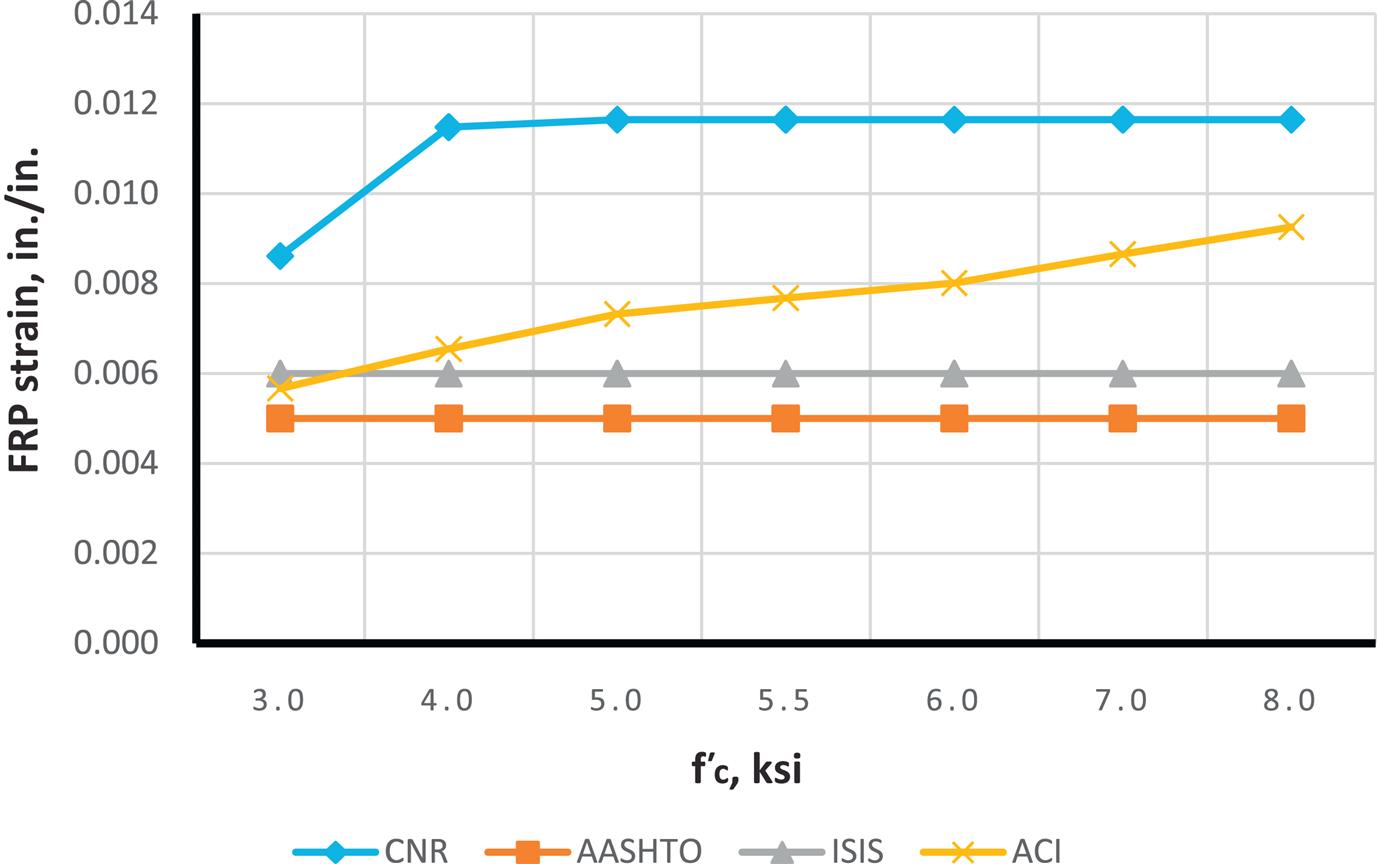
It was also found that due to the need to maintain section equilibrium, when FRP area increases, FRP strain is reduced. However, when the code-specified FRP strain limits are imposed (for example, ISIS enforces a maximum FRP strain of 0.006), FRP rupture sometimes becomes the only possible mode of failure. Moreover, ACI exhibits a higher FRP strain at lower values for FRP area, relative to other codes. This can be attributed to one of the two ACI strain limit expressions, where the strain limit is inversely propotional to FRP area (Eq. (4.8)).
(4.8 – ACI Eq. 10.2)
 (4.8 – ACI Eq. 10.2)
(4.9)
 (4.9)
(4.9)
Although predicted FRP strains differ, AASHTO and ISIS, both bridge-specific codes, generally produce similar moment capacity values for the different cases investigated. ACI, AASHTO, and ISIS are also reasonably consistent with flexural capacity prediction. ACI has greatest capacity for lower FRP area and higher ![]() , while AASHTO and ISIS have greatest capacity for higher FRP areas. TR55 is more sensitive when there is a change in concrete compressive strength and is less affected by change in FRP area. It is the most conservative for almost all cases. Despite its largest FRP strain limit of 0.008, it produces the least capacity due to its conservative (nonadjustment of the neutral axis) flexural capacity calculation method. In most cases, FRP rupture was found to be the mode of failure.
, while AASHTO and ISIS have greatest capacity for higher FRP areas. TR55 is more sensitive when there is a change in concrete compressive strength and is less affected by change in FRP area. It is the most conservative for almost all cases. Despite its largest FRP strain limit of 0.008, it produces the least capacity due to its conservative (nonadjustment of the neutral axis) flexural capacity calculation method. In most cases, FRP rupture was found to be the mode of failure.
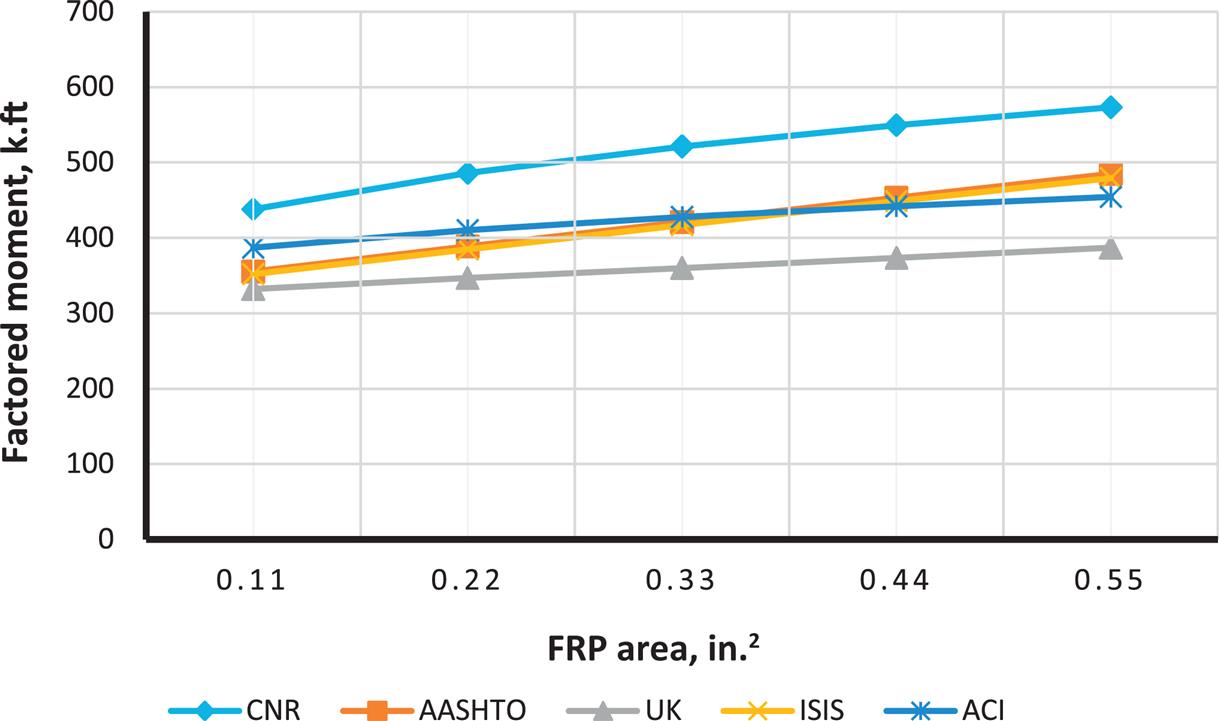
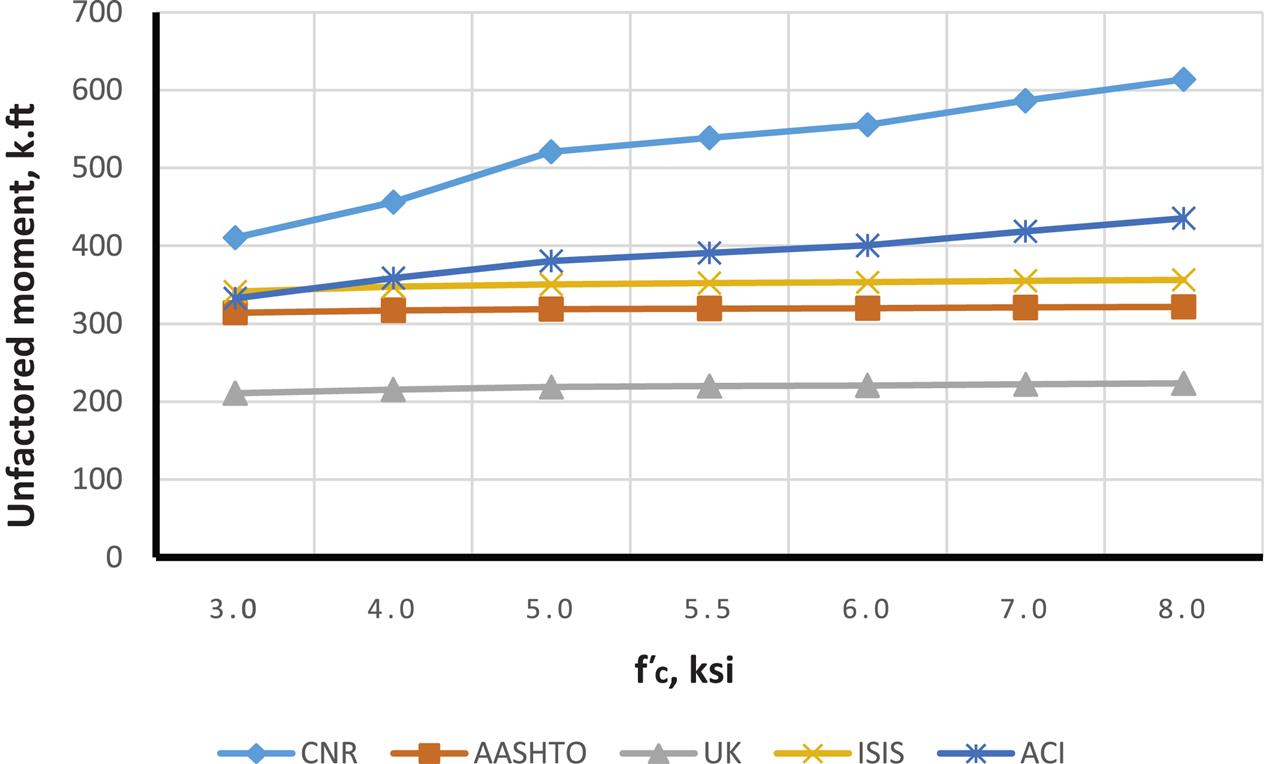
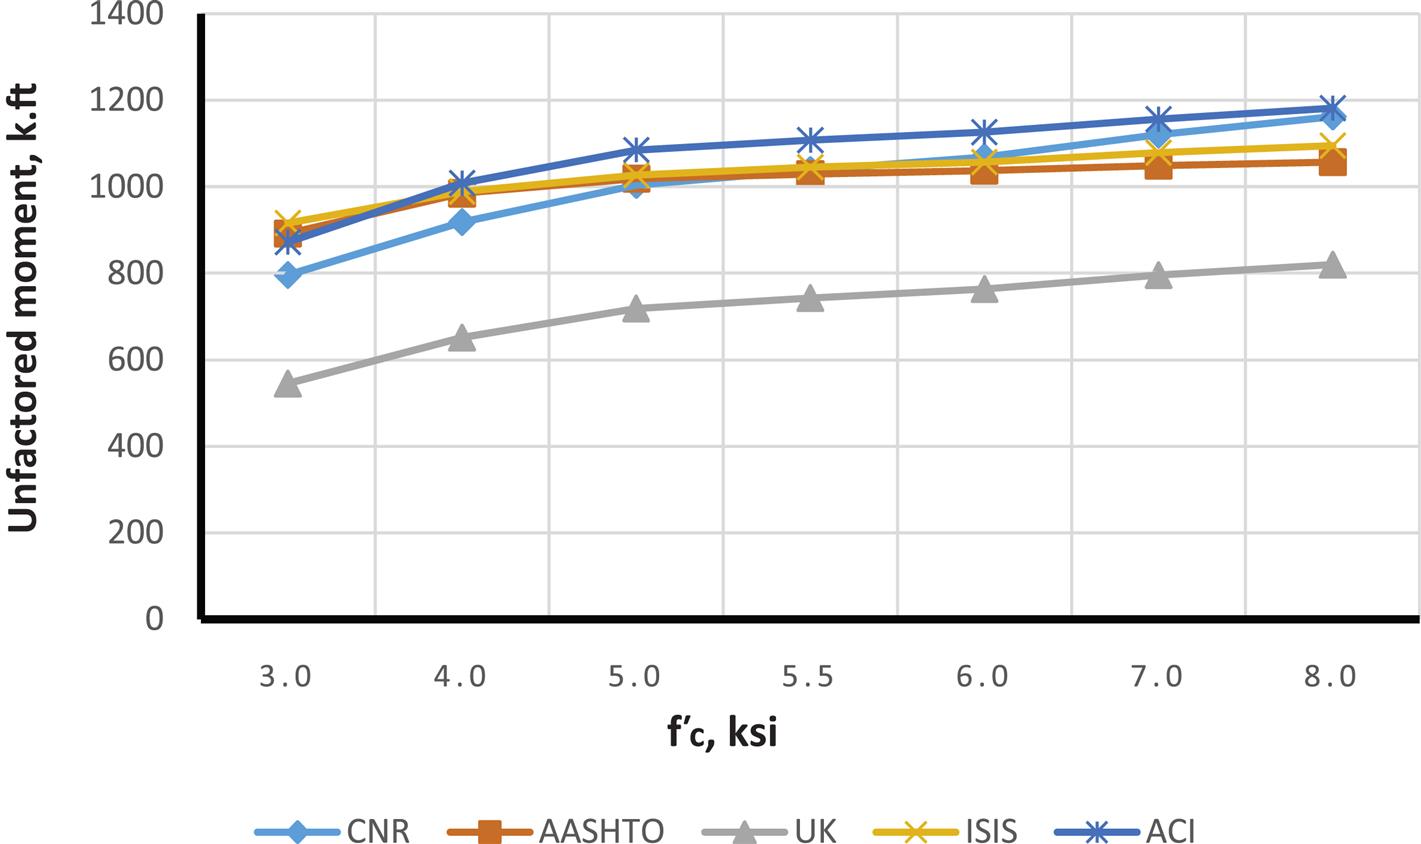
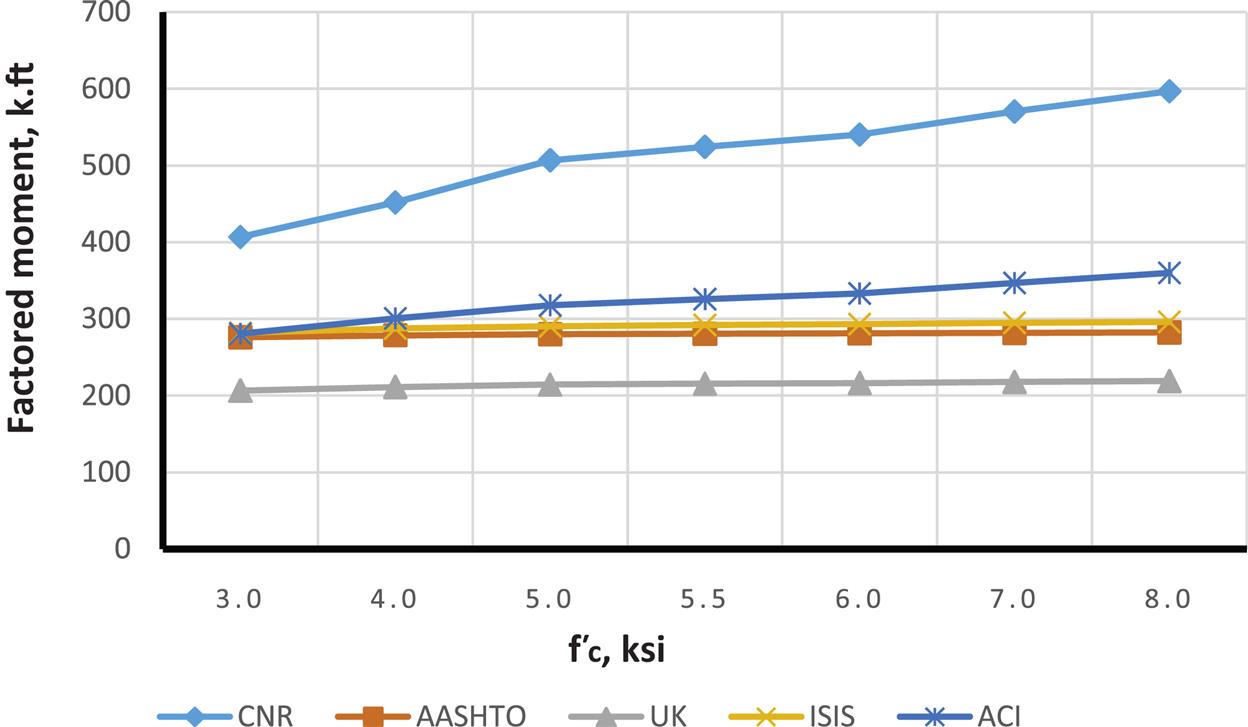
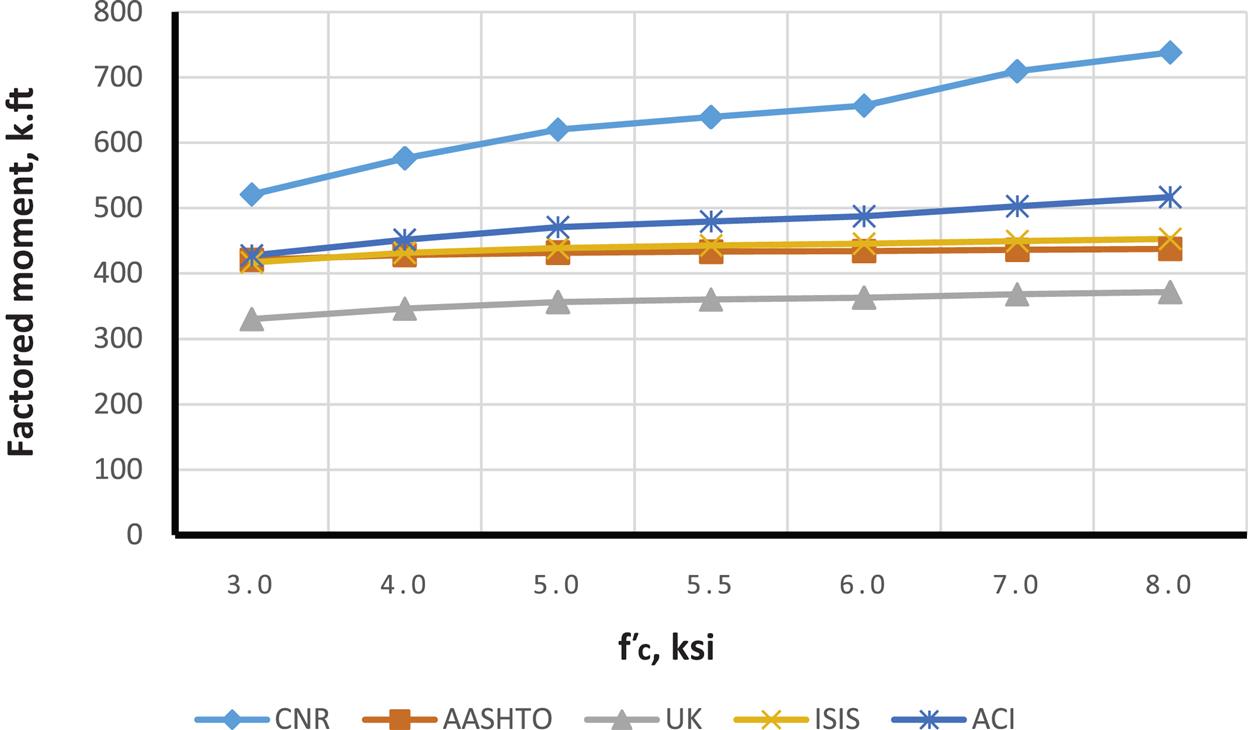
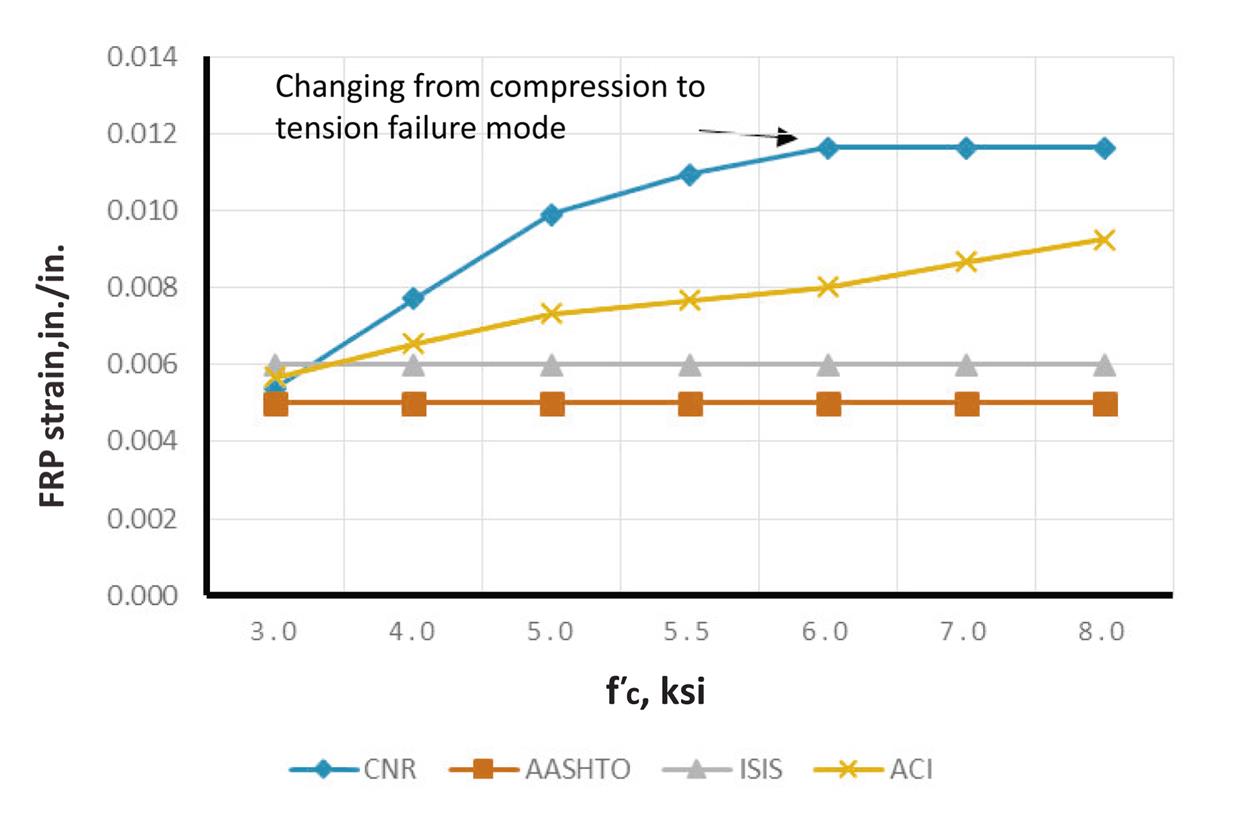
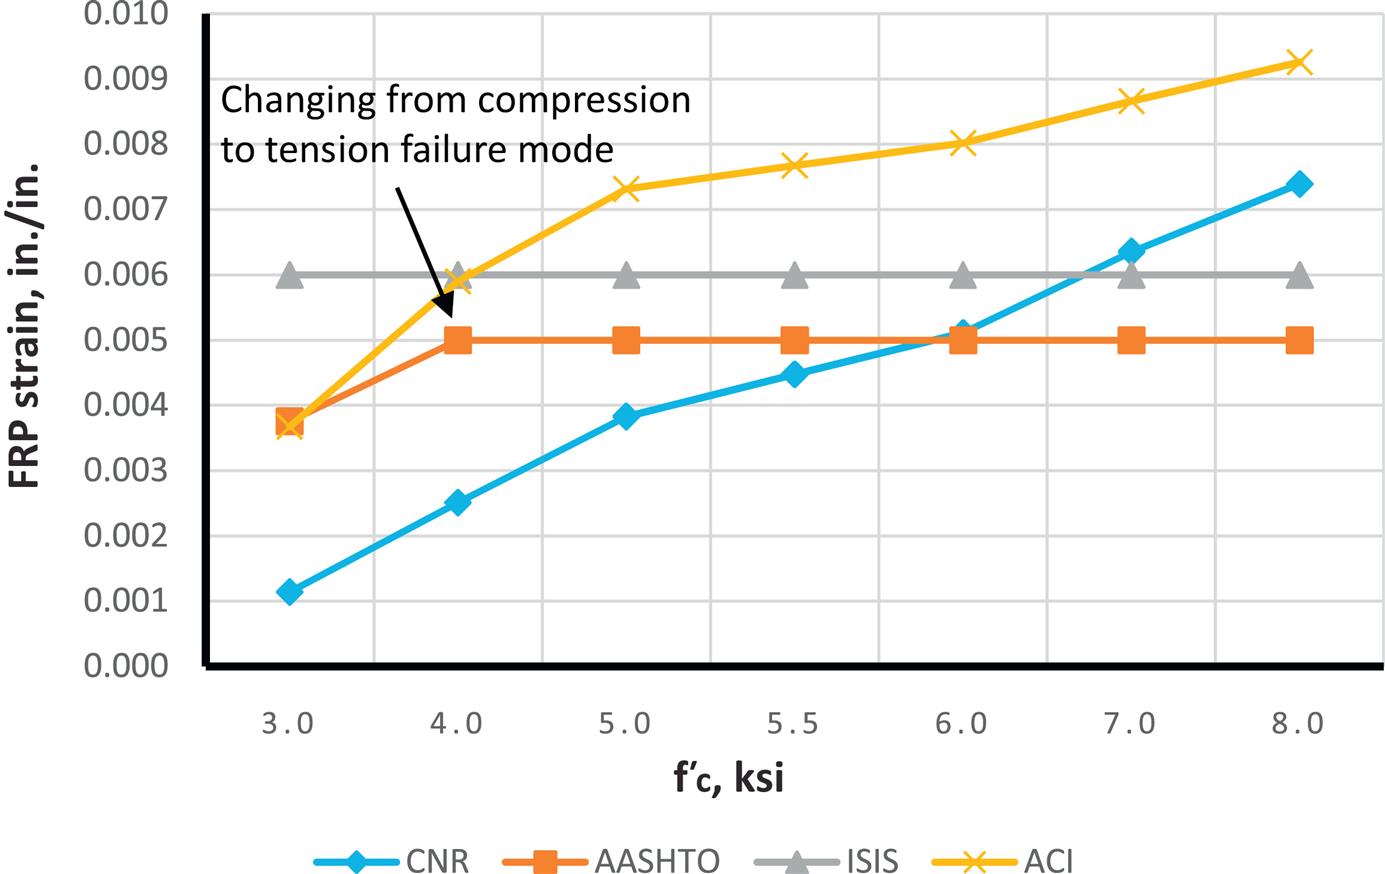
Figs. 4.27–4.35 illustrate the effect of changing ![]() on moment capacity, as a function of several other parameters. For this comparison, FRP area was fixed at three plies of 17 in. wide of MBrace CF130 CFRP. As expected, higher FRP strains result in higher the moment capacities. It was also found that ACI results in higher values for FRP strain as well as factored and unfactored moments when compared to other codes. For lower steel reinforcement ratios (ρ=0.0033 and 0.0064), tension failure is the dominant mode of failure, though the higher value for ρ(0.0171), when combined with the FRP, results in possible compression failures (for example, AASHTO and CNR transition from tension failure into compression failure at the 0.0171 steel reinforcement ratio).
on moment capacity, as a function of several other parameters. For this comparison, FRP area was fixed at three plies of 17 in. wide of MBrace CF130 CFRP. As expected, higher FRP strains result in higher the moment capacities. It was also found that ACI results in higher values for FRP strain as well as factored and unfactored moments when compared to other codes. For lower steel reinforcement ratios (ρ=0.0033 and 0.0064), tension failure is the dominant mode of failure, though the higher value for ρ(0.0171), when combined with the FRP, results in possible compression failures (for example, AASHTO and CNR transition from tension failure into compression failure at the 0.0171 steel reinforcement ratio).
4.3 Shear FRP strengthening of RC/PC bridge members
4.3.1 Introduction
A review and analysis of the shear strengthening provisions for concrete bridge members with FRP is presented in this section for the six reviewed guidelines. The organization of this section is based on the framework presented in ACI 440.2R-08 since it offers the most complete coverage of the subject. The specific items for analysis and comparison include:
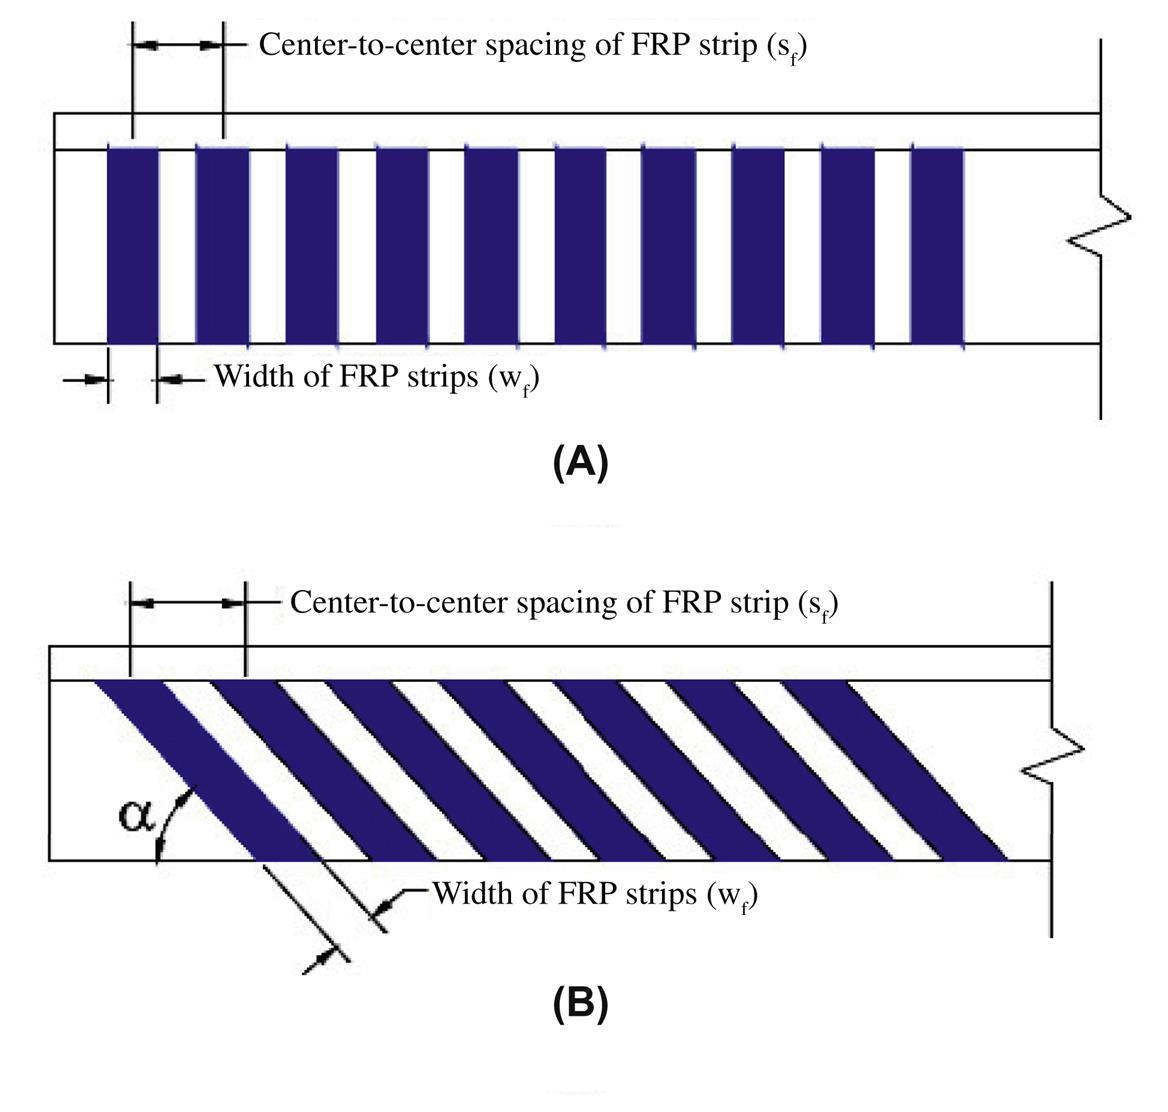
4.3.2 Wrapping schemes
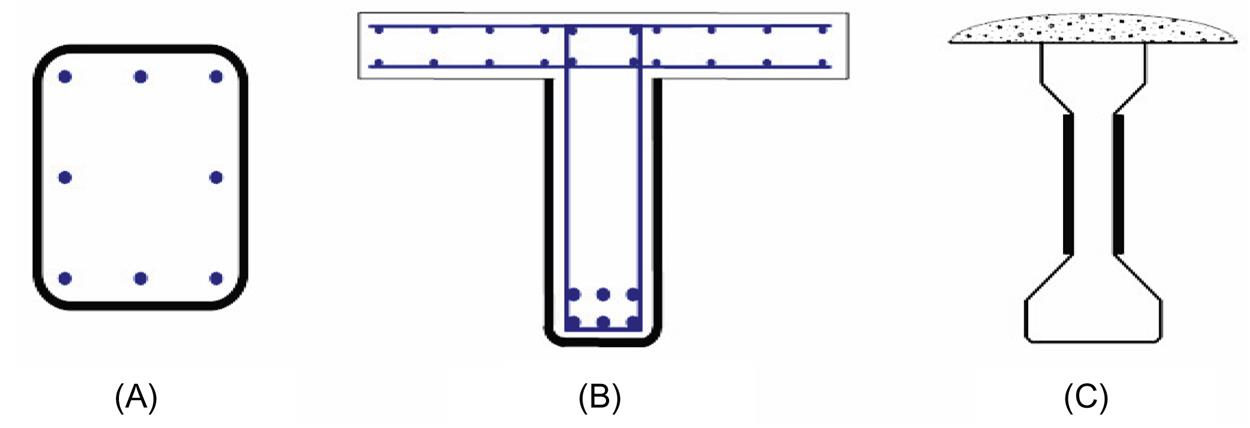
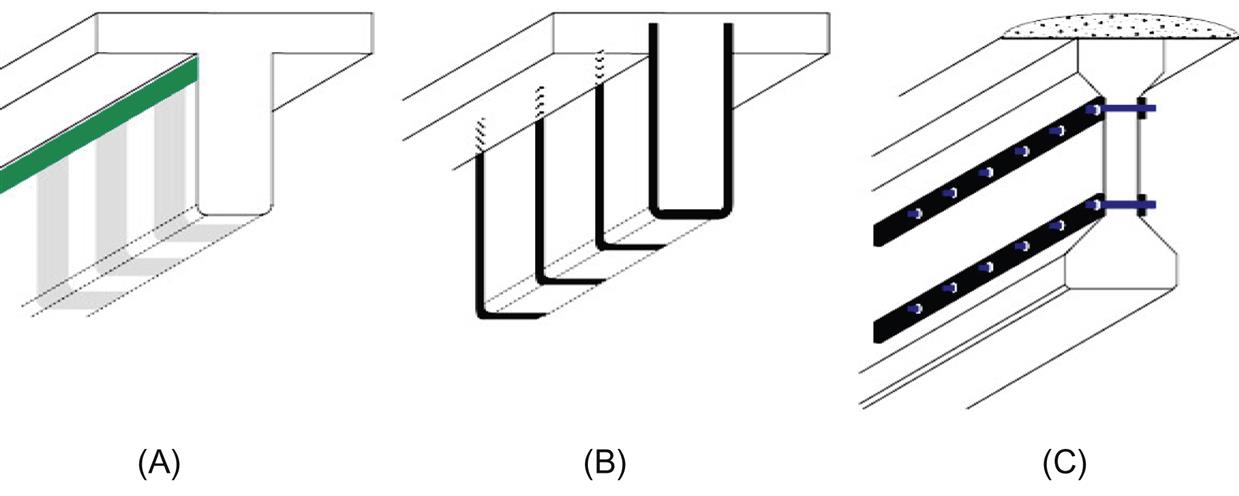
Three types of wrapping schemes are generally used to increase the shear strength of rectangular beams: four-sided (complete or “closed”) wrap, three-sided (U-wrap), and two-sided wrap, as shown in Fig. 4.37. Each standard mentions these three types, and some offer recommendations and comments, which are summarized below.
4.3.2.1 ACI
ACI notes that the completely wrapped scheme is the most efficient, followed by the three-sided U-wrap, although complete wrap is more common in columns. In all wrapping schemes the FRP system can be installed continuously along the span of a member or placed as discrete strips (Fig. 4.36). However, the use of continuous FRP that completely encases a member is discouraged since it potentially prevents migration of trapped moisture.
4.3.2.2 AASHTO
Similar to ACI, AASHTO notes that the two-sided wrap is least effective, as it is subject to premature debonding under high shear loads. Similarly, U-wrap schemes may debond prior to a complete wrap scheme, but U-wrap is popular in practice because of its wide applicability and ease of installation. U-wrap, or U-jacketing, can be combined with anchorage to increase the effectiveness of the FRP by anchoring the fibers, preferably, in the compression zone. Properly design anchors can result in the fibers reaching their tensile capacity prior to debonding, permitting the jacket to behave as if it were completely wrapped.
4.3.2.3 ISIS
As with ACI and AASHTO, ISIS recommends the use of closed wrapping in beams whenever possible as this approach is most effective. U-shaped stirrups are recommended when access to the full perimeter of the beam is not possible, as in the case of a T-beam. In the case of AASHTO-type beams (Fig. 4.37) or shear walls, side bonding is the only form of strengthening possible. ISIS notes that two- and three-sided schemes are bond critical and, depending on shear value (discussed in ISIS section 7.4.2), may require anchorage. Fig. 4.38 illustrates the typical anchoring systems described in ISIS.
4.3.2.4 CNR
CNR notes that, for U-wrap schemes, delamination of the ends of the FRP reinforcement can be avoided by using anchors in the form of laminates/sheets and/or bars installed in the direction of the member longitudinal axis. In such cases, the behavior of the U-wrap can be considered equivalent to that of a completely wrapped member.
4.3.2.5 TR55
TR55 recommends that the FRP is placed such that the principal fiber orientation is either 45 or 90 degrees to the longitudinal axis of the member.
4.3.2.6 Wrapping schemes—summary
In summary, there is little difference in the wrapping schemes presented and recommended by the different codes. Essentially, completely wrapped sections, three-sided wrap, and two-sided wrap are considered, where the wrapping can be continuous or in parallel strips either at 90 degrees to the member direction or at an inclined angle. Detailed provisions to determine the strength of such schemes differs somewhat among codes and is discussed in Section 4.3.6.
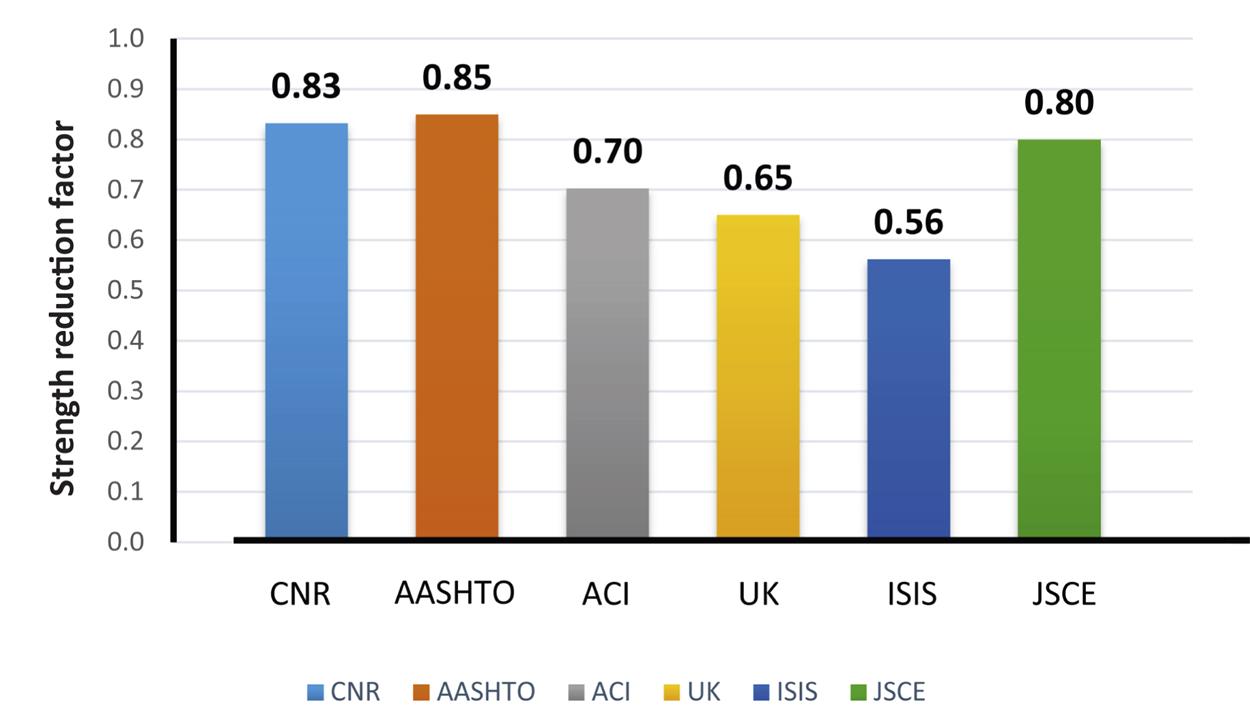
4.3.3 Strength reduction factors
FRP shear strength reduction factors are summarized in Fig. 4.39 for the different codes. The largest reduction value (most conservative) is adopted by ISIS (0.56) and the smallest value (least conservative) is adopted by AASHTO (0.85). It is noted that AASHTO uses other limits such as restricting the maximum FRP stirrup spacing, depending on the total shear value. Similar to flexure, the highly conservative reduction factor for shear given by ISIS is attributed to the fact that the ISIS factor incorporates environmental and material reduction factors as well.
4.3.4 Reinforcement limits and spacing limits
4.3.4.1 ACI
Shear strengthening limits
The sum of the shear strengths provided by the FRP and existing shear reinforcement are to be limited to the criteria given for steel alone, as given in ACI 318. This limit is given in terms of four times the nominal shear strength of the concrete (![]() ), and is expressed as
), and is expressed as
(4.68 – ACI Eq. 11.11)
(4.69)
Spacing of FRP strips
For external FRP shear strengthening in the form of discrete strips, ACI specifies limits in articles 11.1 and 11.4.2. Article 11.1 stipulates that the center-to-center spacing between the strips should not exceed the sum of d/4 plus the width of the strip. Moreover, Article 11.4.2 states that spacing limits should follow those given in ACI 318, which are as follows (Eqs. (4.70) and (4.71)):
(4.70)
(4.71)
4.3.4.2 AASHTO
Maximum FRP shear reinforcement
In AASHTO the amount of FRP used cannot result in a section with nominal shear strength exceeding the limit given in Eq. (4.72):
(4.72 – AASHTO Eq. 5.8.3.3-2)
where
(4.73)
The factored shear strength, ![]() , is defined as
, is defined as
(4.74 – AASHTO Eq. 4.3.1-1)
where ![]() =the nominal shear strength provided by the concrete in accordance with Article 5.8.3.3 of the AASHTO LRFD Bridge Design Specifications
=the nominal shear strength provided by the concrete in accordance with Article 5.8.3.3 of the AASHTO LRFD Bridge Design Specifications
(4.75 – AASHTO Eq. 5.8.3.3-3)
![]() =the nominal shear strength provided by the transverse steel reinforcement in accordance with Article 5.8.3.3 of the AASHTO LRFD Bridge Design Specifications
=the nominal shear strength provided by the transverse steel reinforcement in accordance with Article 5.8.3.3 of the AASHTO LRFD Bridge Design Specifications
(4.76 – LRFD Eq. 5.8.3.3-4)
where
(4.77)
![]() =component of the effective prestressing force in the direction of applied shear as specified in Article 5.8.3.3 of the AASHTO LRFD Bridge Design Specifications;
=component of the effective prestressing force in the direction of applied shear as specified in Article 5.8.3.3 of the AASHTO LRFD Bridge Design Specifications; ![]() =the nominal shear strength provided by the externally bonded FRP system in accordance with AASHTO Article 4.3; ϕ=0.9;
=the nominal shear strength provided by the externally bonded FRP system in accordance with AASHTO Article 4.3; ϕ=0.9; ![]() =FRP resistance factor=0.85.
=FRP resistance factor=0.85.
4.3.4.3 Summary
Table 4.21 summarizes expressions for shear reinforcement limits by different codes, while Table 4.22 summarizes spacing limits.
Table 4.21
Maximum shear resistance allowed
| Code | Limit | Equation |
| AASHTO | Maximum total allowable shear | |
| where | ||
| CNR | Maximum total allowable shear | |
| ACI | Max. shear by steel and FRP | |
| UK | Maximum permissible shear stress | 0.8 |
| ISIS | Max. strengthening (bridge code) |
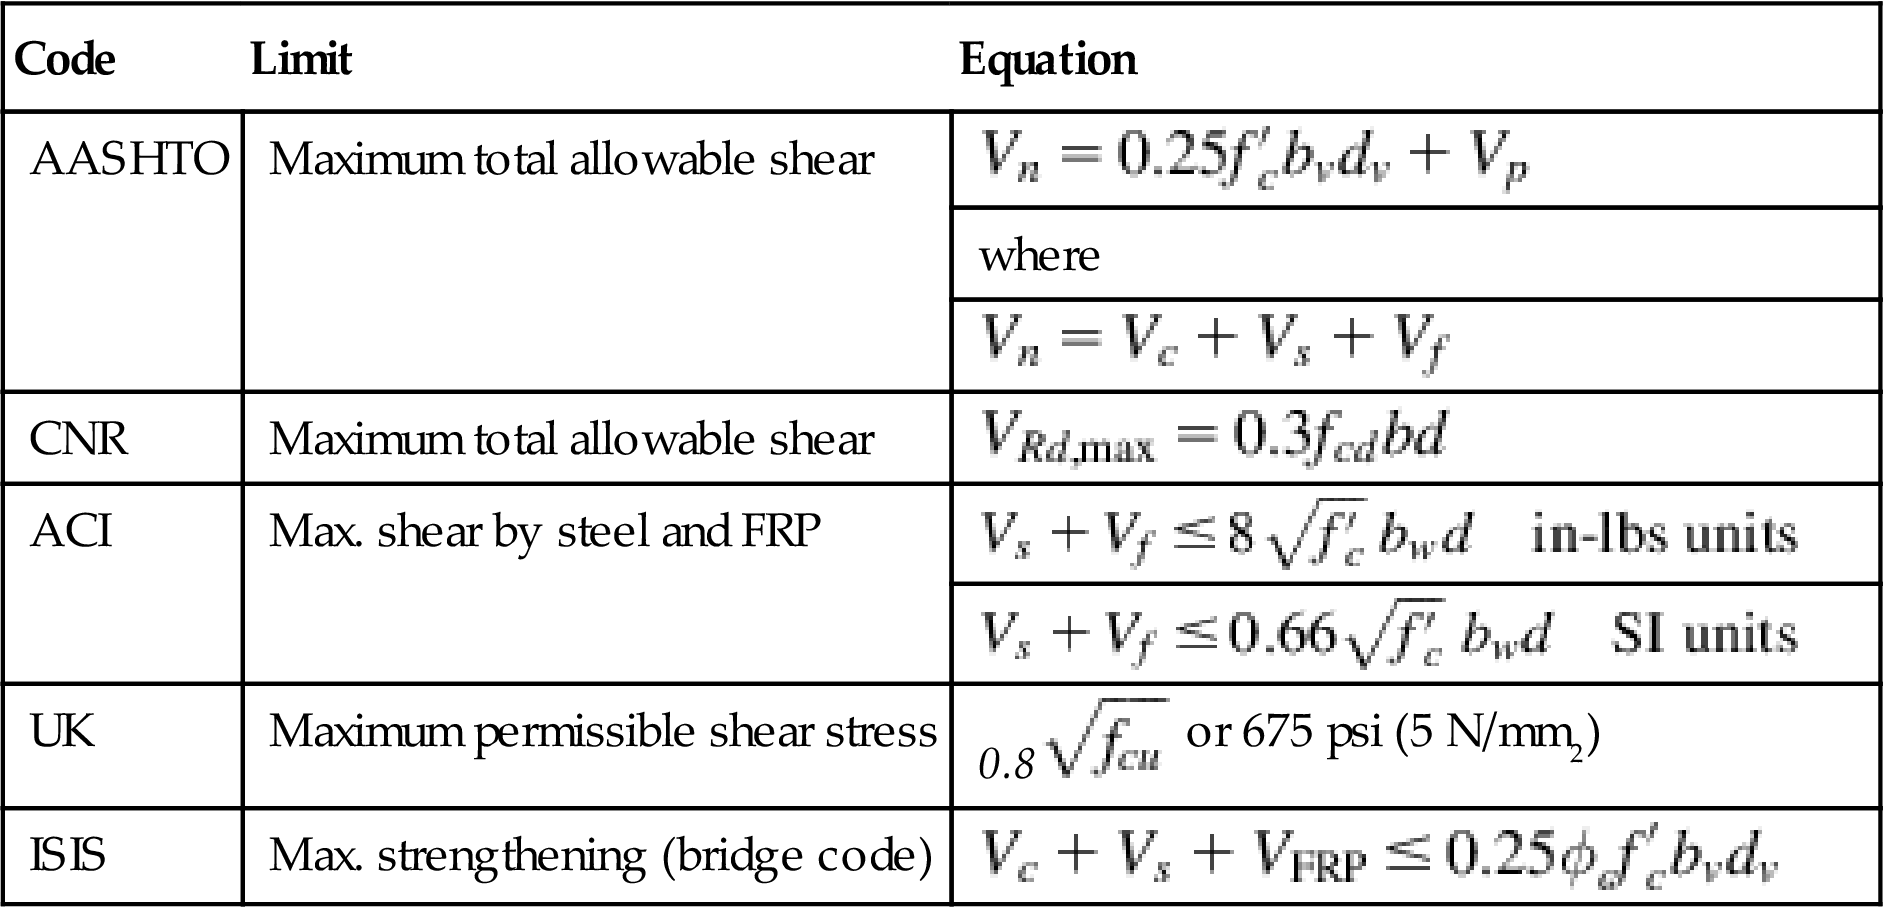
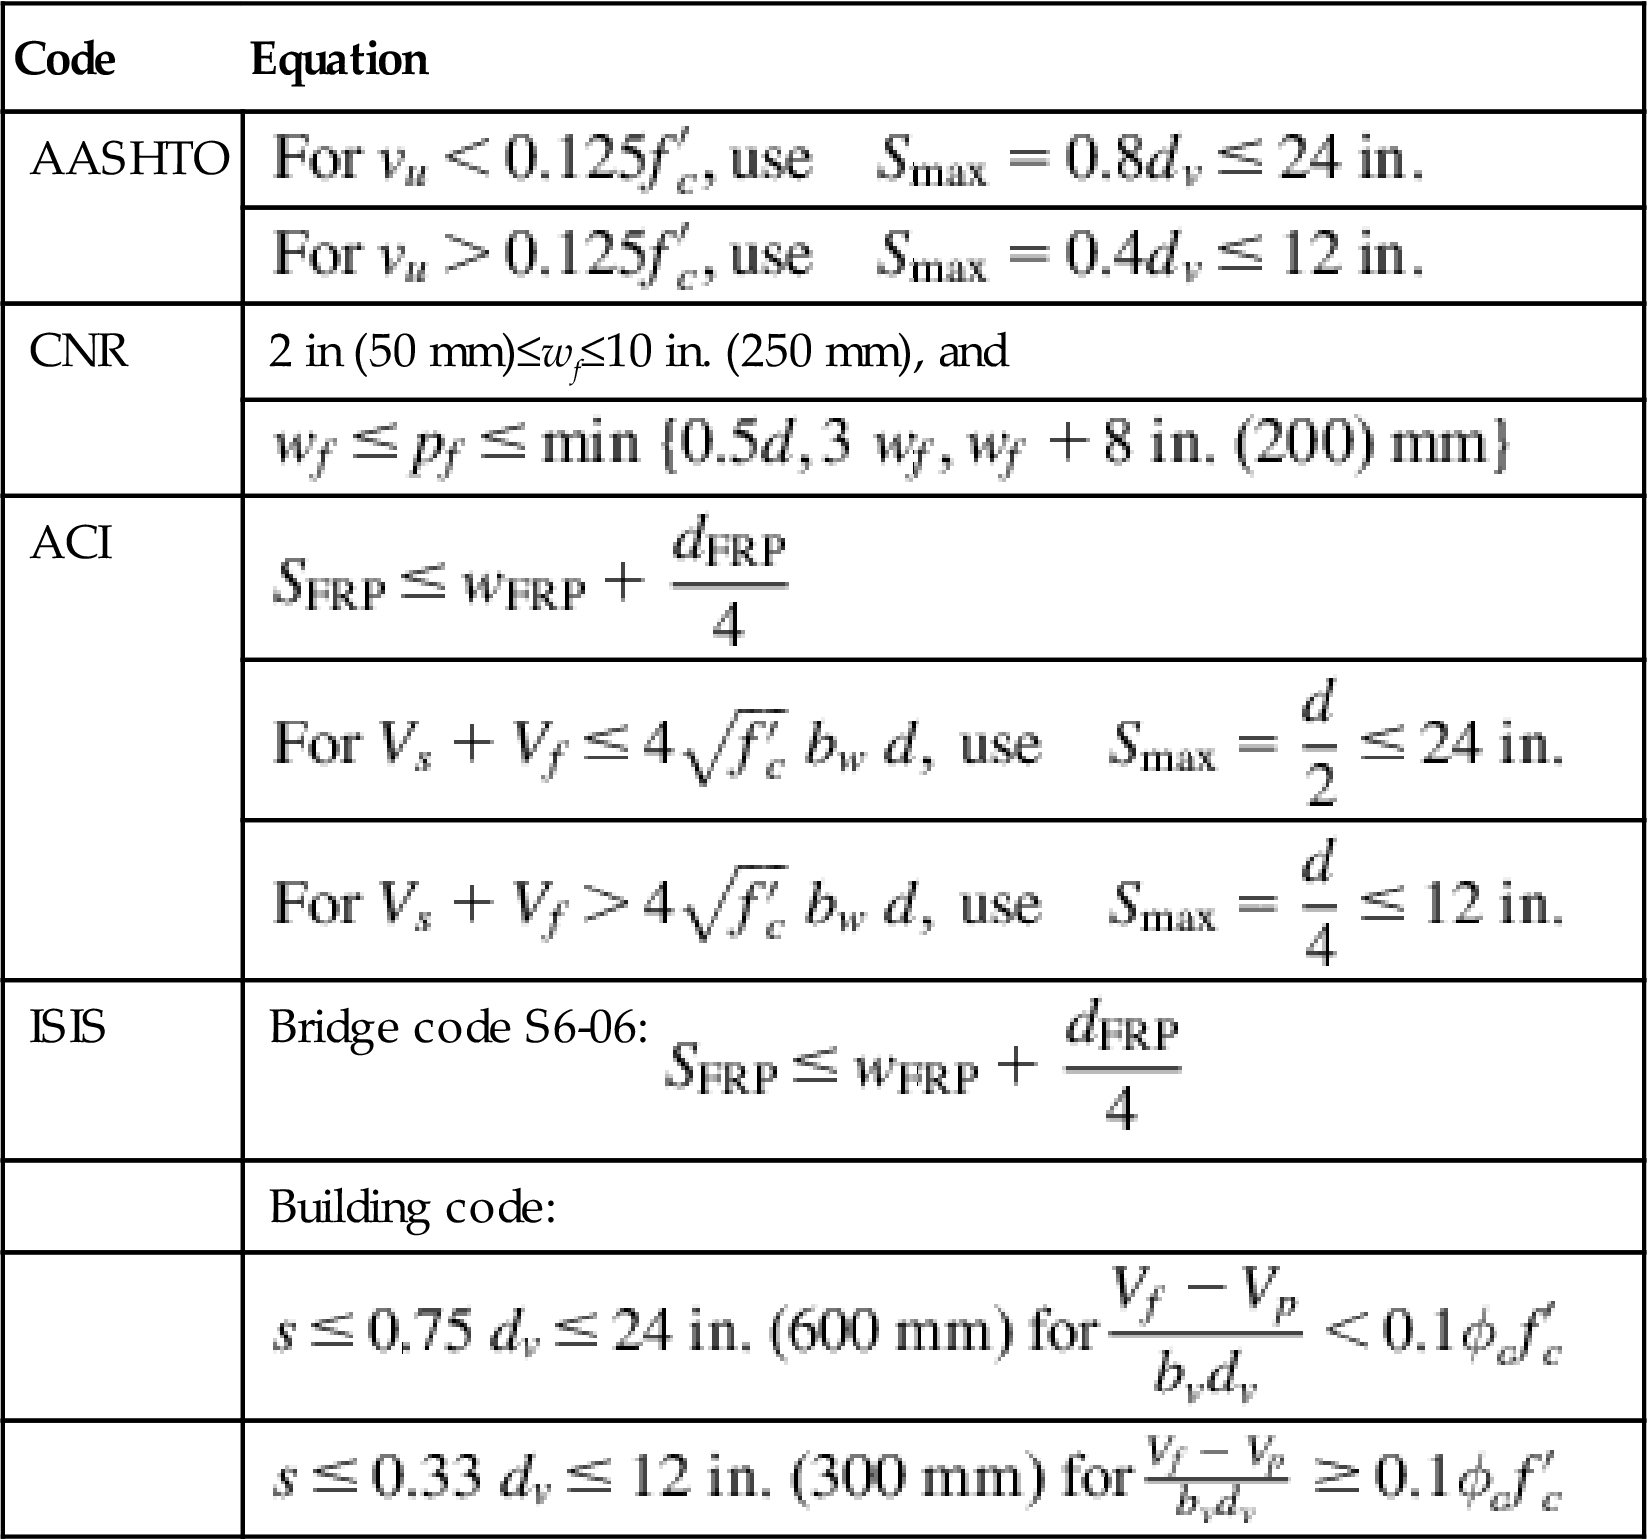
Table 4.22
Maximum spacing of FRP shear reinforcement
| Code | Equation |
| AASHTO | |
| CNR | 2 in (50 mm)≤wf≤10 in. (250 mm), and |
| ACI | |
| ISIS | Bridge code S6-06: |
| Building code: | |
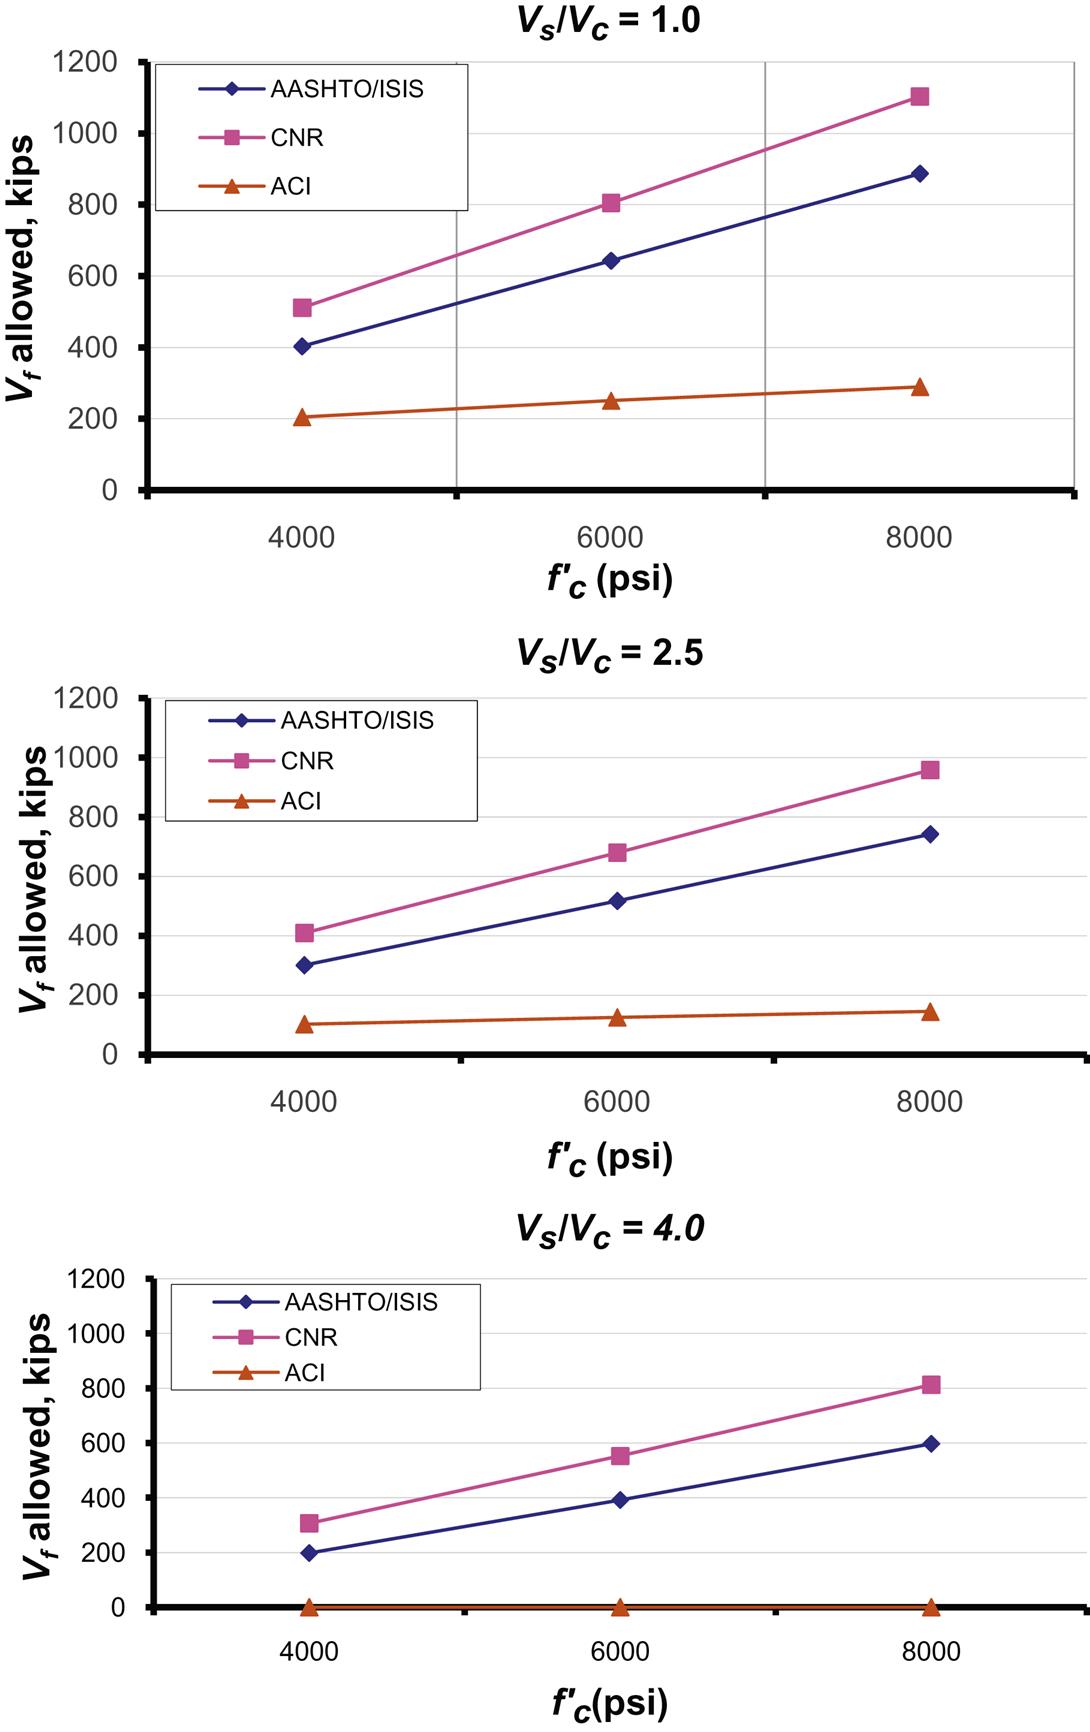
As shown in Table 4.21 the maximum combined shear contribution is a fixed value for a given section. For this reason the amount of allowable FRP shear reinforcement depends upon the amount of steel shear reinforcement present in the section (and associated shear capacity of the steel stirrups Vs). The effect of the existing level of Vs on the allowed FRP shear capacity (Vf) is shown in Fig. 4.40, for different ratios of ![]() and values of
and values of ![]() . An obvious observation is the increase in allowed FRP shear strengthening with an increase of
. An obvious observation is the increase in allowed FRP shear strengthening with an increase of ![]() . It is also seen that ACI is most restrictive, while CNR allows the most strengthening, while AASHTO and ISIS fall between these bounds. Notice that for ACI, with a
. It is also seen that ACI is most restrictive, while CNR allows the most strengthening, while AASHTO and ISIS fall between these bounds. Notice that for ACI, with a ![]() ratio of 4.0, no FRP shear strengthening is allowed (Fig. 4.40) (Fig. 4.41).
ratio of 4.0, no FRP shear strengthening is allowed (Fig. 4.40) (Fig. 4.41).


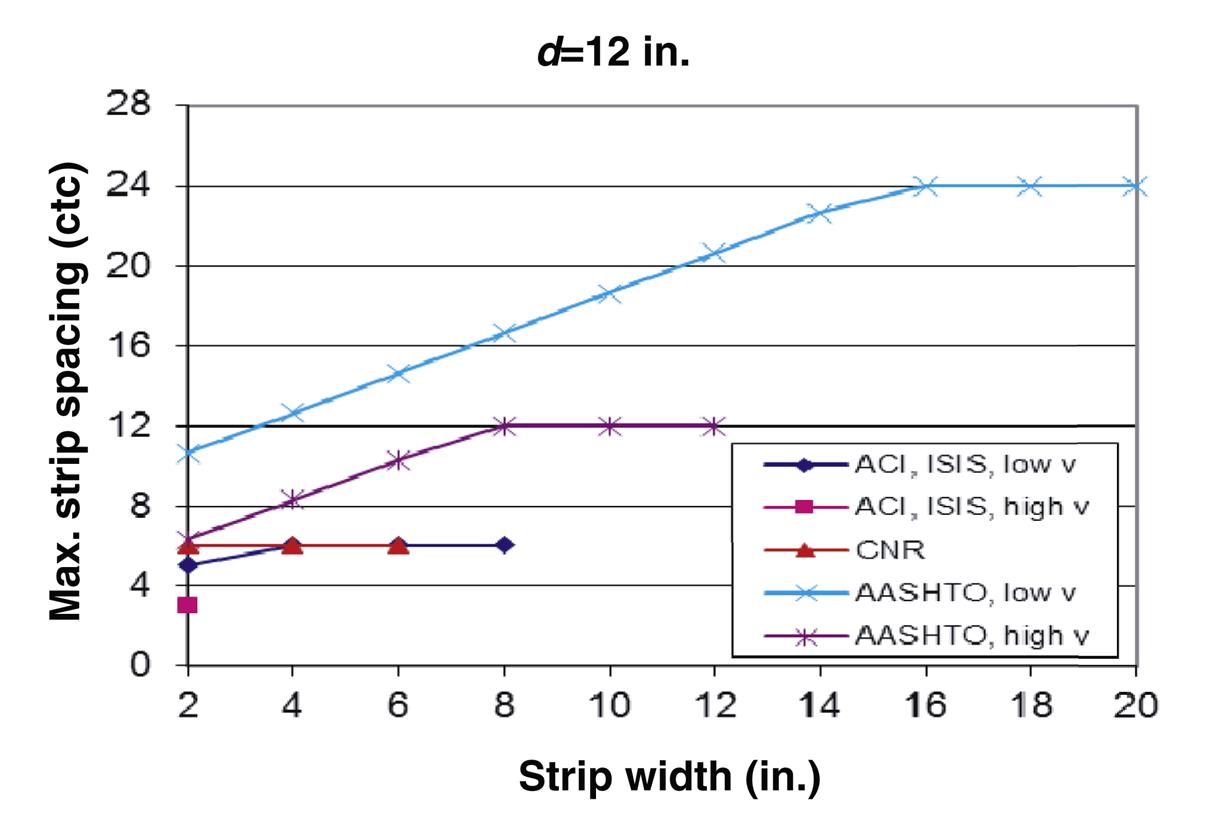
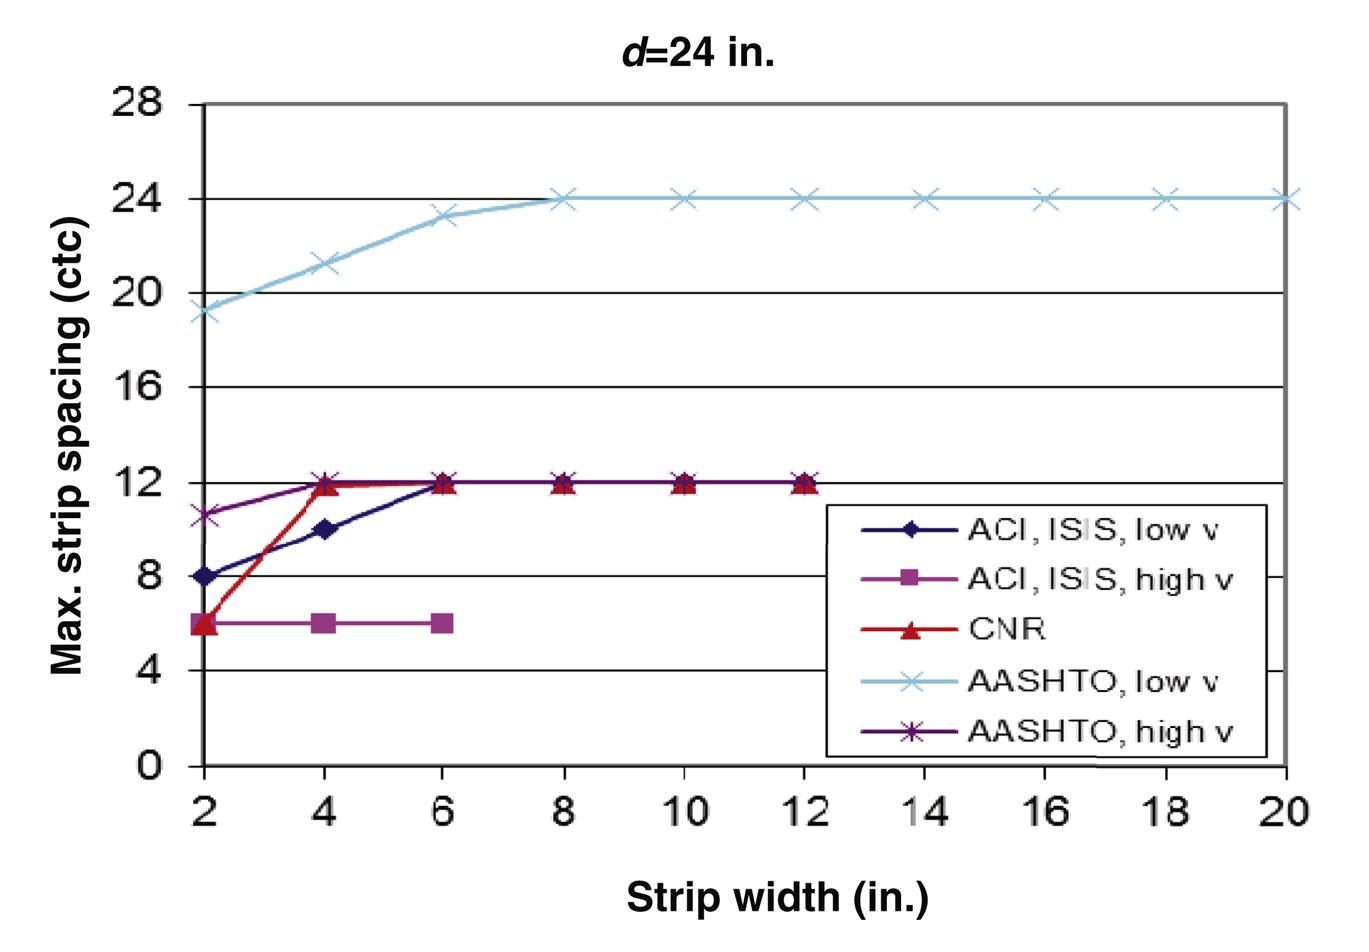
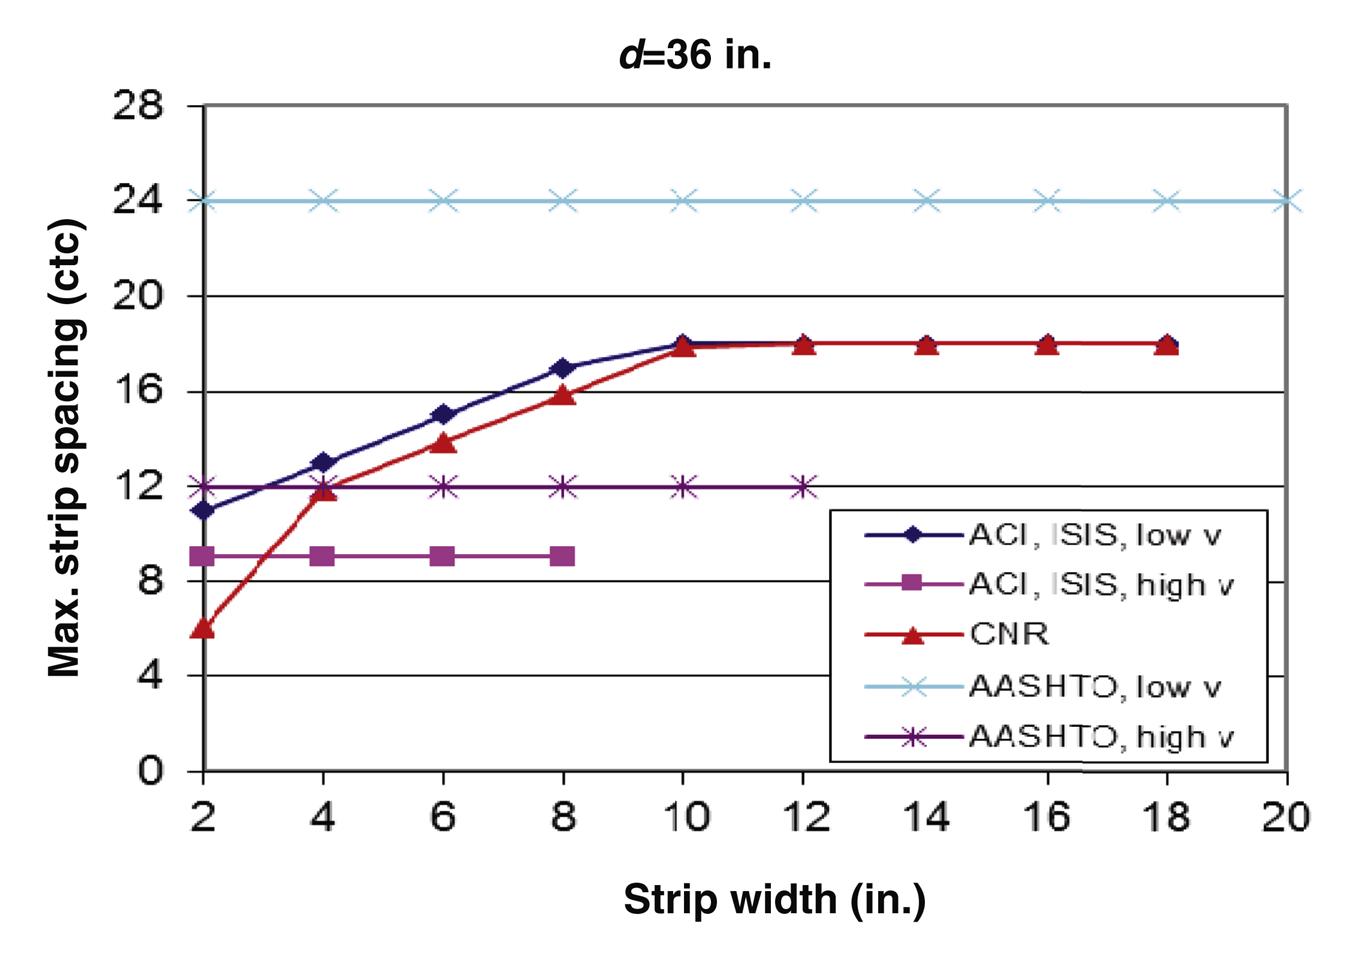
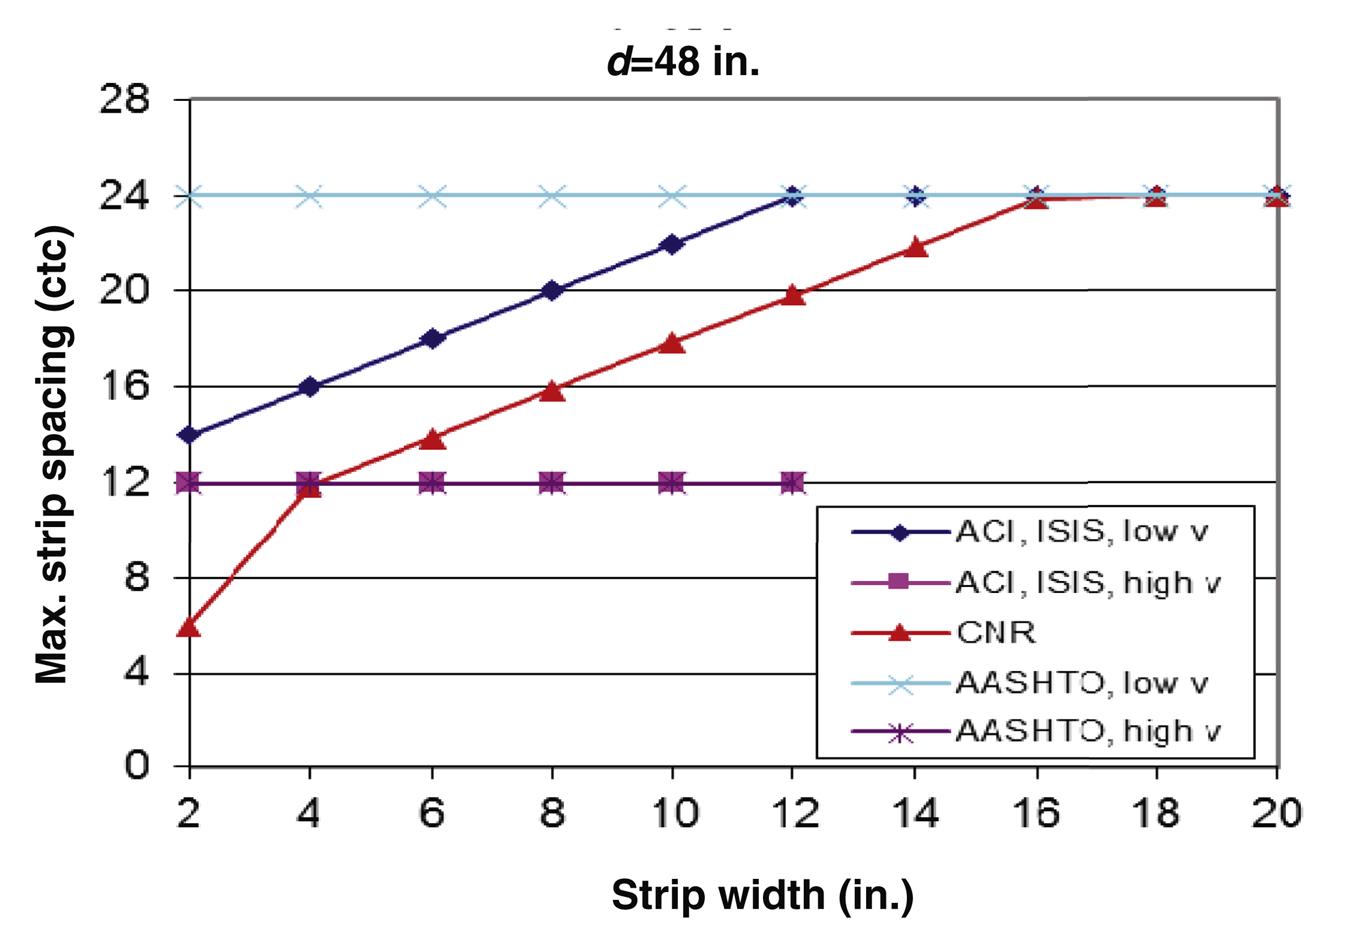
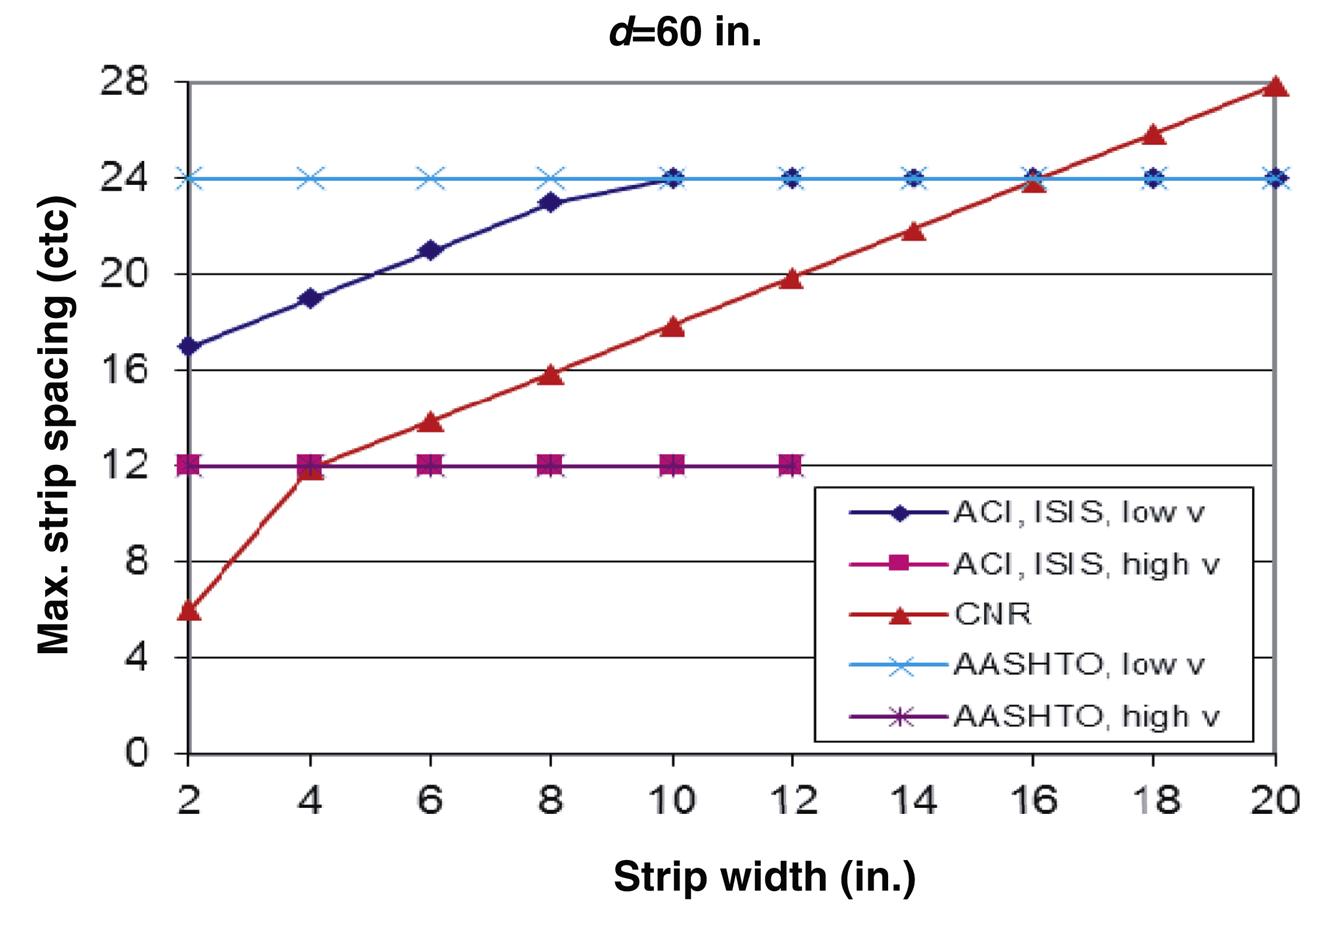
The effect of the FRP strip width on spacing limits for different codes is evaluated for different beam depth using beam dimensions provided in Section 4.3.6.7 of this book. Beam depths considered are 12, 24, 36, 48, and 60 in. Figs. 4.41–4.45 present the maximum spacing limits as a function of strip width for different codes. Except for CNR and ISIS, codes have different maximum spacing limits depending the applied shear value. For most codes, spacing limits for low shear values fall between 10 in. and 20 in., while for high shear values, limits fall between 5 in. and 10 in. Limits are generally expressed as a function of concrete compressive strength. However, the ISIS S6-06 bridge code spacing limit is independent of concrete compressive strength ![]() and is a function of the depth
and is a function of the depth ![]() and strip width
and strip width ![]() .
.
4.3.5 FRP design strain limits
4.3.5.1 ACI
For completely wrapped members with FRP, ACI sets the following FRP strain limit to prevent wide cracks from forming that could cause a loss of aggregate interlock in the concrete (Eq. (4.78), ACI Eq. 11-6a):
(4.78 – ACI Eq. 11-6a)
For U-wrap and two-sided wrap schemes, aggregate interlock is preceded by FRP delamination. Therefore setting strain limits to prevent delamination failure is the control criterion. The following strain limit equation incorporates a bond-reduction coefficient ![]() applicable to shear (Eq. (4.79), ACI Eq. 11.6b):
applicable to shear (Eq. (4.79), ACI Eq. 11.6b):
(4.79 – ACI Eq. 11.6b)