CHAPTER 11
Supply Chain Cost Planning Tools
AS CUSTOMERS ORDER MORE or less volume of products, change the mix of a firm's products they use, or alter demands for services, several questions become critical for supply chain managers. What is the financial impact of these changes for the firm? What will future profit‐and‐loss statements look like? How will profit margins change? If a change is made, what will be the impact on resources and future expenses?
When questions like these are asked, one needs more than a crystal ball to answer them. This is when the focus turns to the predictive view of supply chain costing. A variety of costing tools exist that are valuable for supply chain cost planning. This chapter examines several of these tools.
The best time to manage costs is before they are incurred. By carefully evaluating actions in advance, supply chain managers can avoid decisions that commit them to higher than necessary future costs. Modeling cost behavior, listening to customers, carefully evaluating value chain relationships, estimating future costs, analyzing the acquisition of capital assets, and focusing on core competencies are all important elements of cost planning.
Cost estimation is an inherent part of every supply chain costing tool. Measures of incurred costs are useful for predicting future costs. Budgeting, capital budgeting, target costing, and even simple cost volume profit models are each built on multiple types of cost estimation.
Cost volume profit (CVP) models are among the most widely understood and used cost planning tools. Managers use CVP models to help improve cost structures and to provide quick “go no‐go” answers on projects. Powerful “what‐if” models based on CVP allow managers to study the effects of changing prices and production quantities on costs and profits.
BUDGETING—USING WORK ACTIVITIES
The annual budget is the most widely used management accounting planning and control tool in most organizations. Budgeting is the primary tool that businesses use to help plan resource inflows and outflows and to maintain costs and profits at an acceptable level. A budget is a quantitative financial plan that requires both physical and financial estimates. For example, an estimate of the number of miles trucks will drive is converted into a financial estimate of fuel costs.
Ideally the budgeting process should require individuals to focus on what they do (their work activities) and on what resources (money, time, goods) they need to complete these activities. The budget is a tool that can be used to reach agreements on and commitments to pursue common objectives and then direct spending to items essential for meeting these objectives. The budget is where supply chain managers make their case for the resources they need. At their core, these budgets are about resource capacity planning—the ability to convert and reflect physical operational events into the language of money: expenses and costs.
The annual budget is often perceived as a fiscal exercise done by the accountants that: (1) is disconnected from the executive team's strategy, and (2) does not adequately reflect future volume drivers. The budget exercise is often scorned by managers as taking months to prepare and then being obsolete soon after it is produced; requiring two or more executive “tweak” adjustments to the numbers they want; shortchanging the departments that have valid increased needs in the coming year; retaining and incorporating process inefficiencies from the current year; and being biased to politically muscled managers who know how to sandbag their budget request. There is a collective organizational groan at budget time.
Enlightened managers are increasingly demanding budgets that can be readily adjusted to reflect changes in their circumstances. There is growing use of short‐term rolling financial forecasts where future period assumptions, especially sales volume and product mix forecasts, become more certain. Knowledge of the activities that occur, what people do, what resources they use, and what these resources cost are essential elements of supply chain costing. Building budget requests based on this type of activity knowledge, activity‐based budgeting, is almost certain to result in more realistic supply chain resource requests and more effective cost management.
The budgeting process represents an important part of the supply chain cost management toolkit. Given the importance firms attach to better understanding their activities (such as setting standards), the development of supply chain budgets based on work activities is likely to be particularly valuable. It is a natural evolution from the current budget process to a more effective tool for planning cost information.
Activity‐Based Budgeting: An Improved Cost Planning Tool
An activity‐based budget focuses on the work required to complete a process or activity (such as loading a truck). This information helps managers improve planning, identify opportunities for cost improvement, and make the budget adjustments that are inevitable in a dynamic environment. It helps managers determine that adequate capacity exists to complete planned activities and to identify areas where capacity is significantly underutilized. Large portions of the supply chain processes fall into the categories of manufacturing overhead, distribution, selling, and administrative costs—areas that in traditional budgeting are often given the least attention, even though the relative level of costs in these areas are rapidly increasing. Preparing a budget based on the work activities in these areas will focus more attention on measuring and managing supply chain costs.
Advances in activity‐based costing (ABC) principles, which were discussed in Chapter 10, aid in calculating projected outcomes. Simply stated, if a historical ABC model is constructed and its results are calculated for the descriptive view of past period costs, the ABC model can be calculated backward for the predictive view of costs. In contrast to historical ABC, where the resource and expense is known but the costs of processes with their work activities and outputs are not (they are calculated), reverse estimates are used for budgeting. Estimates are based on forecasts of the future period sales volume and product mix of outputs, including services, and the resulting resource expenses to supply capacity are derived. In this scenario, the outputs are known (estimated), and the manager solves for the unknown resources.
Activity‐based budgeting (ABB) is still a relatively new cost planning tool and budgeting tool that many supply chain managers are likely to be unfamiliar with. To understand it, go back and review Exhibit 10.4 and imagine that all the line arrows, which are the cost drivers, are now going in reverse from bottom to top. That is what is happening every minute, day, week, and month. The demands on work flow upward and the costs measure the effect downward. But there is a bonus byproduct from ABC. It is also calculating the unit‐level cost consumption rates. These rates are important. Here is why.
ABB draws on Industrial Engineering 101 principles. It is a form of capacity requirements planning. By forecasting not only the sales volume and product mix but also the quantity of all the other activity cost drivers (e.g., the number of truck deliveries, the number of customer sales calls) from the final cost objects to the work activities and multiplying these drivers by the unit‐level cost consumption rates, the result is the projected costs of the work activities. These then calculate the required resource expenses to match the demand load with the needed supply of capacity—the number and types of employees and the spending amount with suppliers and contactors. To accomplish this, accountants need to think like engineers!
Exhibit 11.1 lists seven steps that should be part of the supply chain budgeting process when this approach is used. Documenting exactly what activities occur and what causes the volume of the activity to change is essential for understanding the supply chain process. The individuals who do the work activities understand it best. They are in the best position to recommend changes when resources are tight, because these employees better understand how the budget relates to what they do. In addition, budgets based on activities are generally easier for operating individuals to understand, and there is more likelihood that there will be buy‐in to meeting budget targets.
EXHIBIT 11.1 Steps in Preparing a Support Budget
Source: Shahid Ansari, Jan Bell, and Thomas Klammer, “Activity Based Budgeting,” in the modular series Management Accounting: A Strategic Focus (Ansari, Bell, Klammer; Lulu.com).
| 1) Document the major activities in each part of the supply chain process. |
| 2) Identify what causes the volume of an activity to occur for each major activity—the activity drivers. |
| 3) Estimate the amount of each activity driver that will be needed. |
| 4) Identify the resources (people, space, equipment) needed to perform the activities. |
| 5) Estimate the cost of providing the necessary resources. |
| 6) Develop a spending request that documents the basis for the request. |
| 7) Consolidate requests into the master budget for the department, function, division, or firm. |
To be useful for planning, budget estimates must be realistic. Historically, budgets, particularly support budgets, were built primarily on incremental percentage changes, up or down, from each cost center's prior‐year spending. In a stable environment this may be acceptable, but in a dynamic environment budgets must be easily adjustable to changed circumstances. The use of rolling financial forecasts, based on recent transactions and events, as well as the use of activity cost information to build and adjust budget, gives more validity to change estimates and makes the budgets better planning tools.
In many organizations, the budget has become primarily a control tool—in most cases ineffective—rather than a planning tool. Managers are held to spending targets based on annual budgets that are widely viewed as unreliable before the budget period even begins. A “use it or lose it” mentality exists. Game playing with the budget estimates becomes common. Short‐run behavior detrimental to the organization, but helpful in meeting the budget, becomes the norm. Activity‐based budgeting has the potential to revitalize the budget as an important supply chain planning tool.
TARGET COSTING
Supply chain professionals are under constant pressure to take costs out of supply chain processes. Because most costs are committed even before production begins, it is more effective to manage costs early. Target costing and its variations are tools that firms increasingly use to estimate and manage the cost of a new product or service during their design and development and before they are introduced.
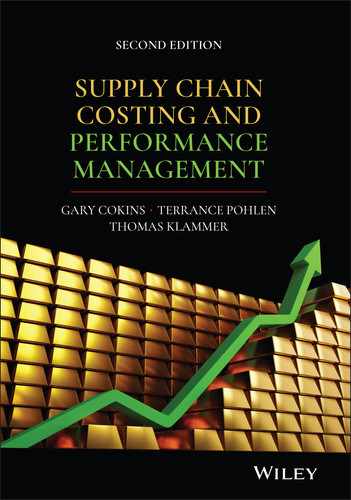
The ability to design and implement these cost reduction opportunities prior to “first piece” production enables firms to achieve considerable cost savings. They then have the greatest opportunity to meet the customers' requirements at the lowest cost during the concept and design phases. The decisions made during this phase commit the firm to costs that would not be incurred until into production and deployment (see Exhibit 5.1). Changes made later, such as through kaizen costing, would be unable to achieve the same level of potential cost reduction.
Target Costing Process
Target costing is market driven. A target cost is an estimate of the amount of cost that can be incurred while still permitting the firm to earn a required profit. A market price that will maximize revenues is established first and the required profit margin is subtracted to calculate the target cost. It is an equation. Price minus profit equals the target cost. A cost‐plus‐a‐profit markup pricing mentality is traditional, but it ignores the arguably more important variable—the optimal price to maximize revenues.
The cardinal rule with target costing is that the target cost becomes the maximum allowable cost. So, as the product concept, design, specifications, and components are planned, if the initial sum total of the purchased or manufactured components and the labor costs to make the individual product exceeds the maximum allowable cost, it fails the cardinal rule. This creates pressure on the product designers to alter the prototype design of the product so it can be more efficiently manufactured, reducing labor costs and using fewer or lower‐priced purchased components from suppliers. Before first‐piece production can be approved, the product's cost must be at or below the target maximum allowable cost from the equation.
Unlike traditional costing, target costing includes all types of costs—production, selling, and administrative. It also considers all life‐cycle costs. Product and process design occur concurrently to maximize cost reduction opportunities. Information from activity‐based costing can be useful by viewing ABC cost rates to make and assemble similar existing products and apply them to the new product's design.
Exhibit 11.2 illustrates the inputs that determine the target selling price and the target profit margin that net to the maximum allowable cost. From the bottom upward in the exhibit, as the estimated product sums to the “expected cost,” it is continuously tested until the expected cost equals (or is lower than) the maximum allowable target cost. Until it does, pressure is transmitted with cost reduction actions until the matching is satisfied.
The use of cross‐functional teams (that include outside entities within the value chain) is essential. Typically, achieving a target cost is not feasible unless a firm creates collaborative relationships with all members of the supply chain.
Comprehensive target costing is a complex process. Many steps and activities must occur to achieve the target cost. Exhibit 11.3 identifies seven major activities that occur just to establish the target cost for a potential product or service. These activities are representative of the uncertainties that firms face as they consider introducing a new product or service. Another eight major activities (see Exhibit 11.4) occur as the firm works to alter the product design, including its components, to attain the target cost. Target costing is a reiterative process that involves constant refinement of efforts. Every iteration brings the firm closer to meeting the target cost or reaching a decision to abandon the product or service.

EXHIBIT 11.2 New Product Target Costing
Source: Adapted from Gary Cokins, “Integrating Target Costing and ABC,” Journal of Cost Management (July/August 2002), p. 14. Copyright Gary Cokins. Used with permission of the author.

EXHIBIT 11.3 Activities to Establish Target Costs
Source: Shahid Ansari, Jan Bell, and Thomas Klammer, “Target Costing,” in the modular series Management Accounting: A Strategic Focus (Ansari, Bell, Klammer; Lulu.com).
A major benefit participating firms gain from their target costing efforts is enhanced process understanding and information that is relevant for many ongoing organizational decisions. Learning to be a team player and becoming more tolerant of cost ambiguity are essential for target costing. Neither of these behavioral changes is easy.
Target costing is a management technique for determining customer requirements (price, quality, functionality, and time) and using this information to drive product design changes and changes in the upstream supply chain to achieve these requirements. Management effort focuses on three key processes: determining the market (customer) driven price; product‐level costing (driving cost reductions within the firm); and component‐level target costing (extending pressure to meet market requirements to upstream supplier trading partners). Supply chain costing provides the cost information needed to support target costing. As activity and process costs are established across trading partners, management can identify where the greatest opportunities exist to achieve customer requirements.
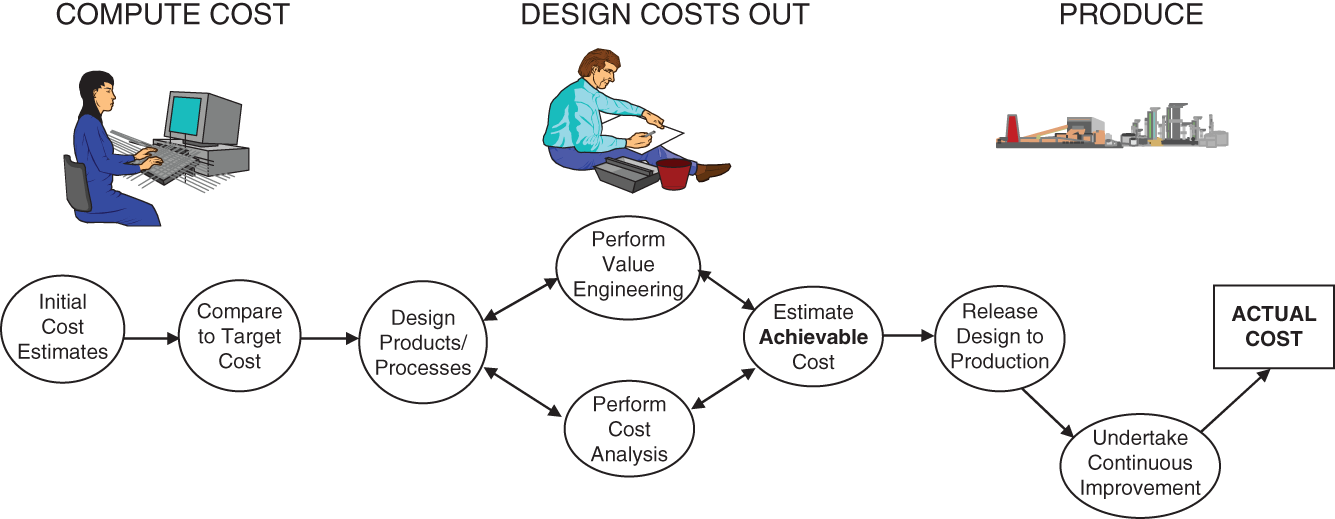
EXHIBIT 11.4 Activities for Attaining Target Costs
Source: Shahid Ansari, Jan Bell, and Thomas Klammer, “Target Costing,” in the modular series Management Accounting: A Strategic Focus (Ansari, Bell, Klammer; Lulu.com).
Target Costing Variations
Target costing requires a long‐term commitment from the organization, significant cost estimation skill, and typically major behavioral and cultural changes within the organization and the supply chain. Many firms are performing pieces of the target costing process but few have implemented a comprehensive target costing process. Other organizations are applying techniques that parallel target costing. Managers establish a target unit cost and use the target to drive cost reductions within their firms and suppliers. The key differences between their approaches and a formalized target costing approach are found in their analysis; not formally establishing a target costing program and not strictly adhering to a cardinal rule of target costing that the target's maximum allowable cost can never be exceeded. Target costing also requires a supportive cost management system. Most Western companies do not have a cost system integrated with product design and supportive of target costing.1
Exhibit 11.5 shows that these firms initiate their efforts in a manner similar to formal target costing programs (see Exhibit 11.3). Senior management establish a target cost by identifying what they believe is the price a new product needs to achieve. Much of this information originates from the marketing staff or represents direct input from key customers. The firm's retailers, distributors, and dealers provide information about actions being taken by competitors and identify where sales have been lost due to not meeting customer requirements in different market segments. Customer requirements and the research and design staff play a critical role in determining what future marketplace requirements would be for new products or models. Sustainability, labor constraints/higher productivity, capability to incorporate new technology, and fuel prices are among the factors driving market requirements. Similar to target costing, managers develop the target cost by subtracting their profit objective (often stated as a contribution margin toward profit and fixed costs) from the target price.
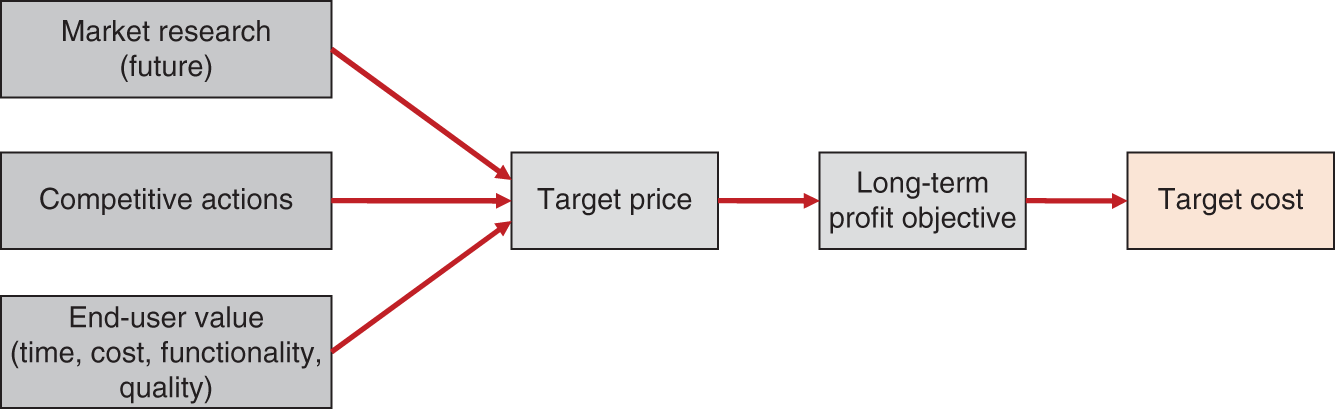
EXHIBIT 11.5 Approach Used for Determining Target Cost
Firms in the aviation industry have incorporated techniques similar to target costing within performance‐based logistics (PBL). The Department of Defense initiated PBL in an effort to increase performance levels while decreasing costs. PBL incorporates several techniques embedded in target costing. The end user (military services) defines their requirements, which reflect stretch targets in the performance levels and lower total operating costs. There are two key differences in this approach. First, a target cost is attached to a performance outcome and not necessarily to a product, and second, suppliers are selected by the customer based on their capability to meet the requirements and achieve the target cost. However, achieving the target cost is a must.
The steps taken within the firms using a target costing variation generally match those included in the product‐level costing process (see Exhibit 11.6). Multi‐functional teams examine the modules or assemblies comprising the end product. Target costs are established based on previous manufacturing or sourcing experience with the items. The component target cost reflects their best estimate of what cost reductions could be obtained while comparing existing product features with customer requirements. Gaps frequently occur between the overall product target cost and the sum of the component target costs. The team has the responsibility of determining how best to close the gap. In many instances, they use a value engineering approach to achieve cost reductions by improving productivity through fewer process steps, eliminating waste, reducing complexity (fewer components), using less material or less expensive alternatives, employing new technology or equipment, shifting production to an upstream supplier capable of producing at a lower cost, or outsourcing functions to a third‐party provider. Trade‐offs frequently occur between assemblies. Costs sometimes need to increase in some assemblies to meet customer requirements or to achieve a cost reduction in another module within the end product. The approach and documentation used to support this process is identical to that used for kaizen costing, the major difference being that they are attempting to achieve the target cost for a new product rather than an existing product.
Firms frequently turn to their upstream supplier trading partners to achieve the target costs established by senior management. The cost targets are generally aggressive and many of the opportunities to reduce cost have already been achieved through previous cost reduction efforts. The process used to work with their trading partners closely follows the component‐level target cost process.
EXHIBIT 11.6 Product‐Level Costing Approach
During the costing effort, firms work with their suppliers in a similar fashion; however, they typically do not perform a two‐way exchange of cost information. They identify targets to be achieved and work with their suppliers to obtain the target costs, usually through a reduction in the component or service price. Suppliers are asked to provide their cost information with varying degrees of success and information utility. Large, dominant suppliers generally refuse to provide cost information or collaborate. Smaller suppliers can be leveraged to participate; however, their cost systems generally cannot provide the cost “intelligence” required to support target costing. New suppliers are generally more willing to provide cost information as a means to increase market share.
During the component‐level target costing process (see Exhibit 11.7), buyers play a lead role in identifying suppliers where a cost or functional improvement can be obtained. Where suppliers are considered too costly and uncooperative, the buying team attempts to develop alternative sources capable of meeting the end user's requirements with their components. In some instances, the buying team works with functional counterparts to develop the source by providing technology, drawings, or engineering support. If cost justified, the firm may purchase and supply equipment to the supplier. In other instances, a cross‐functional team may work with existing suppliers to examine the suppliers' processes and identify cost reduction opportunities as well as a means to meet or exceed customer requirements. Depending on the supplier's sophistication and cost systems, the team uses this information to focus value engineering efforts. Based on the information, either the supplier or customer team initiates several actions, again similar to kaizen costing and documentation. The firm's cross‐functional team compares findings with those obtained from other suppliers. The comparisons sometimes reveal where further cost savings could be obtained, such as by combining supplier purchases or consolidating freight.

EXHIBIT 11.7 Component‐Level Target Costing
The overall target costing process is usually tracked at the division level responsible for the end product. Cost reductions are documented and forwarded to the controller for verification. Senior management is periodically updated on the progress and actions necessary to achieve the target cost.
Life‐Cycle Costing
The importance of managing the cost of a service or process over its life is rapidly gaining acceptance as firms deal with a rapidly changing environment. The “low‐bid supplier wins” mentality of the mass‐production era—and in government contracts—is widely recognized as no longer being appropriate. Leading decision makers, especially in firms with a “cost” mentality, recognize that considering all costs and revenues, a concept known as life‐cycle costing, is essential when making investment or purchase decisions that will influence future costs. Life‐cycle costs include acquisition, operating, and abandonment costs.
For the customer, life‐cycle costs include all outlays related to a product or service from its inception to its abandonment. When a firm buys a truck, the acquisition costs include the purchase price, taxes, and title fees. Operating costs include fuel, insurance, maintenance, and repairs. Abandonment costs include resale inflows less costs of disposal such as title transfer. Considering these costs in advance provides a far different picture of the overall cost of owning a truck than just focusing on the acquisition cost. A life‐cycle cost analysis can help the customer compare alternatives when making purchase decisions. While these benefits are obvious, the life‐cycle approach is often not used when making purchase decisions.
As a producer or service provider, life‐cycle costs include the cash inflows and outflows associated with all activities that occur from the product or service's inception to its abandonment. Lifetime sales must exceed lifetime cost or it is certainly not worthwhile to provide the product or service. Assume a new service is going to be provided. There are one‐time costs to design and promote the service and buy equipment. Then there are recurring costs associated with selling and supporting the service, as well as recurring revenues generated by service sales. Finally, there are abandonment costs related to disposal of equipment, termination of contracts, and so forth. Typically, the cost of operating and maintaining a resource or process far exceeds all other costs. The cost of operating equipment may reach 2 to 20 times its initial cost. More importantly, a large percentage of lifetime costs are committed prior to the decision to provide the product or service. There is a clear linkage to the earlier target costing discussion.
Life‐cycle costing is commonly associated with engineering and developing cost estimates for large projects such as buildings, defense programs, highways, and so forth. Public agencies increasingly use this analysis tool to assist in making construction, rehabilitation, and maintenance decisions. Several states have documents that detail how to do life‐cycle costing. Completing a life‐cycle cost analysis is a combination of art and science. Developing and using a systematic analysis process throughout an organization helps assure that appropriate elements are properly and consistently considered. Exhibit 11.8 provides one example of the types of steps that can be useful in doing a life‐cycle cost analysis.
The cost segment on capital investment analysis that follows also includes a list of steps associated with the capital budgeting process. When reviewing the steps for capital budgeting in Exhibit 11.9, consider how similar many of the suggested steps are to those for life‐cycle costing listed in Exhibit 11.8. Essentially, life‐cycle costing and capital investment analysis are similar approaches for evaluating strategic supply chain costs—particularly when cash flows are discounted.
EXHIBIT 11.8 Key Steps in a Life‐Cycle Costing Analysis
Source: Sieglinde Fuller and Stephen Peterson, NIST Handbook 135, Life‐Cycle Costing Manual for the Federal Energy Management Program (U.S. Government Printing Office, 1996).
| Define problem and state objective |
| Identify feasible alternatives |
| Establish common assumptions and parameters |
| Estimate costs and times of occurrence for each alternative |
| Discount future costs to present value |
| Compute and compare LCC for each alternative |
| Compute supplementary measures if required for project prioritization |
| Assess uncertainty of input data |
| Take into account effects for which dollar costs or benefits cannot be estimated |
| Advise on the decision |
Managers note that their firms have made investments to support supply chain processes without information related to either their capital investment decision processes or any life‐cycle costing information. Supply chain managers certainly understand the importance of these concepts; however, they persistently emphasize the operational and short‐term cost analysis of supply chain information. Researchers of capital investment practices have consistently encountered considerable reluctance on the part of firms to share information on the specifics of these practices, and many firms have even found it difficult to find benchmarking partners.2
CAPITAL INVESTMENT ANALYSIS
Capital investment analysis, or capital budgeting, is the process organizations use to evaluate and select long‐term investments in tangible or intangible assets. It helps answer questions about whether the return on investment (ROI) from a proposed purchase of an asset, such as equipment or a system, is justified. A good capital investment analysis process helps supply chain managers analyze and plan when and how to add long‐term capacity costs in a manner consistent with the firm's long‐term strategy. Most organizations remain reluctant to discuss the details of their capital decision models, but managers are very much aware that it is easier to manage capital costs before making the investment. Managers understand the importance of capital investment decisions and that these decisions influence supply chain costs for a substantial period.
The Steps
Exhibit 11.9 shows eight major steps that are part of a common approach to the capital investment analysis process. Research results show it is not uncommon for firms to make long‐term investments without linking these investments to the firm's strategy—the first step in the process. While the need for such a linkage should seem obvious, an analysis of the literature and discussions with many business executives demonstrate that the link is often assumed rather than systematically documented.
Capital budgeting analysis typically involves comparing a baseline with an alternative scenario that includes investing in an asset for which the expected benefits will continue well beyond a year's duration. Some refer to the associated investment justification analysis as “same as, except for” or comparing the as‐is state with the to‐be state. Care should be taken to do an adequate search for feasible alternatives. Too often, managers select the first proposal with an acceptable return and overlook better alternatives because they were not identified.
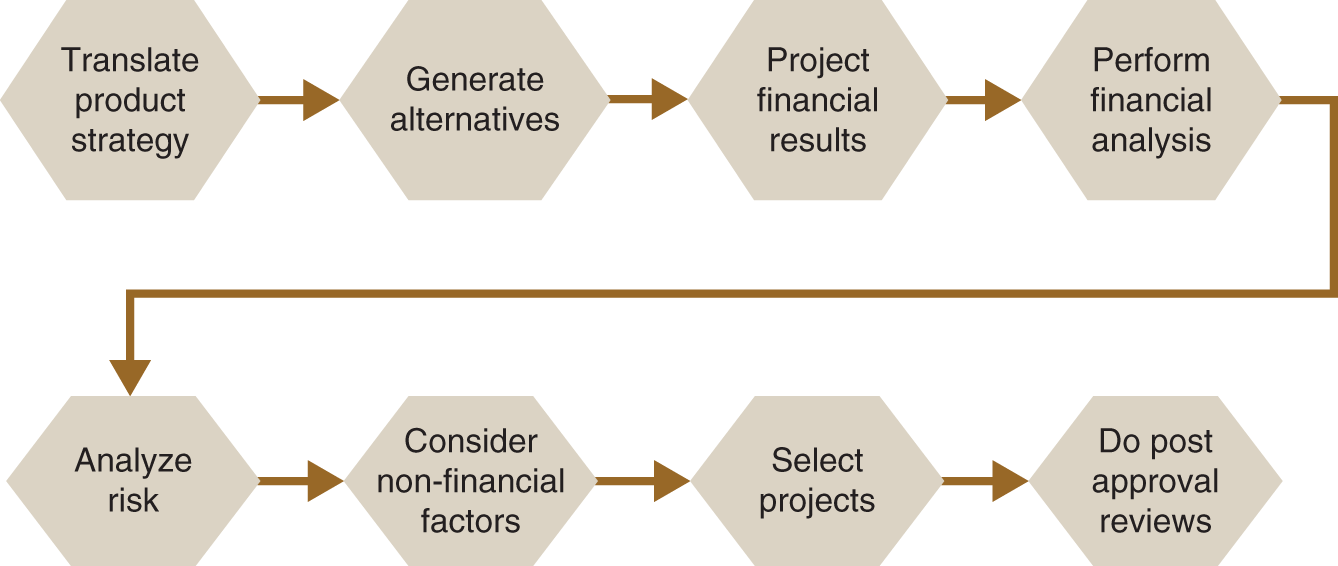
EXHIBIT 11.9 Steps in the Capital Budgeting Process
Source: Adapted from Shahid Ansari, Jan Bell, and Thomas Klammer, “Customer Profitability Analysis,” in the modular series Management Accounting: A Strategic Focus (Ansari, Bell, Klammer; Lulu.com).
The “project financial results” step is where acquisition, operating, and terminal (or abandonment) costs over the life of the project are estimated. In developing these estimates, firms rely on forecast projections, such as demand volume units, and the associated incremental impact on revenues and resource expenses. Experience shows that it is easy to overlook certain types of cash inflows and outflows. It is useful to assign project champions to develop illustrative lists of cash flows that might occur.
Performing financial analysis encompasses the use of discounting techniques such as net present value and internal rate of return. These tools make it feasible to compare the value of estimated cash inflows and outflows that occur at different times. These discounted cash flow equations rely on the forecasts of demand and on unit‐level consumption rates of the workload. There are also other analysis tools ranging from simple payback models to exotic estimation tools, such as those based on chaos theory, that are used in different situations. Historically, the tendency has been to focus too extensively on the third and fourth steps of the capital budgeting process. This narrow focus can lead to extensive analysis of projects that are “easy” to make cash flow estimates for, such as buying trucks or forklifts. Critical one‐time strategic decisions, such as outsourcing part of a supply chain or decisions with hard to estimate benefits, such as investing in “green” technology, are too often made with limited analysis.
Note that a review of risk factors and consideration of nonfinancial factors, such as the impact of quality and time, are essential before making project investment decisions. It is easy to get caught up in the financial analysis and overlook these critical elements of the capital process while making investment decisions. The final step in the capital budgeting cycle is to review prior decisions and learn why estimation mistakes occurred in order to help improve future analysis efforts. Feedback is essential for better future supply chain decision making.
Capital investment decisions are important because they commit the organization to certain types of cost structures and specific supply chain processes. Almost every large firm has detailed procedures in place for making capital investment decisions. Yet research and interviews reveal that few firms believe that their capital investment decision process is world class. Many important strategic decisions are still made based on top management's “gut feeling.” Most firms are reluctant to benchmark in the capital investment analysis area. This unwillingness to share information impedes process improvement. This is a major problem that needs to be addressed in many parts of the supply chain costing journey.
Make versus Buy—General Outsourcing Decisions
The outsourcing decision is a strategic, long‐term capital investment decision. Before outsourcing there needs to be a careful business case developed to justify which services are going to be performed by third parties. This type of decision should only be made using the logic and math of capital budgeting. Cost and revenue differences that measure “same‐as, except for” incremental changes need to be identified. Activity‐based costing techniques should be applied because the primary variable is the work activities that the third‐party contractor performs to replace the current in‐house work activities. Since cost is not the only variable that shifts, a service‐level agreement with the contactor should be a standard practice.
Unfortunately, the make‐or‐buy decision is often still treated as a short‐term relevant cost decision, where the focus of attention is on how variable costs change. The traditional cost accounting treatment for make or buy involved a comparison of the buying price for the product or service with the cost savings that resulted from making this purchase—the variable costs that went away. The long‐term impact on costs is not given much attention. The need to consider other factors such as quality or timeliness is noted, but typically given little attention in the quantitative case used for the decision.
There are many reasons a firm may consider outsourcing or insourcing. One reason often cited is, of course, cost savings. The decision may also allow the firm to restructure where it focuses its spending or even its fundamental strategic focus. It may provide quality improvements for customers, take advantage of the knowledge and expertise of the service provider, or make better use of capacity or management skills. An outsourcing decision can place a focus on the core competencies of the organization versus the third party, such as cafeteria services or uniform cleaning, where the third‐party contractor is more skilled and/or may enjoy economies of scale due to serving multiple customers, thus providing greater efficiency and effectiveness.
A decision to fundamentally change an organization by outsourcing major functions or processes entails considerable risk. It is politically charged, particularly when work is sent overseas or to organizations that pay lower wages or provide fewer benefits. Promised benefits often fail to materialize, perhaps because the decision did not properly consider all costs. An organization can lose control of quality and productivity. There is a loss of knowledge and expertise within the organization that may make it difficult to rectify a poor outsourcing choice. The firm may be also subject to more security and fraud risks. Outsourcing decisions are strategic long‐term decisions that should consider life time costs and be analyzed using appropriate capital investment tools.
CAPACITY ANALYSIS
Capacity is a measure of the resources available as a supply to match the sales demand quantity of goods or services that a firm expects to sell. Knowing whether adequate or excess capacity already exists or will exist after selecting alternatives (based on life‐cycle or capital investment analysis) is an important part of supply chain costing. There are many potential uses for capacity analysis at the operating, tactical, and strategic level.
Capacity is often thought of primarily in the context of the existing operating structure of the organization. While every firm has multiple measures of capacity, these measures are seldom integrated. The type of general capacity analysis model described shortly does not yet appear to be familiar to most supply chain professionals, even though its use has been instrumental in improving how firms use existing capacity and reducing the need for investments in additional capacity.
The capacity model introduced below (the CAM‐I model)3 is probably the most comprehensive of the general models related to capacity described by McNair4 in her comprehensive review of capacity models. The CAM‐I model helps communicate the overall state of capacity. Traditional capacity measures typically focus on only planned or actual capacity and make it easy to overlook the extensive amount of idle and nonproductive capacity that is present.
Capacity represents a physical measure of product or service capability that is based on a combination of rate and time (C = R × T). It is a measure of what can be done, not how much is done. Time is the constant in this measure.
Total or rated capacity is the maximum an asset or process can produce with no constraints. Assume an order call center can handle 1,000 calls per hour. Its total capacity is 24,000 calls a day (24 × 1,000), 168,000 calls a week (24,000 × 7), and so forth. Total capacity can then be separated into the portions that are productive, nonproductive, and idle. A brief description of each follows.
- Productive capacity is the use of capacity to make good (i.e., error‐free and meeting specifications) products or deliver good services. A forklift loading trucks for 1,500 hours in a year would be a measure of the productive use of the forklift.
- Nonproductive capacity is capacity that is used but does not result in making a good product or delivering a good service for the customer. Doing setups, performing maintenance, incurring waste, and having resources on standby are elements of nonproductive capacity. These activities may be essential, but they are still unproductive in terms of the customer. If a forklift is unable to load trucks because there is no driver or materials are unavailable, it is unproductive. If a load is dropped or the forklift requires an oil change, it is unproductive.
- Idle capacity is capacity that is available but unused because of policy decisions or the market. Some capacity is idle because it is off‐limits, some may be unusable in the existing market, and other amounts may be useable but are not being used for various business reasons. Some idle capacity is referred to as “buffer capacity” to anticipate surges in demand that can be met without cycle time delivery delays. If management decides to operate only two shifts, the forklift will be idle part of each day. If a competitor reduces demand for a firm's product, the forklift may be idle because of fewer shipments.
Exhibit 11.10 displays these three capacity portions in the second column, titled “Summary Model.” The third column decomposes the second column, and the fourth column further decomposes the model.

EXHIBIT 11.10 CAM‐I Capacity Model
Source: Thomas Klammer and the CAM‐I Capacity Interest Group, A Manager's Guide to Evaluating and Optimizing Capacity Productivity (Irwin Professional Publishing, @CAM‐I,1966), p. 17.
Capacity is an expense. It only resides within a firm's resources (e.g., employees and assets); it does not reside in the work activities. Activities are capabilities. Using capacity more efficiently can reduce expenses and help firms avoid investing in unneeded capacity. Common adages are “more with the same” and “the same with less.” One of the alternatives that should be considered when making strategic supply chain decisions is redesigning the supply chain processes by working with suppliers and customers to reduce nonproductive and idle capacity.
A careful analysis of the states of capacity that exist for processes and products provides a wealth of information to decision makers and can have major implications for the cost of supply chain processes. A major firm in the semiconductor industry carefully analyzed their nonproductive costs and worked to minimize those costs. As a result, they were able to improve their ability to produce productively enough to avoid investing in additional plants that would have cost the firm over six billion dollars.
Research shows that traditional capacity measures often focus on only a portion of available capacity. As a result, idle and nonproductive capacity are often taken as givens and are not carefully managed. Becoming aware of this blind spot has resulted in operating changes in organizations. For example, many firms now do preventive maintenance on assets, such as delivery vehicles, outside normal working hours. This frees up additional capacity, reducing the need for extra equipment, such as trucks, or allows the firm to accept a larger volume of delivery orders.
Capacity analysis is essential for making visible the state of existing capacity, particularly idle and nonproductive capacity. This information is useful in helping avoid making unneeded investments. An analysis of prospective capacity is also useful for evaluating the scope of potential capital projects.
NOTES
- 1. R. Cooper and R. Slagmulder, Target Costing and Value Engineering (Portland, OR: Productivity Press, 1997).
- 2. Based on insight from Thomas Klammer, one of this book's authors, who has a stream of research related to the capital budgeting practices industry uses and has worked extensively with other researchers and many individuals in industry involved with the capital decision process.
- 3. The model discussed in this section is based on work done by CAM‐I and originally published in Thomas Klammer, Capacity Measurement and Improvement, A Manager's Guide to Evaluating and Optimizing Capacity Productivity (Chicago, IL: Irwin Professional Publishing, 1996). A comprehensive summary of part of the model itself is found in Shahid Ansari, Jan Bell, and Thomas Klammer, “Measuring and Managing Capacity,” in the modular series Management Accounting: A Strategic Focus (Ansari, Bell, Klammer; Lulu.com).
- 4. C.J. McNair, Implementing Capacity Cost Management Systems (Montvale, NJ: Institute of Management Accountants, 2000).