
6
Corporate Social Responsibility Reporting: Background, Evolution and Sustainability Promoter
Corporate social responsibility has come a long way from the first forms of unregulated, voluntary social actions of businesses to the now standardized, regulated mandatory and voluntary activity within the CSR field. As the concept became more and more complex, the need for CSR reporting became evident and standards for CSR reporting emerged. The Global Reporting Initiative (GRI) materialized as the main standard for CSR reporting. This chapter is composed of a short historical evolution of the CSR concept and associated reporting opportunities, a quantitative analysis of policy regarding CSR around the world, and a quantitative analysis of the reporting activity within five industrial sectors: energy, chemicals, metal products, mining, and automotive.
6.1. Introduction
The problem of CSR has been studied by many researchers over the last few decades. The concept has had many transformations over time and, as the world became more connected and access to information became easier, the increasing popularity of CSR forced companies to approach it more proactively, placing more and more importance on stakeholder opinion, to the detriment of shareholders.
The new paradigm of CSR activity has recently shifted from large companies, the most visible in the eyes of stakeholders, to medium and small companies, as digitalization now offers quick access to information on every aspect of a company’s activity.
Within this environment CSR became very important, not only for large companies, but also for medium and small ones, as shareholders could decide to distance themselves from companies not demonstrating good social conduct or, who appear to be socially irresponsible.
Once shareholder interest in CSR activity began to increase, companies understood its importance and the need for unified reporting standards became necessary. This necessity led to the creation of Global Reporting Initiative (GRI) standards and ISO 26000, with the role of uniformization in CSR reporting.
This chapter presents a short review of the main advances in the CSR domain and its most prestigious contributors; a short presentation of CSR standardization options and policy measures; a quantitative analyses of reporting policies around the world; and an in-depth quantitative analysis of reporting to GRI by region and by business size between 2007 and 2017 for five industrial sectors, namely energy, chemicals, metal products, mining, and automotive.
6.2. A brief history of CSR development and conceptualization
The concept of CSR has many dimensions and must be explored piece by piece, with an examination of each of the words the term comprises. According to Carroll and Brown [CAR 18] those words have the following meanings:
Corporate – corporate forms of business organizations which evolved to include all businesses: large, medium or small. The focus of today’s society is on large organizations due to their visibility, but small enterprises are inside the CSR domain too.
Social – human society or the life and welfare of a community. The applicability of this notion may imply a community, a state, a nation or the world. Many times, society is considered to be a collection of stakeholders possibly influenced by a company action. We must acknowledge that today’s society includes other life forms and the natural environment.
Responsibility – accountability of a business for what is subject to its power, control, or management. It involves an obligation and the possibility of being held accountable by society.
6.2.1. Timeline of CSR development
Over time CSR “benefited” from various definitions. For many, Howard Bowen is considered to be the “father of CSR”, with his extraordinary book The Social Responsibilities of the Businessman [BOW 53]. According to Bowen, CSR can be defined as: “the obligations of businessmen to pursue those policies, to make those decisions, or to follow those lines of action which are desirable in terms of the objectives and values of our society” [BOW 53].
Ackerman and Bauer stated that social responsibility has too much to do with motivation, rather than performance, and argued that social responsiveness is more adequate [ACK 76]. Based on this idea was the development of CSR1, as the general understanding of CSR, and CSR2, which was categorized as corporate social “responsiveness”, focusing on the literal act of responding [FRE 78].
After these first advances in the field of CSR, the domain broadened further with the addition of new concepts to the basics of CSR. Starting from the performance of CSR, Carroll proposed a corporate social performance (CSP) model, composed of three dimensions [CAR 79]:
- – a basic definition of CSR;
- – a statement for the firm’s philosophy;
- – indication of social issues arenas (consumers, environment, discrimination, etc.).
This model has been further extended by Wartick and Cochran [WAR 58] who proposed that the three dimensions should be viewed as principles, processes and policies. Subsequently reformulated by Wood, who rethought the whole construction and proposed that CSP is a business organization’s configuration of principles of social responsibility, processes of social responsiveness and policies, programs and other observable outcomes, as they related to the firm’s societal relationships [WOO 91].
6.2.2. Opponents and supporters of CSR
From the start, businesses and the academic community have been divided between supporters and opponents. In the same decade as Bowen we find, as an opponent, Theodore Levitt, whose article, “The dangers of social responsibility” [LEV 58], promoted the idea that a business’s goal is long-run profit maximization and that government should provide general welfare.
Milton Friedman, the renowned economist, was the toughest opponent of CSR arguing that businesses must not be concerned with social matters which should be handled by the free market. Friedman argued that management must engage in one goal: the maximization of profits for its owners or shareholders. Even though Friedman was strongly opposed, he acknowledged that a business must comply with laws and ethics, often found in CSR definitions [FRI 70].
Another aspect that attracted attention was the fact that businesses should be armed to tackle social activities. This comes from the fact that management is primarily educated in financial matters and do not have the social skills to engage in CSR [DAV 73]. Another opponent stated that CRS weakens the scope of businesses by steering them away from their aim, taking the company into uncharted waters, far beyond its defined scope [HAY 69]. Another argument is that the business already has enough power so why risk company capital to gain more, along the lines of social power [DAV 73]? Finally, engagement in CSR activities will make the business less competitive [CAR 10].
The main argument for CSR is that it is in a business’s own interest to be socially responsible, in order to maintain a favorable business position in the long term. Some argued that government intervention could be reduced until standardized business policies fulfil society’s expectations [CAR 10]. Davis identifies two more aspects: businesses have the resources (management, functional expertise and capital) and should be allowed to try because many have tried and failed to solve social problems [DAV 73]. Another view is that being proactive is better than being reactive, so anticipating, planning and initiating is less costly than simply reacting to social problems as they appear [CAR 09].
Another view is that the public strongly supports the CSR concept so businesses have no other option but to engage with it. Nowadays, the public steers businesses away from their inherent scope of profit maximization to a broader specter of obligations to society and stakeholders, even if making things better for them requires sacrificing some profit [BER 00].
The debate between supporters and opponents of CSR has been around since early writing on the concept. Each side presents the truth about CSR, as the concept is considered to sway between the two views. Here it can be argued that CSR is a tool for creating a better image for the business, therefore positioning it in the realm of public relations. Another could say that a business simply wants to give back to society, therefore placing it within the philanthropic arena. No matter what driver leads a company to engage in CSR, the result is a win-win for both business and society.
6.2.3. Carroll’s pyramid of corporate social responsibility
After extensive research and debate in the field of CSR, Carroll presented a graphical view on the domain as the “pyramid of corporate social responsibility” [CAR 91] presented in Figure 6.1. As can be seen, Carroll depicted CSR as a pyramid with four categories. This form has been adopted by many researchers [WAR 85, WOO 91, SWA 95, 99, BUR 99, CLA 95, IBR 93, 95, MAL 93, ONE 89, PIN 96, SMI 01, CIU 05, MAT 13a, PAN 15, ENE 17, AND 18, EHS 18, BRE 18, ZAM 20] therefore confirming the relevance of the framework and the four areas as the main paradigm of the CSR concept.
Carroll provided a hierarchy of corporate responsibilities composed of the economic, legal, ethical and philanthropic aspects of a business. At the base of the pyramid are economic responsibilities, the main reason for business existence being the creation of a sufficient amount of profit in order to satisfy the needs of the shareholders, to create jobs for employees and deliver goods and services to customers. Legal responsibilities are the obligation to comply with business rules and regulations to protect society from corporations’ misdeeds and moral misjudgments. Ethical responsibility is the first stage of the pyramid that is not required, but it is expected. In general, businesses should care about their stakeholders and be proactive in identifying and excluding from their portfolio the activities and actions that might be detrimental to society.
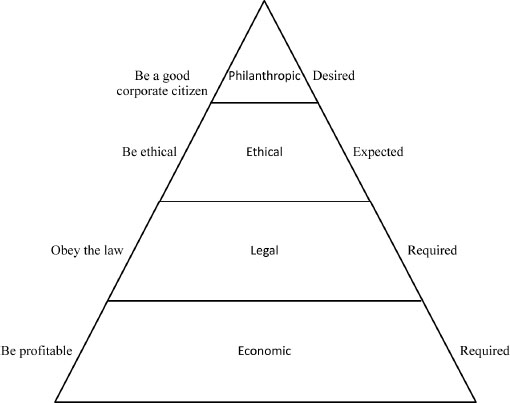
Figure 6.1. Pyramid of corporate social responsibility
(source: [CAR 91])
Philanthropic responsibilities are one of the first forms of CSR and they take the form of donations and activities directed at improving conditions for employees and the local or global community.
Carroll’s pyramid model has a few issues [SCH 03]:
- – the use of a pyramid to depict the relationships between the four components of the model;
- – the role of philanthropy as a separate component;
- – the incomplete theoretical development of the economic, legal and ethical domains.
The pyramid framework may be confusing and inappropriate in some cases. It induces the idea of hierarchy among the CSR components and the conclusion that philanthropic activities – from the top of the pyramid – are the most important, and that the economic responsibilities – from the base – are less important. This could lead to a misunderstanding of the relationship between the CSR domains. The pyramid cannot grasp the interweaving nature of CSR components.
The introduction of the philanthropic component into the pyramid caused some confusion and some scientists considered the addition unnecessary. Even Carroll acknowledged that it is inaccurate to call these actions responsibilities [CAR 79]. So, philanthropy cannot be called a social responsibility of businesses.
6.2.4. The three-domain model of CSR
The three-domain model of CSR has been developed by Schwartz and Carroll [SCH 03] and consists of three areas of responsibility: economic, legal and ethical. Unlike Carroll’s pyramid, philanthropic responsibilities are excluded from the model, as these can be incorporated into the ethical and economic components. The model is depicted using a Venn diagram – presented in Figure 6.2 – in order to avoid confusion regarding hierarchy by suggesting that all three components have equal importance and, more importantly, to identify overlapping areas between two or all three components of CSR.
The economic component includes those activities that have a direct or indirect economic impact on the business, and can be evaluated against two criteria:
- – maximization of profits;
- – maximization of share value.
The legal component of CSR consists of the response of a business to legal requirements of government and local jurisdictions. The legality can be classified as:
- – compliance;
- - passive,
- - restrictive,
- - opportunistic;
- – avoidance of civil litigation;
- – anticipation of the law.
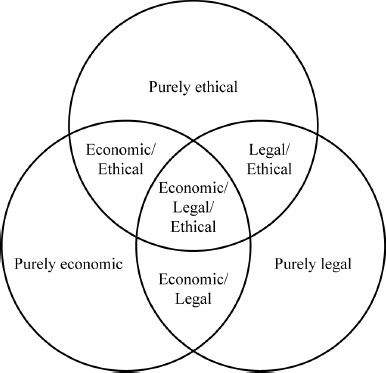
Figure 6.2. The three-domain model of CSR
(source: [SCH 03])
The ethical component represents the ethical responsibilities of a business. The model includes only three general ethical standards that a business is expected to comply with, according to the general population and stakeholders:
- – conventional;
- – consequentialist;
- – deontological.
An important addition of the three-domain model is the overlapping. Instead of categorizing a corporate action in one of the three components, now, it can be classified under two or all three components. A CSR activity can now be classified in one of the three components: purely economic, purely legal or purely ethical, or one of the four overlapping components: economic/ethical, economic/legal, legal/ethical and economic/legal/ethical.
6.3. Corporate social reporting – standardization and policy
Once CSR became so widely accepted, the need for CSR reporting regulations and policy grew. The shift from maximizing profits to increase long-term market value created the need to provide stakeholders with information, not only about financial aspects but also about the non-financial details. This led to the appearance of new concepts such as non-financial reporting, sustainable reporting and integrated reporting, all of which contain aspects from the CSR field.
6.3.1. Corporate social reporting standards
At the international level, the need for standardization led to the appearance of many standards, guidelines and reporting frameworks than can be used to prepare a non-financial or integrated report [PAT 19]:
- – Global Reporting Initiative (GRI);
- – Corporate Social Responsibility Report;
- – Integrated report (IIRC);
- – Communication on Progress (Global Compact);
- – International Integrated Reporting Framework;
- – Guidance on Corporate Responsibility Indicators in Annual Reports;
- – KPIs for ESG;
- – Model Guidance on Reporting ESG Information for Investors;
- – Reporting framework in line with the UN Guiding Principles on Business and Human Rights;
- – Carbon Disclosure Project;
- – Greenhouse Gas Protocol Corporate Standard;
- – Principles for Responsible Investment;
- – OECD guidelines for multinational enterprises;
- – PN-ISO 26000: 2012 regarding social responsibility;
- – Account Ability 1000 Standard (AA1000);
- – Eco-Management and Audit Scheme (EMAS);
- – Tripartite declaration of principles for multinational enterprises and social policy (ILO) and others.
There is a strong relationship between GRI Guidelines and ISO 26000 as they provide guidelines showing the links between the two standards. This has been done in order to help companies make use of ISO 26000 to integrate social responsibility principles and to use GRI guidelines to prepare the report for businesses performance assessment. If the company decides to prepare a more advanced report, they can use the ISO 26000 guidelines.
Businesses face a big issue with CSR reporting, that is, the materiality of events on information. The potential effect of events needs complex analysis to establish how they may impact companies, in terms of opportunities and risks related to value creation. The reports are aimed at different users and might be too complex for some as they contain information pertinent to only a small group of people. This type of information could be made available as a supplement to the main report, in line with the GRI guidelines.
6.3.2. Corporate social reporting policy
Policies refer to national government initiatives such as market regulations, policies, and legislation, in which companies disclose or report on non-financial factors. Governments focus on CSR as businesses can help meet policy objectives voluntarily, helping governments to achieve policy goals in the field of sustainable development, environmental protection, and human development; affording it the role of redistributor of corporate resources to society. CSR policies can be used as a motive to enforce hard law regulations that are not desirable, creating new forms of state intervention. Governments try to influence development of the CSR concept by promoting softer non-binding initiatives. Further, the soft approach of CSR seems to follow a mutation of public governance from hierarchical regulations towards more network-like partnering modes of self- and co-regulation [KOO 03, PIE 00, RHO 97, STE 10, VOL 11, MAT 13b, PAN 14, AND 14, DEI 16]. The domain of CSR restructures the way management works and the relationships between businesses, governments and civil society. From the point of view of policy makers (though not only) CSR leads to shifting involvement of the public and private sectors [MOO 02]. Since CSR is far more than a management approach that could be left to the discretion of managers, governments have a vested interest in co-defining this shifting involvement of the different sectors, rather than being passive objects of change [STE 10].
The range of public policies from CSR is wide-ranging in terms of themes and instruments. The most used types of policies are [STE 10]:
- – informational instruments based on knowledge resources consisting of campaigns, training and websites;
- – economic instruments (carrots) based on the resources of the taxing authority and money, with the role of influencing behavior by using financial incentives and market force such as taxes, subsidies and wards;
- – legal instruments (sticks) promote action by using the state’s legislative, executive and judicial powers through laws, directives and regulations;
- – partnering instruments (ties) build on a co-regulatory network as different actors are interested in working together towards the same objectives;
- – hybrid instruments (adhesives) as many government initiatives on CSR combine two or more other instruments from above.
6.3.3. Carrots and sticks analysis
This analysis was conducted using data from Carrots & Sticks1, a live tracker of all policy regarding sustainable reporting from 86 countries. This was compared with previous Carrots & Sticks reports, from 2006, 2010, 2013 and 2016. Figure 6.3 shows a world map depicting countries that have a policy, those that do not have one and those with no information.
The database currently holds 500 active policy instruments world-wide. Between 2016 and July 2020, 117 new instruments came into force meaning there was an almost 30% increase in active policy instruments. The distribution of these instruments among regions, and the most prolific countries in terms of policy instrument production, can be seen below:
- – Europe with 208: Spain, 18; Italy, 16; France, 13;
- – Asia Pacific with 150: Australia, 17; Japan, 16; China, 15; India, 14;
- – Africa and the Middle East with 60: South Africa, 15; Israel, 7; Nigeria, 6;
- – South America with 55: Brazil, Argentina and Colombia are in South America;
- – North America with 27: the USA, Canada and Mexico are in North America.
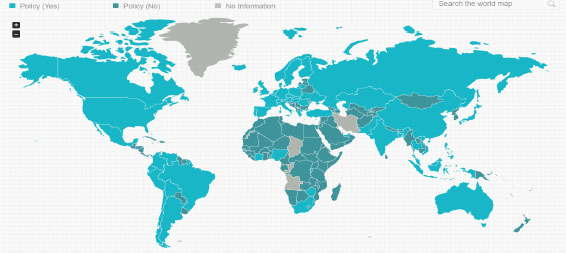
Figure 6.3. Countries with reporting policy 2020. For a color version of this figure, see www.iste.co.uk/machado/sustainable.zip
(source: https://database.globalreporting.org/SDG-12-6/Global-Tracker (accessed on July 4, 2020))
As previously stated, there are two forms of policy compliance: mandatory and voluntary. In Table 6.1, data regarding the evolution of two types of policy is presented:
Table 6.1. Voluntary and mandatory distribution of policy instruments
(source: https://www.carrotsandsticks.net)
| Indicator | 2006 | 2010 | 2013 | 2016 | 2020* | |||||
|---|---|---|---|---|---|---|---|---|---|---|
| Mandatory | 35 | 58% | 94 | 62% | 130 | 72% | 248 | 65% | 282 | 56% |
| Voluntary | 25 | 42% | 57 | 38% | 50 | 28% | 135 | 35% | 218 | 44% |
| Total | 60 | 151 | 180 | 383 | 500 | |||||
| Countries and Regions | 19 | 32 | 44 | 71 | 86 | |||||
*data available until July 4, 2020
The evolution shows an upward trend in the number of policies, of both types; however up until 2013 we observed an increasing share of mandatory policy, reaching 72%. Subsequently, more parity began to appear between the two types, with the existing gap now at 8%.
Analysis of the policy issuers revealed that governments issued the most sustainability reporting instruments, with a total of 314, 64% of the overall total and an increase of 40% in number of instruments compared to 2016 when the number was 223. Financial regulators were in second place with 98 instruments, 20% of the overall total and an increase of 42% in number of instruments compared to 2016 when there were 69 instruments. Stock markets followed with 62 instruments, 12% of the overall total and an increase of 41% compared to 2016 when the number was 44. Industry bodies and business associations issued 20 instruments, 4% of the overall total and an increase of 33% compared to 2016 when there were 15 instruments. Finally, NGOs (Non-Governmental Organizations) with six instruments, 1% of the overall total, the same number as 2016.
The analysis of the policies by type of adopted instrument revealed that Public Law and Regulations was the most used with 212 reporting instruments, 42% of the overall total and an increase of 25% compared to 170 instruments in 2016. For the following categories, the 2016 report differs in structure and therefore a dynamic analysis cannot be conducted. Codes, Guidance and Questionnaires were the second most used with 107 reporting instruments, 21% of the overall total followed by Guidelines and Standards for Non-financial Reporting with 66 reporting instruments, 13% of the total, Self-regulation with 32 reporting instruments, 6% of the total, Index Questionnaires with 5 reporting instruments, 1% of the total and Others (action plan, strategy, program, voluntary initiative) with 78 reporting instruments, 16% of the overall total.
Analysis of the policies by target organization revealed that All Companies were targeted by 209 instruments, 42% of the total and an increase of 35% compared to 155 instruments in 2016. Large Private and Listed Companies were targeted by 241 instruments, 48% of the total and an increase of 48% compared to 163 instruments in 2016. State-owned Enterprises were targeted by 18 instruments, 4% of the total and a decrease of 36% compared to 28 instruments in 2016. Small and medium-sized enterprises (SMEs) were targeted by 7 instruments, 1% of the total and a decrease of 22% compared to the 2016 number of 9 instruments.
The analysis of the policies by the Environmental, Social and Governance (ESG) coverage reveals that many of the policy instruments consist of more than one of the ESG components. Therefore, a share in the total reports by each ESG component is not a reliable method of analysis. When considering these aspects, it must be noted that each instrument may include one, two or all three ESG components. So, 303 instruments included Governance aspects, 282 instruments included Environmental aspects and 268 instruments included Social aspects.
6.4. Analysis of the GRI reporting enterprises between 2007 and 2017
This chapter focuses on large enterprises, multinational enterprises (MNEs) and small and medium-sized enterprises (SMEs) active in five sectors, across six continents and who have reported to GRI between 2007 and 2017. The five sectors under discussion are: energy, chemicals, metal products, mining, and automotive. The six continents refer to Africa, Asia, Europe, Latin America and the Caribbean, Northern America, and Oceania.
GRI has been chosen for this analysis as it is an independent organization based in Amsterdam, The Netherlands. GRI was founded in 1997 in Boston, USA under the Coalition for Environmentally Responsible Economies (CERES) and the Tellus Institute, with the support of the United Nations Environment Programme (UNEP). The first Sustainability Reporting Guidelines (SRG) went public in 1999 and the first full version in 2000. SRG are available as a free public good and are continuously improved and revised. Another important reason for selecting GRI is its Sustainability Disclosure Database (SDD) where researchers are able to see every submitted report.
6.4.1. Analysis of the GRI reporting enterprises from the energy sector between 2007 and 2017
Figure 6.4 shows the evolution of GRI reporting by large enterprises within the energy sector, between 2007 and 2017. Overall, throughout this period of time, the number of large enterprises from all six continents that reported to GRI has varied. The highest numbers came out of Europe, Asia, and Latin America and the Caribbean – in this order – with slight differences in four years in the case of the first two continents. More specifically, the highest numbers of large enterprises that reported to GRI were from Europe between 2007 and 2012, and in 2015. Only between 2013 and 2014 and, 2016 and 2017, respectively, were there more large enterprises from Asia who reported to GRI as compared to the companies from the other five continents.
On the contrary, the smallest numbers of large companies that reported to GRI were from Africa, Oceania, and Northern America. Although there were no large enterprises reporting to GRI from Africa between 2007 and 2009, their number started to increase in 2010 and, as a result, the same value has been reached. Furthermore, its enterprises saw a similar evolution rate to those from Oceania between 2014 and 2017.
The highest numbers of large enterprises that reported to GRI by year, for the 2007–2017 period, were: 114 companies from Asia in 2017; 118 from Asia in 2016; 97 from Europe in 2015; 101 companies from Asia in 2014; 83 from Asia in 2013; 82 companies from Europe in 2012; 64 from Europe in 2011; 46 from Europe in 2010; 33 from Europe in 2009; 32 from Europe in 2008; and 23 companies from the same continent in 2007.
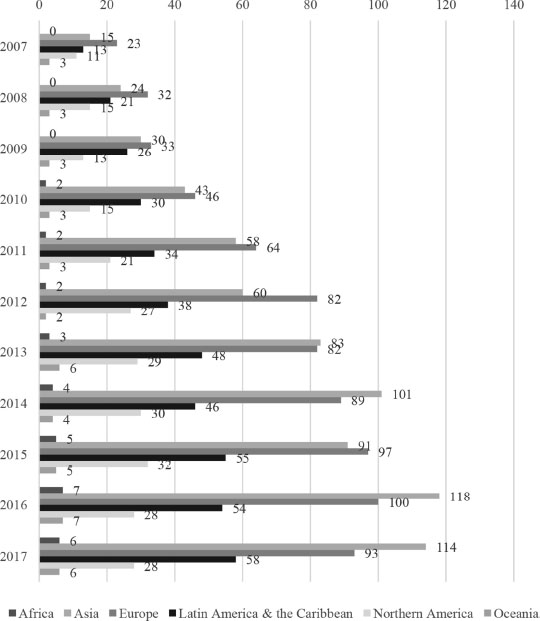
Figure 6.4. GRI reporting evolution of large enterprises from the energy sector by region, 2007–2017
(source: compiled by the authors based on data collected from GRI SDD)
At the opposite end, the lowest numbers of large enterprises that reported to GRI, by year, for the same period were: six companies from Africa and Oceania in 2017; seven from Africa and Oceania in 2016; five from Africa and Oceania in 2015; four from the same continents in 2014; three companies from Africa only in 2013; two from both Africa and Oceania in 2012; two companies from Africa between 2010 and 2011; and none from the same continent between 2007 and 2009.
In terms of the highest increase in the number of large GRI reporting enterprises from the same continent, there were cases such as: Oceania in 2013 as compared to 2012 (200%); followed by the companies from Africa in 2010 in contrast to 2009 (100%); those from Latin America and the Caribbean in 2008 versus 2007 (61.54%); those from Asia in 2008 as opposed to 2007 (60%); the companies from Northern America in 2011 as compared to 2010 (40%); and the companies from Europe in 2010 in contrast to 2009, and, respectively, 2011 versus 2010 (39.39%). These increases occurred in the first half of the analyzed period, with 50% of them in 2008 in contrast to 2007.
With respect to the largest decrease in the number of GRI reporting large enterprises from the same continent, the following cases can be highlighted: the companies from Oceania in 2012 against 2011, and, respectively, 2014 as compared to 2013 (-33.33%); followed by the companies from Africa in 2017 in contrast to 2016 (-14.29%); the companies from Northern America in 2009 versus 2008 (-13.33%); those from Asia in 2015 as opposed to 2014 (-9.9%); those from Europe in 2017 against 2016 (-7%); and the companies from Latin America and the Caribbean in 2014 in contrast to 2013 (-4.17%). These reductions were equally distributed throughout the 11 years and one-third of them are in 2017 versus 2016.
Figure 6.5. shows the evolution of GRI reporting by MNEs within the energy sector, by region, between 2007 and 2017. The highest numbers of MNEs that reported to GRI were from Europe, Northern America, and Asia, with Europe first out of the three across the whole period. There were more MNEs that reported to GRI from Northern America than from Asia between 2007 and 2011, and in 2013, respectively.
By contrast, the smallest numbers of MNEs that reported to GRI were from Africa, Oceania, and Latin America and the Caribbean. The number of MNEs that reported to GRI from Oceania and Latin America and the Caribbean had approximately the same evolution – with some small differences – in 2007, 2009, 2011, and, respectively, between 2013 and 2017.
The highest numbers of MNEs that reported to GRI, by year, for the 2007–2017 period, were from Europe only – that is: 30 companies in 2017, 32 in 2016, 25 in 2015, 24 in 2014, 26 in 2013, 21 companies in 2012, 20 in 2011, 13 in 2010, 9 in 2009, 7 in 2008, and 7 companies in 2007.
Conversely, the lowest numbers of MNEs that reported to GRI by year were: none from Africa in 2017; one company from Africa between 2013 and 2016; none from Africa between 2010 and 2012; none from Africa and Oceania in 2009; none from Africa in 2008, and none from Africa and Oceania in 2008.
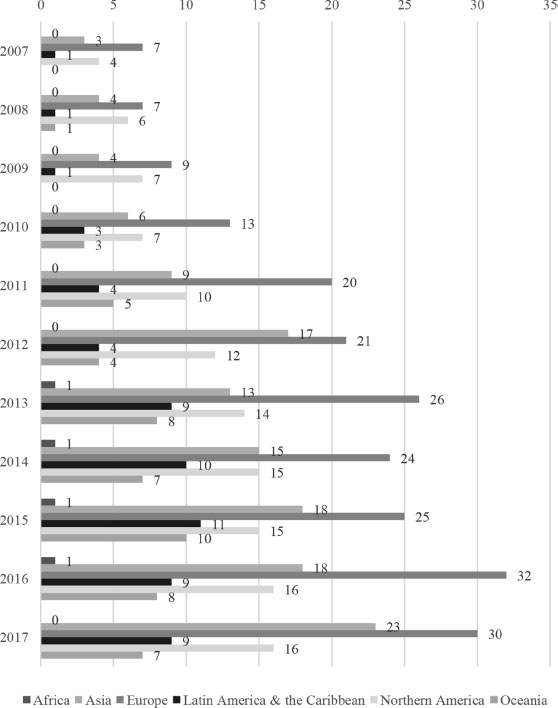
Figure 6.5. GRI reporting evolution of MNEs from the energy sector by region, 2007–2017
(source: compiled by the authors based on data collected from GRI SDD)
With respect to the highest increase in the number of GRI reporting MNEs from the same continent, there were cases such as: companies from Latin America and the Caribbean in 2010 against 2009 (200%); followed by those from Africa in 2013 versus 2012 (100%); companies from Oceania in 2013 as compared to 2012 (100%); those from Asia in 2012 versus 2011 (88.89%); the companies from Europe in 2011 in contrast to 2010 (53.85%); and those from Northern America in 2008 as opposed to 2007 (50%). These increases took place in the first half of the 2007–2017 period and one-third of them were in 2013 against 2012.
In terms of the largest decrease in the number of GRI reporting MNEs from the same continent, the following cases can be highlighted: the companies from Africa in 2017 versus 2016 (100%); followed by those from Asia in 2013 as compared to 2012 (-23.53%); the companies from Oceania in 2012 against 2011, and, respectively, 2016 against 2015 (-20%); those from Northern America in 2016 in contrast to 2015 (-18.18%); and the companies from Europe in 2014 as opposed to 2013 (-7.69%). It must be noted that in the case of the MNEs from Northern America, their number did not decline throughout the analyzed period of time. In 2010, 2015, and 2017, respectively, the number of MNEs from Northern America remained constant and in the years remaining their number rose. These decreases are scattered at the end of first half and throughout the second half of the analyzed period.
Figure 6.6 shows the evolution of GRI reporting by SMEs within the energy sector, by region, between 2007 and 2017. The highest numbers of SMEs that reported to GRI were from Europe, Latin America and the Caribbean, and Asia. More specifically, the highest numbers of SMEs that reported to GRI between 2009 and 2012 were from Europe, between 2013 and 2015 were from Latin America and the Caribbean, and in 2017 were from Asia.
Conversely, the smallest numbers of SMEs that reported to GRI were from Northern America, Oceania, and Africa. The number of SMEs that reported to GRI from Oceania and Africa had approximately the same evolution, with some small differences, in 2011 and 2017.
The highest numbers of SMEs that reported to GRI, by year, for the 2007–2017 period were: 17 companies from Asia in 2017; 11 from Europe and Latin America and the Caribbean in 2016; 14 from Latin America and the Caribbean in 2015; 12 from Latin America and the Caribbean in 2014; 9 companies from Latin America and the Caribbean in 2013; 9 from Europe in 2012; 8 companies from Europe in 2011; 3 from Europe in 2010; 3 from Europe in 2009; one company from Europe in 2008; and one company from Asia in 2007.
The lowest numbers of SMEs that reported to GRI, by year, were: none from Northern America between 2011 and 2017; none from Africa, Northern America, and Oceania in 2010; none from Africa, Latin America and the Caribbean, Northern America and Oceania in 2009; none from Africa, Asia, Northern America, and Oceania in 2008; and none from Africa, Asia, Europe, Northern America, and Oceania in 2007.
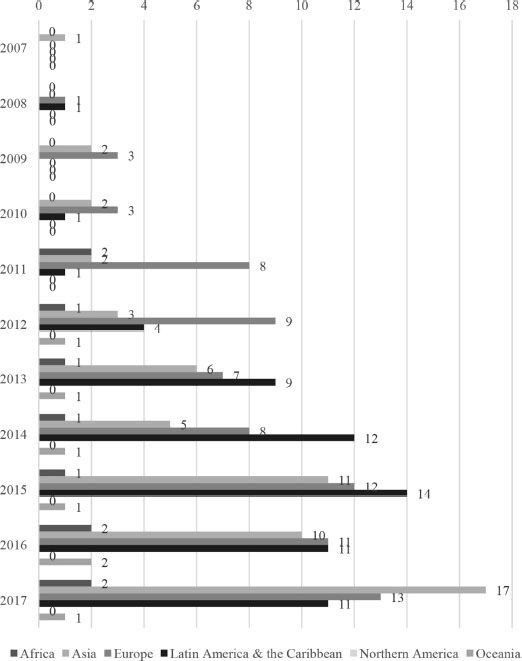
Figure 6.6. GRI reporting evolution of SMEs from the energy sector by region, 2007–2017
(source: compiled by the authors based on data collected from GRI SDD)
In terms of the highest increase in the number of GRI reporting SMEs from the same continent, there were cases such as: the companies from Latin America and the Caribbean in 2012 versus 2011 (300%); followed by those from Europe in 2009 in contrast to 2008 (200%); the companies from Asia in 2015 as opposed to 2014 (120%); and the companies from Africa and Oceania in 2016 against 2015 (100%). These increases were spread across all 11 years, but approximately two-thirds of them were focused in the latter half of the period analyzed.
Concerning the largest decrease in the number of GRI reporting SMEs from the same continent, the following cases can be highlighted: the companies from Africa in 2012 as compared to 2011, and, respectively, Oceania in 2017 as opposed to 2016 (-50%); those from Europe in 2013 versus 2012 (-22.22%); the companies from Latin America and the Caribbean in 2016 against 2015 (-21.43%); and the companies from Asia in 2014 in contrast to 2013 (-16.67%). There are no SMEs from Northern America that reported to GRI between 2007 and 2017. These reductions had a medium distribution range in the analyzed period, starting with 2012 and ending with 2017.
6.4.2. Analysis of the GRI reporting enterprises from the chemicals sector between 2007 and 2017
Figure 6.7 shows the evolution of GRI reporting by large enterprises within the chemicals sector, by region, between 2007 and 2017. The highest numbers of large companies that reported to GRI were from Asia, Europe, and Northern America, with slight differences between 2015 and 2017 for the last two continents. More specifically, the highest numbers of large enterprises that reported to GRI were from Asia between 2007 and 2008, and, respectively, between 2010 and 2017. In 2009, the number of large enterprises that reported to GRI from Asia was the same as the number from Europe.
On the contrary, the smallest numbers of large companies that reported to GRI were from Oceania, Africa, and Latin America and the Caribbean. The number of large companies that reported to GRI from Oceania was relatively constant during the 11 years.
The highest numbers of large enterprises that reported to GRI, by year, for the 2007–2017 period were: 77 companies from Asia in 2017; 72 from Asia in 2016; 56 companies from Asia in 2015; 48 from Asia in 2014; 42 from Asia in 2013; 36 companies from Asia in 2012; 31 from Asia in 2011; 20 from the same continent in 2010; 14 companies from Asia and Europe in 2009; 13 from Asia in 2008; and 7 companies from the same continent in 2007.
At the opposite end, the lowest numbers of large enterprises that reported to GRI, by year, for the same period were: one company from Oceania between 2016 and 2017; none from Oceania in 2015; one company from Oceania between 2011 and 2014; one from Africa and Oceania between 2009 and 2010; and none from Oceania between 2007 and 2008.
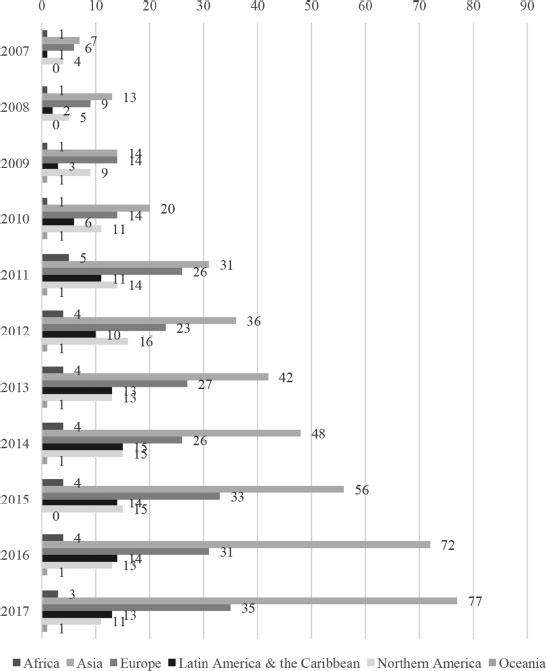
Figure 6.7. GRI reporting evolution of large enterprises from the chemicals sector by region, 2007–2017
(source: compiled by the authors based on data collected from GRI SDD)
With reference to the highest increase in the number of GRI reporting large enterprises from the same continent, there were cases such as: the companies from Africa in 2011 against 2010 (400%); followed by the companies from Latin America and the Caribbean in 2010 as compared to 2009 (100%); those from Asia in 2008 versus 2007 (85.71%); those from Latin America and the Caribbean in 2011 as opposed to 2010 (85.71%); and the companies from Northern America in 2009 in contrast to 2008 (80%). These increases were scattered within the first half of the analyzed period and one-third were in 2009 against 2008.
Concerning the largest decrease in the number of GRI reporting large enterprises from the same continent, the following cases can be highlighted: the companies from Oceania in 2015 versus 2014 (-100%); those from Africa in 2017 as compared to 2016 (-25%); the companies from Northern America in 2013 against 2012 (-18.75%); those from Europe in 2012 as opposed to 2011 (-11.54%); and the companies from Latin America and the Caribbean in 2012 in contrast to 2011 (-9.09%). These reductions occurred within the latter half of the 11 years with a third of them in 2012 in contrast to 2011. A particular case are the companies that reported to GRI from Asia, due to the fact that their number grew continuously in the 2007–2017 period.
Figure 6.8 shows the evolution of GRI reporting by MNEs, by region, between 2007 and 2017. The highest numbers of MNEs that reported to GRI were from Asia, Europe, and Northern America. More specifically, the highest numbers of MNEs that reported to GRI were from Asia in each of the 11 years. More MNEs from Europe reported to GRI than from Northern America, excepting the year 2011.
In contrast, the smallest numbers of MNEs that reported to GRI were from Africa, Oceania, and Latin America and the Caribbean. The number of MNEs that reported to GRI from Africa and Oceania had approximately the same evolution, with some small differences, between 2007 and 2009.
The highest numbers of MNEs that reported to GRI, by year, for the 2007–2017 period were from Europe only, that is: 75 companies in 2017; 78 in 2016; 75 in 2015; 43 companies in 2014; 36 in 2013; 30 in 2012; 25 in 2011; 19 in 2010; 15 in 2009; 15 in 2008; and 13 companies in 2007.
Conversely, the lowest numbers of MNEs that reported to GRI, by year, were: one company from Africa and Oceania between 2010 and 2017; none from Africa and Latin America and the Caribbean in 2009; none from Africa in 2008; and none from Africa and Latin America and the Caribbean in 2007.
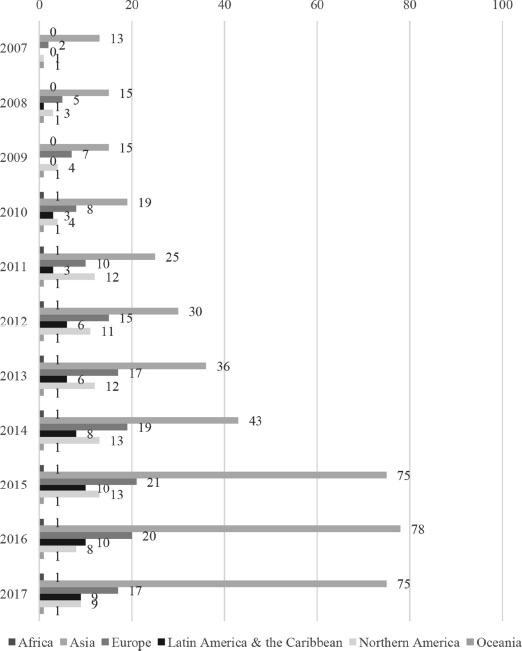
Figure 6.8. GRI reporting evolution of MNEs from the chemicals sector by region, 2007–2017
(source: compiled by the authors based on data collected from GRI SDD)
In terms of the highest increase in the number of GRI reporting MNEs from the same continent, there were cases such as: the companies from Northern America in 2008 as compared to 2007, and, respectively, 2011 against 2010 (200%); followed by the companies from Europe in 2008 versus 2007 (150%); those from Latin America and the Caribbean in 2012 as opposed to 2011; those from Africa in 2011 in contrast to 2010 (100%); and the companies from Asia in 2015 against 2014 (74.42%). The number of MNEs from Oceania that reported to GRI are not part of this ranking as this remained the same from 2007 until 2017. These increases had a large distribution range throughout the analyzed period, both in the first and second half. Approximately a third of them were in 2008 versus 2007.
In terms of the largest decrease in the number of GRI reporting MNEs from the same continent, the following cases can be highlighted: the companies from Latin America and the Caribbean in 2009 versus 2008 (-100%); the companies from Northern America in 2016 as compared to 2015 (-38.46); those from Europe in 2017 in contrast to 2016 (-15%); and those from Asia in 2015 against 2014 (-3.85%). The MNEs from Oceania and from Africa that reported to GRI are not in this ranking, since their number of MNEs did not decline between 2007 and 2017. These decreases were spread throughout the 11-year period and half fall in 2017 versus 2016.
Figure 6.9 shows the evolution of GRI reporting by SMEs within the chemicals sector, by region, between 2007 and 2017. The highest numbers of SMEs that reported to GRI were from Europe, Asia, and Northern America. More specifically, the highest numbers of SMEs that reported to GRI between 2008 and 2013, and, respectively, in 2015 were from Europe; in 2014 they were from Asia and Europe, and between 2016 and 2017 they were from Asia.
In contrast, the smallest numbers of SMEs that reported to GRI were from Africa, Latin America and the Caribbean, and Oceania, with the same evolution over the 11-year period.
The highest numbers of SMEs that reported to GRI, by year, for the 2007–2017 period were: eight companies from Asia in 2017; five from Asia in 2016; six from Europe in 2015; five companies from Asia and Europe in 2014; four from Europe in 2013; four from Europe in 2012; two from Europe in 2011; three from Europe in 2010; two companies from Europe in 2009; and one company from the same continent in 2008. In 2007, there were no SMEs from any of the six continents that submitted reports to GRI.
The lowest numbers of SMEs that reported to GRI, by year, for the same period were: none from Africa, Latin America and the Caribbean, and Oceania between 2013 and 2017; none from Africa and Latin America and the Caribbean between 2011 and 2012; none from Africa, Asia, Latin America and the Caribbean, and Northern America between 2008 and 2010; and none from Africa, Asia, Europe, Latin America and the Caribbean, and Northern America in 2007.
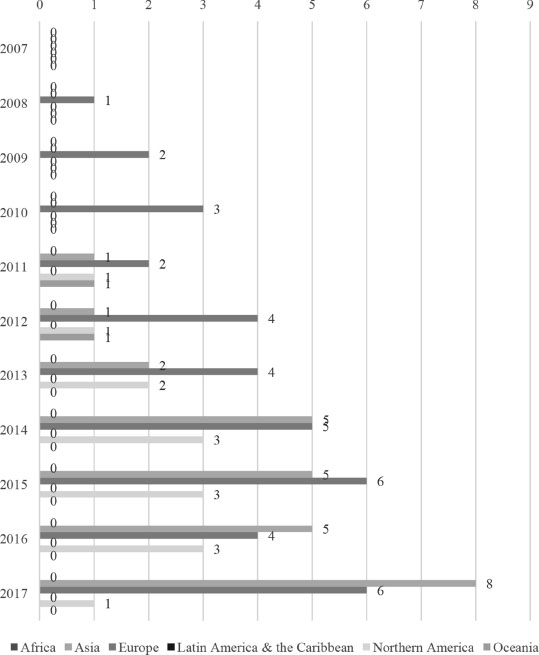
Figure 6.9. GRI reporting evolution of SMEs from the chemicals sector by region, 2007–2017
(source: compiled by the authors based on data collected from GRI SDD)
With reference to the highest increase in the number of GRI reporting SMEs from the same continent, there were cases such as: the companies from Asia in 2014 as compared to 2013 (150%); followed by those from Europe in 2009 versus 2008, and, respectively, 2012 against 2011 (100%); those from Northern America in 2013 as opposed to 2012 (100%); and the companies from Oceania in 2011 in contrast to 2010 (100%). These increases were not correlated and appeared in the first twothirds of the analyzed period.
In terms of the largest decrease in the number of GRI reporting SMEs from the same continent, the following cases can be highlighted: the companies from Oceania in 2013 versus 2012 (-100%); the companies from Northern America in 2017 against 2016 (66.66%); and the companies from Europe in 2011 in contrast to 2010, and, respectively, 2016 as compared to 2015 (-33.33%). This ranking does not include the companies from Asia and Europe as the number of SMEs increased continuously during the 11 years. Furthermore, no SMEs from Africa and Latin America and the Caribbean reported to GRI between 2007 and 2017. The above-mentioned reductions occurred in the latter two-thirds of the 11 years and they are not correlated.
6.4.3. Analysis of the GRI reporting enterprises from the metal products sector between 2007 and 2017
Figure 6.10 shows the evolution of GRI reporting by large enterprises within the metal products sector, by region, between 2007 and 2017. The highest numbers of large companies that reported to GRI were from Asia, Europe, and Latin America and the Caribbean. More specifically, the highest numbers of large enterprises were from Europe between 2007 and 2009, and from Asia between 2010 and 2017.
On the contrary, the smallest numbers of large companies that reported to GRI were from Oceania, Africa, and Northern America. There were slight differences in the number of large companies that reported to GRI from Africa and Latin America and the Caribbean, which are in separate rankings. Although the number of reporting companies from Africa was low in the first part of the analyzed period, this increased steadily to eventually match the number of companies from Latin America and the Caribbean in 2017.
The highest numbers of large enterprises that reported to GRI, by year, for the 2007–2017 period were: 67 companies from Asia in 2017; 57 companies from Asia in 2016; 36 from Asia in 2015; 33 from Asia in 2014; 36 companies from Asia in 2013; 38 from Asia in 2012; 28 from Asia in 2011; 17 companies from the same continent in 2010; 16 from Europe in 2009; 10 from Europe in 2008; and 5 companies from the same continent in 2007.
At the opposite end, the lowest numbers of large enterprises that reported to GRI, by year, throughout the period analyzed were: one company from Oceania between 2014 and 2017; two from the same continent between 2011 and 2013; none from Oceania in 2010; and none from Africa and Oceania between 2007 and 2009.
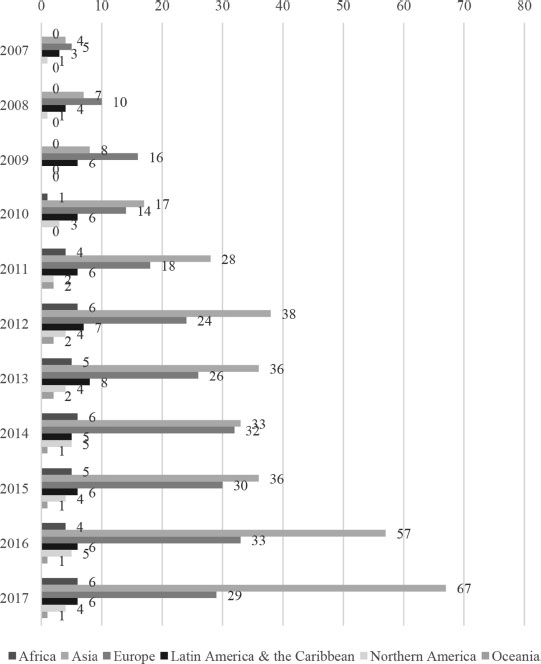
Figure 6.10. GRI reporting evolution of large enterprises from the metal products sector by region, 2007–2017
(source: compiled by the authors based on data collected from GRI SDD)
In terms of the highest increase in the number of GRI reporting large enterprises from the same continent, there were cases such as: the companies from Africa in 2011 as compared to 2010 (300%); followed by the companies from Oceania in 2011 versus 2010 (200%); those from Asia in 2010 as opposed to 2009 (112.5%); those from Europe in 2008 in contrast to 2007; the companies from Northern America in 2012 against 2011 (100%); and those from Latin America and the Caribbean in 2009 as compared to 2008 (50%). All of these increases were scattered in the first half of the analyzed period, and they are not linked.
Concerning the largest decrease in the number of GRI reporting large enterprises from the same continent, the following cases can be highlighted: the companies from Oceania in 2014 versus 2013 (-50%); those from Latin America and the Caribbean in 2014 as opposed to 2013 (-37.5%); the companies from Africa in 2016 in contrast to 2015 (-20%); those from Northern America in 2009 as compared to 2008 (-13.33%); those from Asia in 2010 against 2009 (-12.5%); and the companies from Asia in 2014 versus 2013 (-8.33%). These decreases had a large distribution range across the 11 years, with half in 2014 versus 2013.
Figure 6.11 shows the evolution of GRI reporting by MNEs, by region, between 2007 and 2017. The highest numbers of MNEs that reported to GRI were from Europe, Asia, Northern America, and Oceania. More specifically, the highest numbers were from Europe, leading the ranking in 8 of the 11 years analyzed against the companies from Asia. In third position are two continents instead of one, since the companies from these regions occupied this position in the ranking five times each.
In contrast, the smallest numbers of MNEs that reported to GRI were from Africa and Latin America and the Caribbean. The number of the companies from these regions had a significantly different evolution as those from Africa have not submitted reports to GRI.
The highest numbers of MNEs that reported to GRI, by year, for the 2007–2017 period were: 18 companies from Europe in 2019; 18 companies from Asia in 2016; 16 from the same continent in 2015; 19 from Europe in 2014; 15 from Europe in 2013; 15 from Europe in 2012; 11 companies from Europe in 2011; 8 from Europe in 2010; 9 from Europe in 2009; 6 from the same continent in 2008; and 3 companies from Asia in 2007.
Conversely, the lowest numbers of MNEs that reported to GRI, by year, were: none from Africa between 2011 and 2017; none from Africa and Latin America and the Caribbean in 2009 and 2010; none from Africa, Latin America and the Caribbean, and Oceania in 2008; and none from Africa, Latin America and the Caribbean, Northern America, and Oceania in 2007.
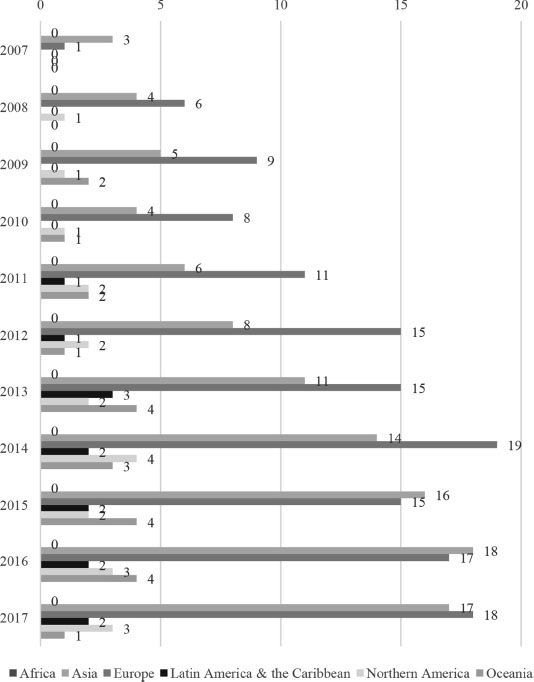
Figure 6.11. GRI reporting evolution of MNEs from the metal products sector by region, 2007–2017
(source: compiled by the authors based on data collected from GRI SDD)
In terms of the highest increase in the number of GRI reporting MNEs from the same continent, there were cases such as: the companies from Europe in 2008 as compared to 2007 (500%); followed by the companies from Oceania in 2013 versus 2012 (300%); Latin America and the Caribbean in 2013 as opposed to 2012 (200%); the companies from Northern America in 2014 in contrast to 2013 (100%); and the companies from Asia in 2011 against 2010 (50%). These increases appeared throughout the analyzed period but most occurred in the first half. A third of the increases were in 2008 as compared to 2007, and another third in 2012 versus 2011.
Regarding the largest decrease in the number of GRI reporting MNEs from the same continent, the following cases can be highlighted: the companies from Northern America in 2015 versus 2014 (-50%); the companies from Oceania in 2010 in contrast to 2009, and, respectively, 2012 against 2011 (-50%); those from Latin America and the Caribbean in 2014 as compared to 2013 (-33.33%); those from Europe in 2015 as opposed to 2014 (-21.05%); and the companies from Asia in 2010 against 2009 (-20%). The MNEs from Africa are not part of the two rankings since they do not appear in the statistics as having submitted reports to GRI. The above-mentioned reductions are scattered throughout the analyzed period, and they are not correlated.
Figure 6.12 shows the evolution of GRI reporting by SMEs within the energy sector, by region, between 2007 and 2017. The highest numbers of SMEs that reported to GRI were from Europe, Asia, and Latin America and the Caribbean. More specifically, the highest numbers of SMEs that reported to GRI between 2007 and 2013 were from Europe; between 2014 and 2016 they were from Asia, and in 2017 they were from both Europe and Asia.
In contrast, the smallest numbers of SMEs that reported to GRI were from Northern America, Oceania, and Africa. The number of SMEs that reported to GRI from Oceania and Africa had the same evolution throughout the 11 analyzed years.
The highest numbers of SMEs that reported to GRI, by year, for the 2007–2017 period were: three companies from Asia and Europe in 2017; four companies from Asia in 2016; five from Asia in 2015; two from the same continent in 2014; three from Europe in 2013; two companies from Europe in 2012; two from Europe in 2011; two from Europe in 2010; two from Europe in 2009; one company from Europe in 2008; and one company from the same continent in 2007.
The lowest numbers of SMEs that reported to GRI, by year, were: none from Northern America and Oceania in 2017; none from Africa, Northern America, and Oceania between 2013 and 2016; none from Latin America and the Caribbean, Northern America, and Oceania in 2012; none from Asia, Latin America and the Caribbean, Northern America, and Oceania in 2011; and none from Africa, Asia, Latin America and the Caribbean, Northern America, and Oceania between 2007 and 2010.
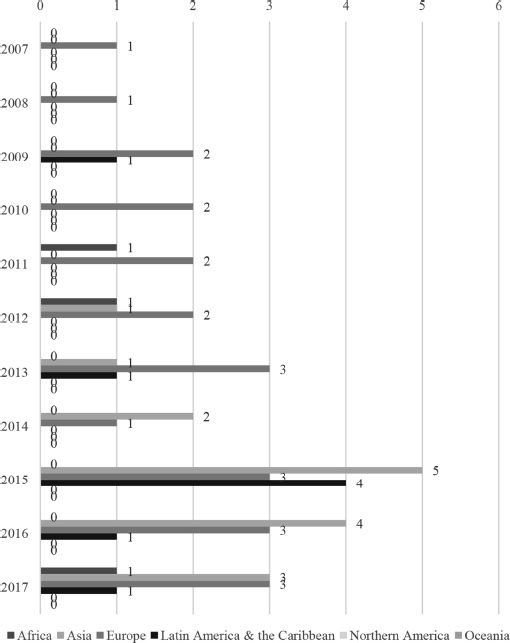
Figure 6.12. GRI reporting evolution of SMEs from the metal products sector by region, 2007–2017
(source: compiled by the authors based on data collected from GRI SDD)
In terms of the highest increase in the number of GRI reporting SMEs from the same continent, there were cases such as: the companies from Latin America and the Caribbean in 2015 versus 2014 (300%); followed by the companies from Europe in 2015 in contrast to 2014 (200%); those from Asia in 2015 as opposed to 2014 (150%); and the companies from Africa in 2011 against 2010, and 2017 versus 2016 (100%), respectively. These increases appeared in the latter half of the 11 years and there is no correlation between them.
Concerning the largest decrease in the number of GRI reporting SMEs from the same continent, the following cases can be highlighted: the companies from Africa in 2013 as compared to 2012 (-100%); the companies from Latin America and the Caribbean in 2010 as opposed to 2009, and, respectively, 2014 versus 2013 (-100%); those from Europe in 2014 against 2013 (-66.67%); and the companies from Asia in 2017 in contrast to 2016 (-25%). The companies from Northern America and Oceania did not submit reports and, as a result, they are not part of this ranking. All of these decreases occurred in the second half of the analyzed period, and 50% of them were in 2014 versus 2013.
6.4.4. Analysis of the GRI reporting enterprises from the mining sector between 2007 and 2017
Figure 6.13 shows the evolution of GRI reporting by large enterprises within the mining sector, by region, between 2007 and 2017. It must be noted that the companies from all six continents reported to GRI each year, making this one of the most reported sectors.
The highest numbers of large companies that reported to GRI were from Africa, Latin America and the Caribbean, and Asia. More specifically, the highest numbers of large enterprises that reported to GRI were from Asia in 2016 and 2017, Africa between 2010 and 2015, and Latin America and the Caribbean between 2007 and 2009.
On the contrary, the smallest numbers of large companies that reported to GRI were from Oceania, Northern America, and Europe. The number of large enterprises from Northern America and Europe had approximately the same evolution between 2007 and 2013. Starting in the year 2014, the number of companies from Europe began to grow and the number of companies from Northern America declined.
The highest numbers of large enterprises that reported to GRI, by year, for the 2007–2017 period were: 49 companies from Asia in 2017; 50 companies from the same continent in 2016; 32 from Africa in 2015; 34 from Africa in 2014; 37 from Africa in 2013; 38 companies from Africa in 2012; 38 from Africa in 2011; 20 companies from the same continent in 2010; 18 from Latin America and the Caribbean in 2009; 15 from Latin America and the Caribbean in 2008; and 11 companies from the same continent in 2007.
At the opposite end, the lowest numbers of large enterprises that reported to GRI, by year, for the same period were: six companies from Oceania in 2017; seven from Northern America in 2016; nine from Northern America and Oceania in 2015; six from Oceania in 2014; four companies from Oceania in 2013; eight from Oceania in 2012; eight from Oceania in 2011; seven from Oceania in 2010; four companies from the same continent in 2009; four from Northern America in 2008; and two companies from Oceania in 2009.
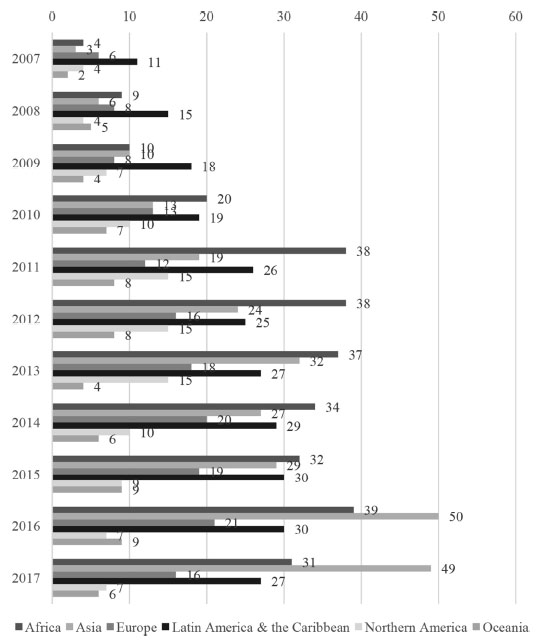
Figure 6.13. GRI reporting evolution of large enterprises from the mining sector by region, 2007–2017
(source: compiled by the authors based on data collected from GRI SDD)
With respect to the highest increase in the number of GRI reporting large enterprises from the same continent, there were cases such as: the companies from Oceania in 2008 as compared to 2007 (150%); followed by the companies from Africa in 2008 versus 2007 (125%); those from Asia in 2008 as opposed to 2007 (100%); those from Northern America in 2009 against 2008 (75%); the companies from Europe in 2010 in contrast to 2009 (62.5%); and those from Latin America and the Caribbean in 2008 versus 2007 (36.36%). All of these increases took place in the first third of the analyzed period – that is between 2008 and 2010 – and two-thirds of them were in 2008 against 2007.
Concerning the largest decrease in the number of GRI reporting large enterprises from the same continent, the following cases can be highlighted: the companies from Oceania in 2013 against 2012 (-50%); the companies from Northern America in 2014 versus 2013 (-33.33%); those from Europe in 2017 as compared to 2016 (-23.81%); those from Africa in 2017 as opposed to 2016 (-20.51%); the companies from Asia in 2014 in contrast to 2013 (-15.63%); and those from Latin America and the Caribbean in 2017 against 2016 (-10%). All of these decreases occurred in the second half of the analyzed period, that is between 2013 and 2017, and 50% of these were in 2017 in contrast to 2016.
Figure 6.14 shows the evolution of GRI reporting by MNEs within the mining sector, by region, between 2007 and 2017. The highest numbers of MNEs that reported to GRI were from Northern America, Oceania, and Europe. The number of MNEs from Europe and Oceania was similar throughout the 11 years, with slight differences in half of the analyzed period.
By contrast, the smallest numbers of MNEs that reported to GRI were from Asia, Africa, and Latin America and the Caribbean. There are several years in which the number of MNEs were the same among these three continents, for example: in 2017, 2016 and 2010 for Africa and Asia; in 2014 for all three continents; in 2013 for Africa and Latin America and the Caribbean; and, respectively, in 2007 for Asia and Latin America and the Caribbean.
The highest numbers of MNEs that reported to GRI by year, for the 2007–2017 period were: 22 companies from Northern America in 2017; 20 companies from Northern America in 2016; 20 from Northern America in 2015; 24 from Northern America in 2014; 21 from Northern America in 2013; 19 companies from Northern America in 2012; 13 from Northern America in 2011; 10 from the same continent in 2010; 7 companies from Northern America and Oceania in 2009; 6 from Northern America in 2008; and 3 companies from Northern America and Oceania in 2007.
Conversely, the lowest numbers of MNEs that reported to GRI, by year, were: four companies from Africa and Asia in 2017; three from the same two continents in 2016; four from Asia in 2015; five companies from Africa, Asia, and Latin America and the Caribbean in 2014; four from Asia in 2013; three companies from Asia in 2012; three from Asia in 2011; two from Africa and Asia in 2010; one company from Africa in 2009; one from Africa in 2008; and one company from the same continent in 2007.
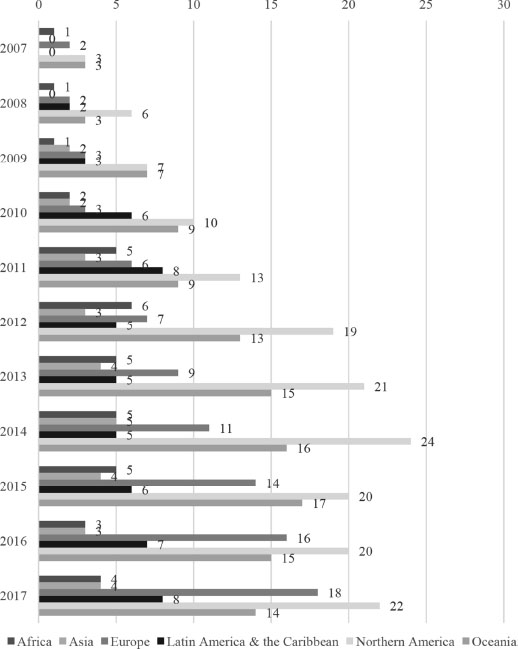
Figure 6.14. GRI reporting evolution of MNEs from the mining sector by region, 2007–2017
(source: compiled by the authors based on data collected from GRI SDD)
In terms of the highest increase in the number of GRI reporting MNEs from the same continent, there were cases such as: the companies from Africa in 2011 versus 2010 (150%); followed by the companies from Oceania in 2009 as compared to 2008 (133.33%); the companies from Europe in 2011 in contrast to 2010 (100%); those from Latin America and the Caribbean in 2010 against 2009 (100%); the companies from Northern America in 2008 as opposed to 2007 (100%); and those from Asia in 2011 versus 2010 (50%). These increases occurred in the first half of the analyzed period, and three out of the six increases were in 2011 in contrast to 2010.
With respect to the largest decrease in the number of GRI reporting MNEs from the same continent, the following cases can be highlighted: the companies from Africa in 2016 versus 2014 (-40%); the companies from Latin America and the Caribbean in 2012 against 2011 (-37.5%); those from Asia in 2016 as compared to 2015 (-25%); those from Northern America in 2015 in contrast to 2014 (-16.67%); and the companies from Oceania in 2016 as opposed to 2015 (-11.76%). The MNEs from Europe are not in this ranking because their number has grown throughout the analyzed period. The above-mentioned reductions were at the end of the first and second half of the 11 years, and approximately two-thirds of them took place in 2016 against 2015.
Figure 6.15 shows the evolution of GRI reporting by SMEs within the mining sector, by region, between 2007 and 2017. The highest numbers of MNEs that reported to GRI were from Asia, Latin America and the Caribbean, and Northern America. There are slight differences between all of these continents, each of them led the ranking in different years.
The smallest numbers of SMEs that reported to GRI were from Oceania, Europe and Africa. The latter two continents had similar numbers of companies, for example: between 2007 and 2010; in 2012; between 2013 and 2015; and in 2017. No SMEs from Oceania submitted reports to GRI throughout the 11 years.
The highest numbers of SMEs that reported to GRI, by year, for the 2007–2017 period were: four companies from Asia in 2017; four companies from Asia and Northern America in 2016; three from Northern America in 2015; five from Asia in 2014; four from the same continent in 2013; two companies from Asia, Latin America and the Caribbean, and Northern America in 2012; three from Latin America and the Caribbean in 2011; two from Asia and Latin America and the Caribbean in 2010; two from Asia in 2009; one company from Asia and Latin America and the Caribbean in 2008; and one from Latin America and the Caribbean in 2007.
Conversely, the lowest numbers of SMEs that reported to GRI, by year, were: none from the following continents: Latin America and the Caribbean, and Oceania in 2017; Europe, Latin America and the Caribbean, and Oceania in 2016; Africa, Europe, Latin America and the Caribbean, and Oceania in 2015; Africa, Asia, and Latin America and the Caribbean in 2014; Africa, Europe, and Oceania in 2013; Oceania in 2012; Europe and Oceania in 2011; Africa, Europe, and Oceania in 2010, Africa, Europe, Northern America, and Oceania in 2009; the same four continents in 2008; and Africa, Asia, Europe, Northern America, and Oceania in 2007.
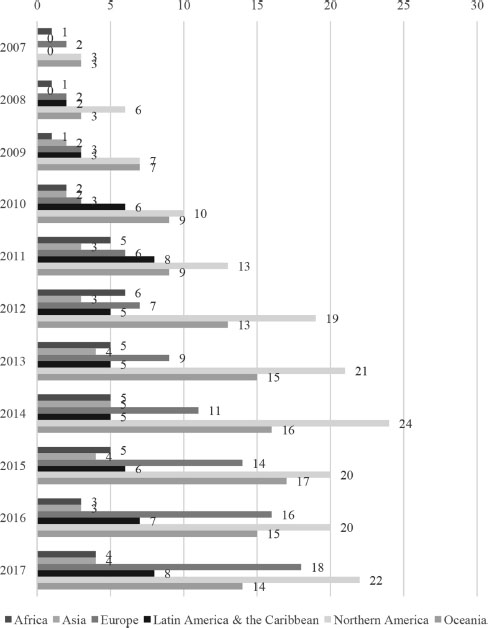
Figure 6.15. GRI reporting evolution of SMEs from the mining sector by region, 2007–2017
(source: compiled by the authors based on data collected from GRI SDD)
In terms of the highest increase in the number of GRI reporting SMEs from the same continent, there were cases in which the increase was 100%, such as: the companies from Africa in 2011 versus 2010, and, respectively, 2016 as opposed to 2015; the companies from Asia in 2009 against 2008, 2013 as compared to 2012, and 2016 against 2015, respectively; those from Europe in 2012 in contrast to 2011, and, respectively, 2017 versus 2016; those from Latin America and the Caribbean in 2010 against 2009; and the companies from Northern America in 2012 as opposed to 2011. These increases were scattered throughout the analyzed period and most of them were focused in the latter half of the period.
With respect to the largest decrease in the number of GRI reporting SMEs from the same continent, the following cases can be highlighted: the companies from Africa in 2013 as compared to 2012 (-100%); the companies from Europe in 2013 versus 2012 (-100%); those from Latin America and the Caribbean in 2015 against 2014 (-100%); those from Asia in 2015 as opposed to 2014 (-60%); and the companies from Northern America in 2014 in contrast to 2013 (-33.33%). These reductions occurred in the second half of the analyzed period. A third of the decreases took place in 2013 versus 2012, and another third appeared in 2015 as compared to 2014.
6.4.5. Analysis of the GRI reporting enterprises from the automotive sector between 2007 and 2017
Figure 6.16 shows the evolution of GRI reporting by large enterprises within the automotive sector, by region, between 2007 and 2017. The highest numbers of large companies that reported to GRI were from Asia, Europe, and Latin America and the Caribbean. More specifically, the highest numbers of large enterprises that reported to GRI were from Asia in 6 out of the 11 years and from Europe in the remaining 5 years.
On the contrary, the smallest numbers of large companies that reported to GRI were from Oceania, Africa and Northern America. The number of large enterprises from the first two continents had a similar evolution, with slight variations in 6 out of 11 years.
The highest numbers of large enterprises that reported to GRI, by year, for the 2007–2017 period were: 59 companies from Asia in 2017; 45 companies from the same continent in 2016; 35 from Europe in 2015; 32 from the same continent in 2014; 31 from Asia in 2013; 26 companies from Europe in 2012; 23 from Asia in 2011; 17 from the same continent in 2010; 13 from Europe in 2009; 10 companies from Asia in 2008; and 5 companies from Europe in 2007.
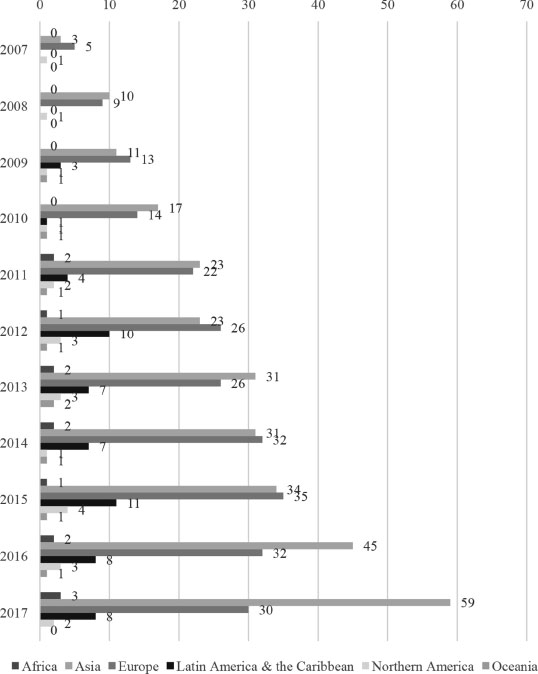
Figure 6.16. GRI reporting evolution of large enterprises from the automotive sector by region, 2007–2017
(source: compiled by the authors based on data collected from GRI SDD)
Conversely, the lowest numbers of large enterprises that reported to GRI, by year, for the same period were: none from Oceania in 2017; one company from the same continent in 2016; one from Africa and Oceania in 2015; one from Northern America and Oceania in 2014; two companies from Africa and Oceania in 2013; one from the same continents in 2012; one from Oceania in 2011; none from Africa in 2010; none from the same continent in 2009; none from Africa, Latin America and the Caribbean, and Oceania in 2008; and none from the same continents in 2007.
In terms of the highest increase in the number of GRI reporting large enterprises from the same continent, there were cases such as: the companies from Latin America and the Caribbean in 2011 versus 2010 (300%); the companies from Northern America in 2015 against 2014 (300%); those from Asia in 2008 as opposed to 2007 (233%); those from Africa in 2011 in contrast to 2010 (100%); the companies from Oceania in 2013 as compared to 2012 (100%); and the companies from Europe in 2008 in contrast to 2007 (80%). All of these increases took place throughout the analyzed period. One-third of them were in 2008 versus 2007 and another third were in 2011 in contrast to 2010.
In relation to the largest decrease in the number of GRI reporting large enterprises from the same continent, the following cases can be highlighted: the companies from Oceania in 2017 against 2016 (-100%); the companies from Latin America and the Caribbean in 2010 against 2009 (-66.67%); those from Northern America in 2014 versus 2013 (-66.67%); the companies from Africa in 2012 as opposed to 2011, and, respectively, 2015 versus 2014 (-50%); and the companies from Europe in 2016 as compared to 2015 (-8.57%). Companies from Asia are not part of this ranking because their number increased each year, across the entire analyzed period. All of these decreases were scattered throughout the 11 years and they are not correlated.
Figure 6.17 shows the evolution of GRI reporting by MNEs within the automotive sector, by region, between 2007 and 2017. The highest numbers of MNEs that reported to GRI were from Asia, Europe and Northern America. The number of MNEs from Asia exceeded the number of MNEs from Europe and Northern America, by far, in each of the 11 analyzed years.
The smallest numbers of MNEs that reported to GRI were from Oceania, Africa, and Latin America and the Caribbean. The number of MNEs from Oceania and Africa had an identical evolution in 6 out of the 11 years. By contrast, the evolution in the number of MNEs from Latin America and the Caribbean was independent of the first two continents.
The highest numbers of MNEs that reported to GRI, by year, for the 2007–2017 period were from Europe only: 27 companies in 2017; 26 in 2016; 23 in 2015; 22 in 2014; 19 companies in 2013; 15 in 2012; 12 companies in 2011; 7 in 2010; 7 in 2009; 5 companies in 2008; and 4 in 2007.
The lowest numbers of MNEs that reported to GRI, by year, were: none from Oceania between 2014 and 2017; one company from Africa and Oceania in 2013; two companies from the same continents in 2012; none from Oceania in 2011; and none from Africa and Oceania between 2007 and 2010.
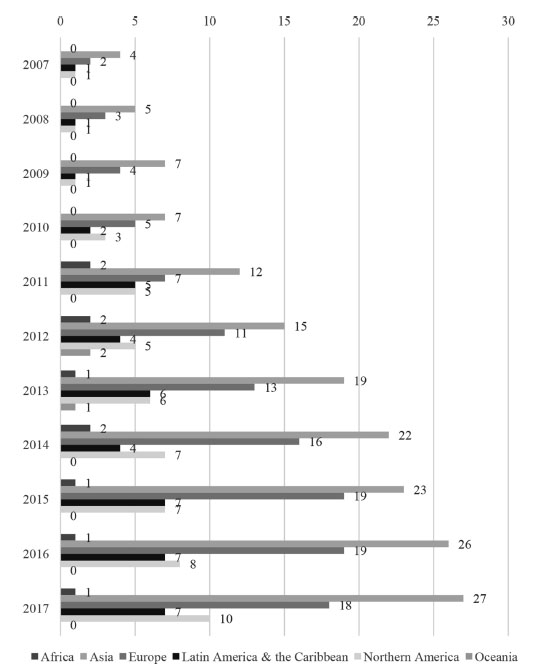
Figure 6.17. GRI reporting evolution of MNEs from the automotive sector by region, 2007–2017
(source: compiled by the authors based on data collected from GRI SDD)
In terms of the highest increase in the number of GRI reporting MNEs from the same continent, there were cases such as: the companies from Northern America in 2010 as opposed to 2009 (200%); followed by the companies from Latin America and the Caribbean in 2011 against 2010 (150%); those from Africa in 2011 versus 2010 (100%); those from Oceania in 2012 as compared to 2011 (100%); the companies from Asia in 2011 versus 2010 (71.43%); and those from Europe in 2012 in contrast to 2011 (57.14%). These increases occurred in the first half of the time period analyzed. Half of the six significant increases were in 2011 versus 2010, and one-third of them were in 2012 against 2011.
With respect to the largest decrease in the number of GRI reporting MNEs from the same continent, the following cases can be underlined: the companies from Oceania in 2014 as opposed to 2013 (-100%); those from Africa in 2013 versus 2012, and, respectively, 2015 as compared to 2014 (-50%); the companies from Latin America and the Caribbean in 2014 against 2013 (-33.33%); and the companies from Europe in 2017 in contrast to 2016 (-5.26%). The companies from Asia and Northern America are not part of this ranking as their number increased each year, throughout this period. These decreases began halfway through the 11 years and extended until the end of the period. Half of the decreases occurred in 2014 as compared to 2013.
Figure 6.18 shows the evolution of GRI reporting by SMEs within the automotive sector, by region, between 2007 and 2017. The highest numbers of MNEs that reported to GRI were from Europe, Latin America and the Caribbean, and Asia. Few companies from these three continents submitted reports to GRI and they only began reporting in 2012.
The smallest numbers of SMEs that reported to GRI were from Africa, Oceania, and Northern America. No SMEs from Africa submitted reports to GRI throughout the analyzed period and the number of companies from Northern America is lower than corresponding companies from Asia, by year.
The highest numbers of SMEs that reported to GRI, by year, for the 2007–2017 period were: two companies from Latin America and the Caribbean in 2017; one from Asia, Europe, and Northern America in 2016; seven companies from Asia in 2015; three from Europe in 2014; one company from Europe and Latin America and the Caribbean in 2012; and one company from Oceania in 2011. The ranking does not contain data about the year 2013 as no reporting took place. Furthermore, the ranking is limited to 2011 onwards, since no companies reported between 2007 and 2010.
The lowest numbers of SMEs that reported to GRI, by year, were: none from the following continents: Africa and Oceania in 2017; Africa, Latin America and the Caribbean, and Oceania in 2016 and 2015; Africa, Asia, and Oceania in 2014; all six continents in 2013; Africa, Asia, Northern America, and Oceania in 2012; Africa, Asia, Europe, Latin America and the Caribbean, and Oceania in 2011; and all six continents between 2007 and 2010.
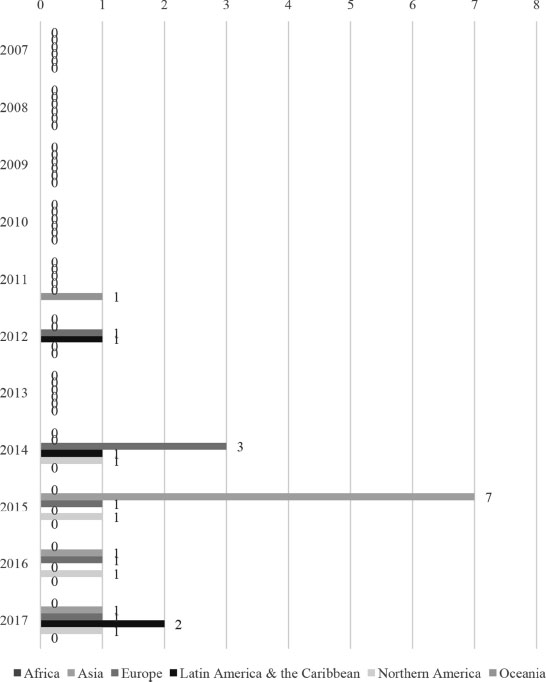
Figure 6.18. GRI reporting evolution of SMEs from the automotive sector by region, 2007–2017
(source: compiled by the authors based on data collected from GRI SDD)
With refence to the highest increase in the number of GRI reporting SMEs from the same continent, there were cases such as: the companies from Asia in 2015 against 2014 (700%); the companies from Europe in 2014 in contrast to 2013 (300%); those from Latin America and the Caribbean in 2017 as compared to 2016 (200%); those from Northern America in 2014 as opposed to 2013 (100%); and the companies from Oceania in 2011 versus 2010 (100%). These increases were scattered in the second half of the analyzed period and approximately 40% are in 2014 versus 2013.
Concerning the largest decrease in the number of GRI reporting SMEs from the same continent, the following cases can be highlighted: the companies from Europe in 2013 versus 2012 (-100%); the companies from Latin America and the Caribbean in 2013 against 2012 (-100%); those from Oceania in 2012 as compared to 2011 (-100%); and those from Asia in 2016 as opposed to 2015 (-85.71%). This ranking does not include the companies from Africa as they did not submit reports; nor does it include the companies from Northern America since their number was constant between 2014 (first year of reporting) and 2017. These reductions occurred in the latter half of the 11-year period and 50% are in 2013 in contrast to 2012.
6.5. Conclusion
The problem of CSR in general, and CSR reporting, presents a lot of variables and interpretations that one researcher may choose to study. CSR is an evolving concept with interest for management and policy makers. CSR reporting, in particular, has come a long way and provides a lot of opportunities for reporting standards and report submission.
The quantitative analysis of policy instruments revealed that the number of those instruments has followed an upward trend and, in the few last years, a balance between mandatory and voluntary instruments has become within reach, after a decade of mandatory policy proliferation. Governments are the main issuer of policy instruments followed by financial markets and stock exchanges; as a result, the main type of policy instruments are public law and regulations. Most policy instruments target all companies and a significant share targets large and listed companies. Most of these instruments incorporate more than one ESG component.
Overall, throughout this period of time, the energy sector had the highest number of GRI reporting companies, irrespective of the type of enterprise, that is 3,026 non-unique companies. This value is 2.86 times higher than that of the metal products and automotive sectors and it is, respectively, 1.77 and 1.74 higher than that of the mining and chemicals sectors.
Taking company type into account in the case of large enterprises, the energy sector also had the highest number of GRI reporting companies, that is 2,226 non-unique companies, 3.51 times higher than the automotive sector, 3.13 times higher than the metal products sector, 2.39 times higher than the chemicals sector, and 1.95 times higher than the mining sector. In terms of MNEs, the chemicals sector had the highest number of GRI reporting companies, that is 730 non-unique companies. This value is 2.46 times higher than the metal products sector, 1.84 times higher than the automotive sector, 1.46 times higher than the mining sector, and 1.24 times higher than the energy sector. Concerning the SMEs, the energy sector had the highest number of GRI reporting companies with 215 non-unique companies, 8.6 times higher than the automotive sector, 4.3 times higher than the metal products sector, 3.16 times higher than the mining sector, and 2.68 times higher than the chemicals sector.
With respect to the sector that had the highest number of GRI reporting companies by region, the data were as follows: in the case of Africa, the mining sector had the highest number of GRI reporting companies, that is 334 non-unique companies, 14.52 times higher than the automotive sector, 8.5 times higher than the metal products sector, 8.35 times higher than the chemicals sector, and 7.42 times higher than the energy sector. In Asia, the energy sector had the highest number of GRI reporting companies, that is 926 non-unique companies, 2.89 times higher than the mining sector, 2.04 times higher than the metal products sector, 2 times higher than the automotive sector, and 1.06 times higher than the chemicals sector.
In Europe, the same energy sector had the highest number of GRI reporting companies, that is 1030 non-unique companies. This number of enterprises is 4.12 times higher than the mining sector, 2.79 times higher than the automotive sector, 2.61 times higher than the metal products sector, and 2.44 times higher than the chemicals sector. For Latin America and the Caribbean, the same energy sector had the highest number of GRI reporting companies with 549 non-unique companies, 6.53 times higher than the metal products sector, 5.08 times higher than the automotive sector, 3.47 times higher than the chemicals sector, and 1.67 times higher than the mining sector.
In Northern America, the energy sector had the highest number of GRI reporting companies, that is 371 non-unique companies. This value is 6.87 times higher than the metal products sector, 4.63 times higher than the automotive sector, 1.61 times higher than the chemicals sector, and 1.29 times higher than the mining sector. As for Oceania, the mining sector had the highest number of GRI reporting companies with 189 non-unique companies, 14.53 times higher than the automotive sector, 9 times higher than the chemicals sector, 5.9 times higher than the metal products sector, and 1.8 times higher than the energy sector.
6.6. References
[ACK 76] ACKERMAN R.W., BAUER R.A., Corporate Social Responsiveness. Reston Publishing, Reston, 1976.
[AND 14] ANDREI J.V., PANAIT M., VOICA C., “Implication of the CSR and cultural model features in Romanian energy sector”, Industry/Industrija, vol. 42, no. 4, pp. 115–131, 2014.
[AND 18] ANDREI J.V., PANAIT M., VOICA M., “Challenges and approaches for the corporate social responsibility and human resource management in the financial sector”, Economics, Management and Financial Markets, vol. 13, no. 3, pp. 415–431, 2018.
[BER 00] BERNSTEIN A., “Too much corporate power”, Business Week, September 11, 2000.
[BOW 53] BOWEN H., Social Responsibilities of the Businessman, Harper, New York, 1953.
[BRE 18] BREZOI A.G., “Ethics and corporate social responsibility in the current geopolitical context”, Economic Insights – Trends and Challenges, vol. 7, pp. 45–52, 2018.
[BUR 99] BURTON B.K., HEGARTY W.H., “Some determinants of student corporate social responsibility orientation”, Business and Society, vol. 38, no. 2, pp. 188–205, 1999.
[CAR 79] CARROLL A.B., “A three-dimensional conceptual model of corporate performance”, Academy of Management Review, vol. 4, no. 4, pp. 498—505, 1979.
[CAR 91] CARROLL A.B., “The pyramid of corporate social responsibility: Toward the moral management of organizational stakeholders”, Business Horizons, pp. 39–48, 1991.
[CAR 09] CARROLL A.B., BUCHHOLTZ A.K., Business and Society: Ethics and Stakeholder Management, 7th edition, South-Western Cengage Learning, Mason, 2009.
[CAR 10] CARROLL A.B., SHABANA K.M., “The business case for corporate social responsibility: A review of concepts, research and practice”, International Journal of Management Reviews, vol. 12, pp. 85–105, 2010.
[CAR 18] CARROLL A.B., BROWN J.A., “Corporate social responsibility: A review of current concepts, research and issues”, in WEBER J., WASLELESKI D. (eds), Corporate Social Responsibility, Emerald Publishing, Bingley, 2018.
[CIU 05] CIUTACU C., CHIVU L., PREDA D., “The social responsibility of the company – A challenge for the contemporary world”, The Romanian Economics Magazine, vol. 20, no. 1, p. 79, 2005.
[CLA 95] CLARKSON M.B.E., “A stakeholder framework for analyzing and evaluating corporate social performance”, Academy of Management Review, vol. 20, no. 1, pp. 92–117, 1995.
[DAV 73] DAVIS K., “The case for and against business assumption of social responsibility”, Academy of Management Journal, vol. 16, p. 2, 1973.
[DEI 16] DEIGH L., FARQUHAR J., PALAZZO M. et al., “Corporate social responsibility: Engaging the community”, Qualitative Market Research, vol. 19, no. 2, pp. 225–240, 2016.
[EHS 18] EHSAN S., NAZIR M.S., NURUNNABI M. et al., “A multimethod approach to assess and measure corporate social responsibility disclosure and practices in a developing economy”, Sustainability, vol. 10, no. 8, p. 2955, 2018.
[ENE 17] ENE C., PANAIT M., “The financial education – Part of corporate social responsibility for employees and customers”, Romanian Journal of Economics, vol. 44.1, pp. 145–154, 2017.
[FRE 78] FREDERICK W.C., From CSR1 to CSR2: The maturing of business-and-society thought, Working paper No. 279, University of Pittsburgh, Graduate School of Business, 1978.
[FRI 70] FRIEDMAN M., “The social responsibility of business is to increase its profits”, New York Times Magazine, p. 126, September 13, 1970.
[GRI 20] GRI-SDD, Global Reporting Initiative: Sustainability Disclosure Database, available at: https://database.globalreporting.org/, 2020.
[HAY 69] HAYEK F.A., “The corporation in a democratic society: In whose interest ought it and will it be run?”, in ANSOFF H. (ed.), Business Strategy, Penguin Books, Harmondsworth, 1969.
[IBR 93] IBRAHIM N.A., ANGELIDIS J.A., “Corporate social responsibility: A comparative analysis of perceptions of top executives and business students”, The Mid-Atlantic Journal of Business, vol. 29, no. 3, pp. 303–314, 1993.
[IBR 95] IBRAHIM N.A., ANGELIDIS J.A., “The corporate social responsiveness orientation of board members: Are there differences between inside and outside directors?”, Journal of Business Ethics, vol. 14, pp. 405–410, 1995.
[LEV 58] LEVITT T., “The dangers of social responsibility”, Harvard Business Review, September/October, pp. 41–50, 1958.
[KOO 03] KOOIMAN J., Governing As Governance, Sage, London, 2003.
[KRA 19] KRAWCZYK P., “CSR reporting standards: Implementation in Polish enterprises”, Journal of Eastern Europe Research in Business and Economics, vol. 2019, pp. 1–9, 2019.
[MAL 93] MALLOTT M.J., Operationalizing corporate social performance: Managerial perceptions of principles, processes and outcomes, Unpublished doctoral dissertation, University of Pittsburgh, 1993.
[MAT 13a] MATEI M., Responsabilitatea socială a corporaţiilor şi instituţiilor şi dezvoltarea durabilă a României, Expert Publishing House, Bucharest, 2013.
[MAT 13b] MATEI M., VOICA M.C., “Social responsibility in the financial and banking sector”, Economic Insights: Trends and Challenges, vol. 65, no. 1, pp. 115–123, 2013.
[MOO 02] MOON J., “The social responsibility of business and new governance”, Government and Opposition, vol. 37, no. 3, pp. 385–408, 2002.
[ONE 89] O’NEILL H.M., SAUNDERS C.B., MCCARTHY A.D., “Board members, corporate social responsiveness and profitability: Are tradeoffs necessary?” Journal of Business Ethics, vol. 8, pp. 353–357, 1989.
[PAN 14] PANAIT M., VOICA M.C., RADULESCU I., “The activity of capital market actors: Under the sign of social responsibility”, Procedia Economics and Finance, vol. 8, pp. 522–528, 2014.
[PAN 15] PANAIT M., PETRESCU M.G., “Quality management and social responsibility in the context of sustainable development”, Industrija, vol. 43, no. 4, pp. 175–189, 2015.
[PIE 00] PIERRE J. Debating Governance: Authority, Steering and Democracy, Oxford University Press, Oxford, 2000.
[PIN 96] PINKSTON T.S., CARROLL A.B., “A retrospective examination of CSR orientations: Have they changed?”, Journal of Business Ethics, vol. 15, pp. 199–206, 1996.
[RHO 97] RHODES R.A.W., Understanding Governance: Policy Networks, Governance, Reflexivity and Accountability, Open University Press, Buckingham and Philadelphia, 1997.
[SCH 03] SCHWARTZ M.S., CARROLL A.B., “Corporate social responsibility: A three-domain approach”, Business Ethics Quarterly, vol. 13, no. 4, pp. 503–530, 2003.
[SMI 01] SMITH W.J., WOKUTCH R.E., HARRINGTON K.V. et al., “An examination of the influence of diversity and stakeholder role on corporate social orientation”, Business and Society, vol. 40, no. 3, pp. 266–294, 2001.
[STE 10] STEURER R., “The role of governments in corporate social responsibility: Characterising public policies on CSR in Europe”, Policy Sciences, vol. 43, pp. 49–72, 2010.
[SWA 95] SWANSON D.L., “Addressing a theoretical problem by reorienting the corporate social performance model”, Academy of Management Review, vol. 20, no. 1, pp. 43–64, 1995.
[SWA 99] SWANSON D.L., “Toward an integrative theory of business and society: A research strategy for corporate social performance”, Academy of Management Review, vol. 24, no. 3, pp. 521–596, 1999.
[VOL 11] VOLLERO A., SIANO A., PALAZZO M. et al., “Corporate communication and CSR: Comparing Italian and Dutch energy companies on anti-greenwashing strategies”, Proceedings from the 1st International CSR Communication Conference, 2011.
[WAR 85] WARTICK S.L., COCHRAN P.L., “The evolution of the corporate social performance model”, Academy of Management Review, vol. 10, pp. 765–766, 1985.
[WOO 91] WOOD D.J., “Corporate social performance revisited”, Academy of Management Review, October, pp. 691–718, 1991.
[ZAM 20] ZAMAN G., PANAIT M.C., VOICA M.C. et al., “Corporate social responsibility in the agri-food sector: Recent advancements in sustainable entrepreneurship and corporate social responsibility”, IGI Global, pp. 37–68, 2020.
Chapter written by Marian Cátálin VOICA and Adrian STANCU.
- 1 https://www.carrotsandsticks.net (accessed on July 4, 2020).