Advanced Debugging PL/SQL Code
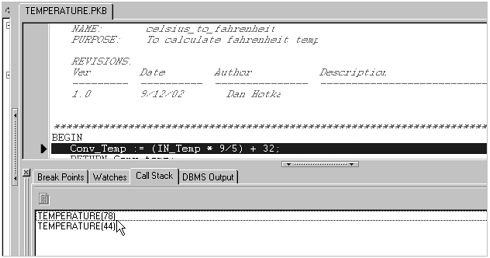
The Call Stack tab is handy to see which routine you are in and at what line number. Notice that Figure 4.58 names the Temperature package twice. This is because at line 44, you entered the Celsius_to_Fahrenheit function (at line 78). This call stack allows you to see the tree structure of called routines based on code execution.
Figure 4.58. Call stack information.

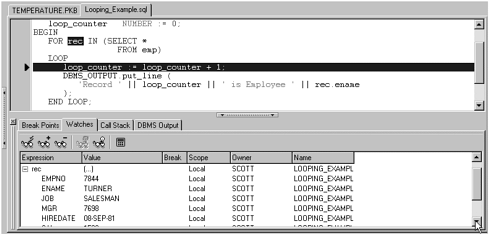
TOAD also allows watches to be set on implicit variables and even record types. Notice in Figure 4.59 that a watch placed on the rec implicit variable (implicit variables are not defined other places in the procedure) displays all of the columns in the EMP table for the row for the conditional breakpoint! You can also position the mouse over the rec variable type, and it will display all the current column data as well.
Figure 4.59. Implicit variable watch.

