
3
Introduction to Program Management
In this chapter, we’ll take what was introduced in Chapter 1 and Chapter 2 and explore it in more depth. As the book progresses, we’ll go deeper into each of the pillars and the traits that define them. To ensure we are not spending time on context building with new examples each time we dive a bit deeper, I’m going to set up the context of this chapter with the introduction of the Mercury program. In this chapter, I’ll define the goals of the program along with the projects that comprise it as a good analog to starting a brand-new program and related projects. Going forward in each chapter, I’ll use this program to examine each area or concept, in detail, as it makes sense in the book.
In this chapter, we’ll explore program management through the following topics:
- Introducing the Mercury program
- Examining the program-project intersection
- Exploring the management areas
Introducing the Mercury program
Back in 2009, in my days as a software developer, I was working at a company that didn’t utilize an internal messaging system. Phones weren’t smart yet, but messaging clients were abundant. However, they all required a central server to be configured in order to manage the messaging network. This wasn’t something that I had access to do, nor was it something the company was willing to supply, so I thought about the idea of a distributed, or peer-to-peer (P2P), messaging system. So, I set out to write one myself, and some of us on the software team used the system for a year or so. It was a fun and distracting side project that we can build upon here as a thought experiment. I called the application Mercury, which is the Roman name for the messenger to the gods.
Let’s take a look at a typical P2P network diagram in Figure 3.1 and explore the benefits of a P2P network over a centralized network:
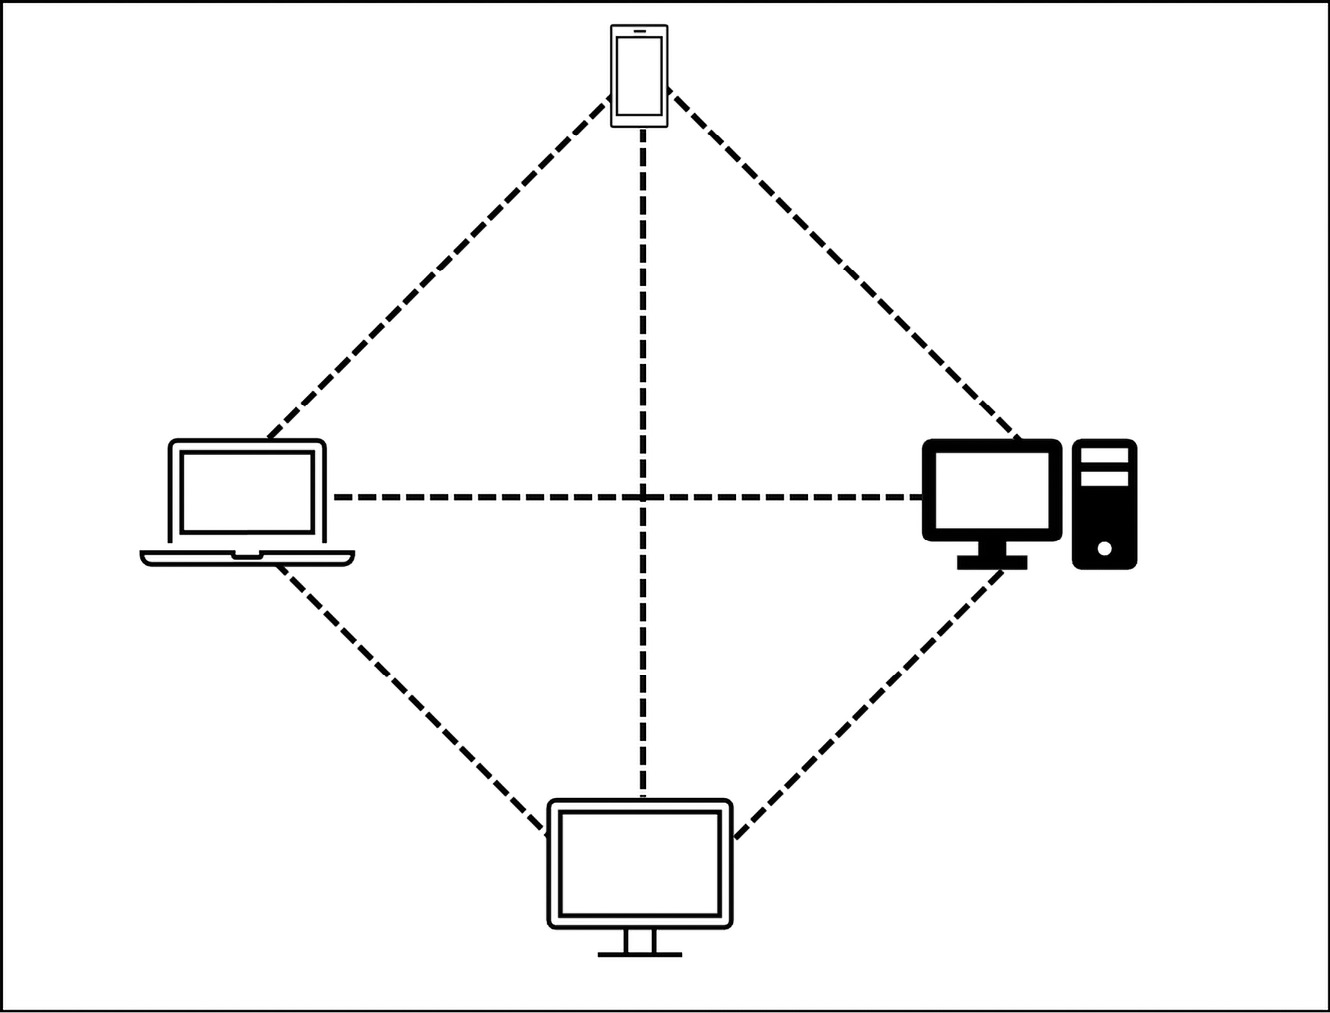
Figure 3.1 – A simple P2P network diagram
In a P2P network, the devices on the network talk directly with one another. This is opposed to talking via a central server. The central server can allow for the storing of network and session data, so only a single copy is needed. However, it means that without the central server, the network can’t function. In a P2P network, each device on the network maintains its own list of connected devices and can relay information if needed. In this model, if one device goes offline, the network can still function, though there can be an increase in overall discovery traffic for activities such as network discovery. Additionally, the P2P network has the added advantage of no central overhead of maintaining a server for the application.
Mercury program scope
A program must have at least one achievable goal and, usually, consists of more than one project to realize them. Although I only built a simple application for Windows, that won’t suffice for this book. So, let’s suppose that we wanted it to be available in more places than just the Windows desktop.
The program goal will be to create a P2P messaging application and have a 90% user reach. As this is the goal of the program, the program will remain open until this goal has been fully achieved.
Mercury project structure
The number of projects in a program and the program roadmap are defined from the goals of the program. The goal was written in a way that has room for analysis and redirection. It states only that the application should have a 90% user reach, but not how to achieve that. This is where the project structure comes into play and how the projects can build upon each other to achieve the goal. For instance, 90% of the user base could, arguably, be achieved in a few different ways. You could target mobile-only Operating Systems (OSs) and focus on Android and iOS, as most people that have a computer also have a phone, and those OSs dominate the market. The user base is also not completely defined here, so shifting from a consumer user base to an enterprise user base could mean that only Windows and macOS are required to achieve that goal. Lastly, you could go all out and utilize all major systems: Windows, macOS, iOS, Android, and Linux. Unlike in 2009, when I wrote the Windows application, there are several cross-platform development environments that make sharing code easier. Work done for one platform can be reused in the others with less effort than having to rebuild from scratch. These ideas will be explored more in Chapters 4 and 5.
A program goal can be more specific if the needs are already well researched, but this sort of goal can also help you start to move forward while working through some of the unknowns. In a real-world example, I was starting a program that impacted the customer experience as well as adding new data to our backend models. During the program initiation and early high-level designs, we realized that the customer-facing changes were ambiguous and would take a lot of iteration to get right. The goal was written in a way that didn’t make it clear that the customer-facing interfaces would need drastic updates, which caused stakeholders to stop and focus on the goal wording. We were faced with either pausing the execution of the program to fully understand this impact or moving forward with this risk to the goal. To not lose the momentum we had, and with the active engagement of all stakeholder teams, we refined the program goal to state that it would include relevant customer experience updates and narrowed the project goal for the year to reference only the backend changes. This allowed us to move forward with diving deeper into the right changes we needed to make, while simultaneously working on the well-understood backend changes. Put succinctly, the goal is a guiding principle to ensure the direction of each project is aligned with the purpose of the program.
However, for our case study, given the high number of opportunities for shared code, which reduces investment, and the user base impact of doing all major OSs, we’ll explore a project breakdown that delivers across all of the OSs. For now, we’ll draw the boundaries for the projects at the OS boundary, as shown in Table 3.1:
|
Project/program name |
Description |
Goal |
How does it help the program? |
|
Mercury program |
Program for P2P messaging app |
Build and deploy a P2P messaging app to 90% of the user base. |
N/A |
|
Android rollout project |
Project for the P2P Android app |
Deploy the app for the Android ecosystem. |
Android represents 72% of the worldwide market share on mobile. |
|
iOS rollout project |
Project for the P2P iOS app |
Deploy the app for the iOS ecosystem. |
iOS represents 26% of the worldwide market share on mobile. |
|
Linux rollout project |
Project for the P2P Linux app |
Deploy the app for the Linux ecosystem. |
Linux represents 2.5% of the worldwide desktop market share. |
|
macOS rollout project |
Project for the P2P macOS app |
Deploy the app for the macOS ecosystem. |
macOS represents 15% of the worldwide desktop market share. |
|
Windows rollout project |
Project for the P2P Windows app |
Deploy the app for the Windows ecosystem. |
Windows represents 76% of the worldwide desktop market share. |
Table 3.1 – The Mercury project structure
The preceding table lists the programs and program goals for easy reference when discussing the project goals. Each project has its own goal – to deploy the P2P app to a given ecosystem – while also contributing to the overall program goal of reaching 90% of the user base.
To ensure that the program is tackling the right OSs to reach 90% of the user base, I included market share statistics from statcounter GlobalStats, with a data range from June 2021 to June 2022. The numbers I use are rounded for readability and don’t add up to 100% due to low-use OSs adding up to statistically relevant amounts. For more information, please visit https://gs.statcounter.com/.
Now that we have had an in-depth look at a use case program and the constituent projects, we’ll continue with the introduction to program management by taking a look at the program-project intersection. We’ll use this case study as we continue to explore the depths of being a TPM as a means to dive deeper into each area.
Examining the program-project intersection
In some companies, the TPM role is specifically listed as a project manager, not a program manager. For the majority of cases where it does refer to programs, the TPM still manages projects, too. This can lead to ambiguity as to the difference – or if there even is one.
In Chapter 2, we briefly discussed the relationship between a program and a project. A program is made up of projects and works toward the goals of the program while having its own goals.
Figure 3.2 illustrates the specific relationship between the Mercury program and the projects within it:
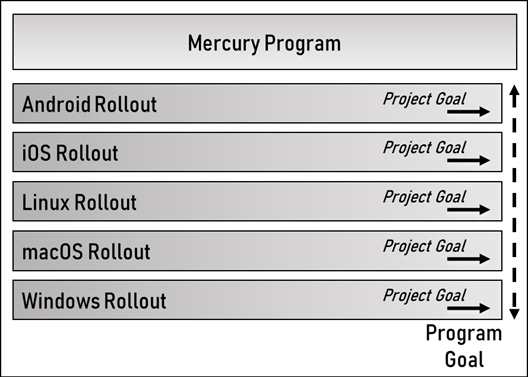
Figure 3.2 – The Mercury program roadmap
The Mercury program’s goal is related to user reach, and the projects are broken down by OS. This figure shows how the projects fit into the roadmap overall. Since we chose to break the program down by OS, there are currently no inter-dependencies, so the relationship is straightforward. As we explore driving toward clarity, in Chapter 4, and project planning, in Chapter 5, the program roadmap will change.
In the Mercury program example, each project’s goal directly contributes to the program goal, as any increase in user reach by an ecosystem deployment will increase the overall user reach and get the program closer to the goal of 90% reach.
Program management for Mercury will start and end with these five projects, as they will achieve the stated goal of the program. As such, the program status will discuss the project goals in cases where they impact the delivery dates. It will also surface any major roadblocks that each project encounters.
As the projects don’t have any interdependencies, each project will only report on the work relevant to that project. They’ll go into deeper details on development blockers, delays, and dependencies within the project.
With the way that the program and projects are currently laid out, a single status report might also suffice given how tightly related all projects are to the end goal of the program. At the end of the day, how you manage the program versus projects depends on many factors and can change from program to program.
We’ve introduced a case study and explored how the program and projects intersect with this example. We’ll continue to build on this program plan and dive into how it is set up throughout the book. For now, we’ll touch on the key management areas and use the Mercury program to explore a bit deeper.
Exploring the management areas
In Chapter 1, I introduced the key management areas: plan, risk, and stakeholder management. Using the Mercury program as an example, we’ll examine each of these in a bit more depth and continue to build upon our use case study.
Project plan
Let’s examine the Windows rollout project plan in a bit more detail. At this point in the book, we’ll assume a few things:
- We have as much resourcing as we need (so, everything that can technically start at the beginning of the project will be scheduled to start)
- No resource timing constraints exist
- Estimates are uniform across all platforms
- All predecessors are considered finish-to-start (meaning the predecessor must be finished before the task can start)
- There are no inter-project dependencies
- In other words, a textbook program example!
Given these assumptions, Table 3.2 lists a simplified project plan for the Windows project:

Table 3.2 – A simplified view of the Windows project plan
In this example, there are a few simple dependencies shown: the user interface milestone requires that the subsystem is completed, and testing requires both preceding milestones to be complete. Now, this is extremely simplified and many seasoned TPMs might be screaming right now at this optimistic project timeline! Don’t worry! As we explore each management area in greater detail, the project and program timelines will be expanded on to highlight those management areas. In the end, we’ll have a more complete plan that demonstrates the strengths the TPM brings to program management.
In Table 3.3, we’ll expand on the Windows project plan, apply the same milestones to each OS, and include some tasks for inter-OS testing:

Table 3.3 – The program plan with the Gantt chart
In the Gantt chart, a month is represented by a single cell, and we assume that 4 weeks is equal to 1 month. Given our initial assumptions of uniform task efforts and unlimited resourcing, we can see that all of the projects (Windows, macOS, Linux, Android, and iOS) start at the same time in January. The inter-OS tests are categorized under the Mercury program as inter-OS testing falls outside the bounds of the individual projects but is required for the Mercury program goals. This could also be a sub-project depending on the organizational structure of your company.
Project and program risks
At this point, we have a full, albeit simple, program plan including plans for all projects. We’ll continue with our current assumptions for consistency while talking about risks. When we go through the exercise of risk analysis, we have a few different inputs to help us identify and categorize them:
- Program and project plans
- Risk register
- Stakeholder input
Let’s take a look at each of these in more detail.
Program and project plans
Filling out the program and project plans can help us visualize constraint risks. Taking this program plan as an example, we can see that a few risks stand out, even with our infinite resourcing assumption. Let’s look at a closeup of the risks in Table 3.4:

Table 3.4 – A closeup of the Gantt chart, focusing on the integration testing
The first risk that stands out to me with our given assumptions is the 10 overlapping integration tests between the platforms. All 10 are running over the same two weeks. Our assumptions are that we have the resources to do this, so that isn’t the risk here. The risk is that this parallel schedule assumes all testing is perfect and that nothing can go wrong. Every system is testing against every other system, and if even one of these integrations were to find a bug, let’s say Windows to Linux, it means that every other Windows integration and Linux integration might potentially be blocked by the same issue. This can lead to significant delays.
Risk register
The risk register is a central storage for all risks that have been identified in previous projects completed in a company or organization. Often, they are categorized in some fashion so that they are searchable based on similar project traits. This could include working with a specific system or team, dealing with the same clients, having the same level of complexity, and more. Honestly, I haven’t found many instances where this risk register is a true database, but that is the perfect scenario.
Instead of a central repository, the risk register often relies on tribal knowledge. This refers to the implicit – known but not easily conveyed – and explicit – able to be easily articulated – knowledge relevant to the organization that is not written down. In this case, you review a plan with your peers to seek out the known risks they can identify and also draw from your own experiences. Though if you do find yourself in a position to create an actual central repository, do it!
For the sake of demonstration, Table 3.5 shows an example of a risk register. This company – which is presumably running the Mercury program – deals with many other cross-platform business systems:

Table 3.5 – A risk register for the Mercury program company
As you can see, there are a number of risks that can happen in one project and translate to the next. The network testing issue for Windows might be present and need to be accounted for in the testing timeline. Based on the root cause, you might be able to mitigate the issue ahead of time, or just need to ensure you have extra time allotted for testing over the network. The app approvals in the Android and iOS stores are common and are likely to happen each time. Again, knowing the root cause could help mitigate this, though the approval steps are constantly changing, so a more prudent approach might be to pad publishing timelines to account for the inevitable back and forth.
Stakeholder input
This is similar to the tribal knowledge aspect of the risk register discussion. Often, stakeholders can offer a different perspective on a problem or perceived risk. They might even have a risk register to share based on similar projects that they have been involved in. This also ties back to communication (which will be a recurring theme in this book) and just how important it is to communicate early and often. This can lead to critical information that can prevent a risk from being realized and save you valuable time.
We’ve talked through the project plan and the risk plan, and we have even covered how they overlap, as demonstrated in this example of stakeholders contributing to the risk plan. Let’s discuss the stakeholder plan itself in more detail.
Stakeholder plan
The stakeholder plan, which includes the communication plan, is another essential area of program management. It can make or break your project and your career. You can be excellent at delivering a project on time, but if your stakeholders are kept in the dark even where there aren’t issues, it will come across poorly. People want to know what is going on.
Aside from just letting your stakeholders know about the status, knowing how to tell them is just as important. Your status report to a development team should read very differently than a status to a senior leader. They have different goals and perspectives regarding the project.
For the Mercury program, there will be several different statuses and, thus, a layered stakeholder engagement and communication plan. Table 3.6 shows the different status reports across the Mercury program.

Table 3.6 – The stakeholder plan for the Mercury program
This table describes three distinct types of reports: development report, monthly report, and quarterly report. Not every company does this many types of reports, and not all projects or programs will warrant sending this many out. This is informational to get an idea of the types of reports you might encounter or wish to use yourself. Also, some companies don’t do written reports at all – but instead, rely on review meetings. However, the same principles should apply.
The development report is a weekly or bi-weekly report on the development efforts. This will include how the development cycle is going, including things such as a burndown or progress chart and velocity, along with any major blockers the team or teams are facing. Using the satellite analogy from Chapter 2, this would be the street view, as in seeing the buildings right in front of you.
The monthly review, which is, sometimes, called a monthly business review, is directed toward stakeholders that are directly involved in the project or program (as in, they have resourcing involved), and upper management teams. The content is focused on the direction of the project or program including major milestones and their statuses. This will include any major issues or blockers that are directly impacting a major milestone but not the lower-level details such as standup and minor development blockers. This is equivalent to the mid-level satellite views – you can see the neighborhoods of the city but can no longer make out exact details on the buildings.
Lastly, the quarterly review, also known as the quarterly business review, is directed toward senior leadership and executive sponsors for the project or program. Here, the content closely matches that of the monthly review but with a quarterly cycle. Some details may be taken out if deemed too granular, as the concern at this level is about the overall health and the end goal’s trajectory. The view here is at the city level, using our satellite analogy.
Chapter 7 will go into more depth on how you can decide which of these communication cycles to utilize, as well as take a deeper look into them.
Summary
In this chapter, we introduced a case study, the Mercury program, which will build a P2P messaging application across multiple ecosystems. We then used the case study to explore a simple program and project intersection discussing various ways to manage status updates. Lastly, we dug deeper into key management areas and refined the definition and roadmap of the Mercury program as a result.
In Chapter 4, we’ll explore one of the most important characteristics of a successful TPM, driving toward clarity. This ability of a TPM to take an ambiguous situation and find or define clarity is what helps us solve problems, find opportunities to reduce risks, and deliver results.