
6
Risk Management
In this chapter, we’ll discuss the risk management process and the type of risks that a TPM may deal with in a technology landscape. We’ll dive into the risk assessment process in greater detail and see how to successfully catalog project and program risks and methods to reduce or remove their impact.
We’ll dive into risk management by covering the following topics:
- Driving clarity in risk assessment
- Managing risks in a technology landscape
- Exploring the differences between a project and a program
Driving clarity in risk assessment
During the introduction to driving clarity in Chapter 4, we discussed the cyclical relationship between project planning and risk assessment. Now, we’ll drive clarity in terms of what risk assessment is and how we continue to manage risk throughout the project’s life cycle.
Risk assessment starts as soon as you have enough information to start assessing, which can be early on in the project. If you start with a project in a domain that you know very well, a single paragraph about the goal of the project may be enough to start analyzing risks. In other cases, where the domain or project itself is too vague, it may take a full requirements document to start analyzing, which is in itself a risk!
Regardless of when the process starts, the steps are the same. Part of the process was outlined in Figure 4.3 in Chapter 4, but the full process has two additional steps that Figure 6.1 outlines:

Figure 6.1 – Risk assessment process
The track and document steps were added to the existing three steps that were covered in Chapter 4 – that is, risk identification, risk analysis, and update plan – to round out the process. Each of these steps is part of the assessment cycle, which is a continuous process throughout the project. We’ll discuss each of the five steps here.
Risk identification
In Chapter 3, we briefly discussed methods to identify risks. These included using a company risk register that contains all past risks from previously completed projects to find risks that fit scenarios in the current project. As an example of a previous project’s risk being useful, a project that had risks related to networking communication would be of interest to the Mercury program to ensure the same risks are accounted for.
In the absence of a risk register, or in combination with it, working with your stakeholders and project team to discuss potential risks is a good approach as well. The more experience you have to draw upon, the easier it is to identify risks and solve complex issues. One of my favorite examples of this is the introduction sequence to the show MythBusters, where the narrator announces that Jamie Hyneman and Adam Savage have 30 years of combined experience. In this case, both Jaime and Adam had careers up to this point, so their combined work and perspectives are equivalent to a single person’s 30-year portfolio. Together, they were able to see the same problem from different perspectives and find ways to move forward. The show often showcased Jamie and Adam pointing out problems with each other’s designs via their perspectives and experiences. In this type of scenario, tribal knowledge, also called institutional memory, can be extremely powerful as it allows for quicker execution within the organization. Tribal knowledge is made up of both documented or documentable knowledge, known as explicit knowledge, as well as implicit knowledge, which is a person’s experience and hunches that can only be conveyed through hands-on discussion and instruction. It’s usually knowledge that is well understood within the organization and acts like muscle memory, meaning less time searching for documentation for a process or policy.
Risk analysis
Searching through registers and discussing with stakeholders and colleagues can lead to a list of risks that need to be analyzed. As with most processes, this can happen organically while having the discussions or it may happen separately. This analysis is where you determine the level of impact the risk would have on the project should it occur, as well as the probability of the risk happening. Both of these are somewhat subjective and will vary from situation to situation. The same risk that was present in an older project may not have the same level of impact or probability on a new project. For instance, let’s say the risk was related to code deployment delays due to a congested service pipeline. As time passed, the reasons the congestion occurred may have improved or worsened. Also, there may be more or fewer code changes for that pipeline than in the older project. Both of these will change the impact the risk has, as well as the probability of it occurring.
During analysis, you might decide to add project tasks to dive deeper into the risk to understand it more. For instance, if you have a risk of using a new framework that your team doesn’t know about, you might add a deep dive task to do a quick proof of concept or find training and get everyone signed up for it, or both.
Some risks may have inherent metrics that you can use to track impact and probability. In the pipeline example, there could be deployment counts and failure rates. Combine this with the number of tasks requiring code changes in that pipeline and you can reliably apply a formula to estimate risk impact and probability.
Other risks will not have metrics or will be indirect correlations, such as developer attrition rates. You can apply an average attrition rate to assess the likelihood of losing a developer, but statistics are about long-term data trends and do not predict immediate behavior.
Updating the plan
In Chapter 3, I listed the plan step as updating the project plan. Though true for that example, you can’t update your project plan unless you have also planned what you intend to do about the risk itself! The risk strategy is often referred to as risk mitigation, but mitigation is only one of four different strategies. I’ve heard some call the risk strategy risk optimization as you are optimizing the strategy for the risk, both good and bad. Each of the strategies has different names, depending on the system you use; these are the names that I use:
- Avoidance: This is when you create a plan to avoid the risk. For instance, if there is a risk involving a faulty piece of equipment, or a vendor with a poor reputation, then avoiding the use of that equipment or vendor is your strategy to avoid the risk. This type of risk is likely one that comes up more often than you would initially think but you often organically deal with the risk and then dismiss it. In these cases, the risk may never make it to your risk log or subsequent company register, but the risk was real and avoided. In some specialties, such as security threat modeling, these are cataloged and still listed in the project risk log, even if they are completely avoided from the start!
- Mitigation: This is when you allow the risk to happen – or it just does – and you minimize the impact that the risk has. For instance, let’s say that a risk can lead to a 4-week delay in a milestone. You might be able to mitigate the risk by crashing (also called swarming) the remaining tasks with additional resources to reduce the delay to 2 weeks. The result of the realized risk causes you to introduce a countermeasure to soften the impact.
- Transference: This is where you transfer the risk to another group. This may sound cruel, but it might make the most sense, depending on the risk. If there is a risk of delays in development due to a team not knowing a framework well, contracting a group that knows that framework may be a better course of action. This option may not always be available, depending on the company and their willingness to contract out or the expertise existing elsewhere.
- Acceptance: This is an option when there is no way to avoid, mitigate, or transfer the risk. Sometimes, the project will just need to take the hit and adjust timelines to compensate. In some cases, there may be ways to avoid, mitigate, or transfer, but the cost to do so is greater than the impact the risk will have on the project. Sometimes, failure is the best course of action.
Risk strategy selection
Each risk can have multiple strategies. In the example given for mitigation, you can also have an avoidance strategy where you re-plan your tasks in a way to add a buffer to timelines. In such cases, the strategy you choose depends on the current state of the risk. If you attempted to avoid it but the avoidance didn’t work, for example, then the mitigation strategy would need to be used. If the mitigation can’t happen because resourcing wasn’t available to crash when needed, then acceptance may be the only course. So, it is important to look at each risk and see all the different strategies that you might be able to employ and how they may fall back on one another.
The next step in the risk assessment process is tracking.
Risk tracking
Once you have identified, analyzed, and planned for risks, you need to track them. Risk tracking is cyclical and can lead to re-analyzing, identifying, and planning on the fly as circumstances change in the project. Their impact may decrease as the project gets closer to completion, or the probability may go up as various factors play out – such as attrition causing reduced resourcing.
Also, risks may come to a point where they are avoided or can no longer impact the project. New risks may also come up as the project evolves. For instance, a security flaw could be published that requires internal systems to be updated immediately. This could result in a temporary standstill of all work in a particular system or package while the vulnerability is being addressed. Though some generic buffer can (and should) be added to unknowns such as this, the risk was still new during the life of the project and needs to be added, analyzed, and tracked.
Documenting the progress
As you are tracking, any updates should be included in your communication plan. Changes to risks should be clearly stated so that there are no unexpected changes in status due to a newly impending risk being realized.
Any changes to strategies, closed risks, or newly added risks should be well documented in the project risk log, status updates, and in the company risk register upon project closure. Documentation is how you build institutional memory that others can rely on.
Now that we know the risk assessment process in more detail, let’s discuss the tools used in risk management.
Tools and methodologies
For a company risk register, some portfolio management tools will provide this functionality. In the absence of these, using whatever centralized documentation tools you have available to capture risks for future reference is useful.
Any project management software has some ability to manage risks at the project level, usually in the form of a risk scorecard and table entry. The scorecard helps you identify the risk score or severity of a risk on a fixed scale. The higher the risk, the closer it must be tracked as it will likely cause some level of issue. This is part of the typical PMP Risk Log system and is the most common for general use.
There are many different scales in use for risk scores. Table 6.1 shows the scale and scorecard I prefer to use:
|
Probability |
Impact |
Risk Score |
|
Low (1) |
Low (1) |
Low (2) |
|
Medium (2) |
Low (1) |
Low (3) |
|
High (3) |
Low (1) |
Medium (4) |
|
Low (1) |
Medium (2) |
Low (3) |
|
Medium (2) |
Medium (2) |
Medium (4) |
|
High (3) |
Medium (2) |
Medium (5) |
|
Low (1) |
High (3) |
Medium (4) |
|
Medium (2) |
High (3) |
Medium (5) |
|
High (3) |
High (3) |
High (6) |
Table 6.1 – Risk scorecard
I use the same three-tier scale across both impact and probability, as well as the resulting score. I have found that a four- or five-tiered scale is too nuanced and can lead to nitpicking the analysis of the probability and impact. The difference between High and Very High is just too subjective. In contrast, the jump from Low to Medium, or Medium to High, is a bit more abrupt when your scale only allows for three levels, and the clarity of whether something is one of two things is easier to classify than whether something is Medium, High, or Very High. A similar strategy is often used in agile sprint planning when the team is collectively estimating the tasks in their backlog. Instead of a linear scale of 1 through 10, the first few Fibonacci numbers are used (1, 2, 3, 5, 8, and 13). This is to remove some debate of what a 3 versus a 4 would be and to add in some critical thought when you need to jump from 8 to 13 as you’ll need to have a reason to make that jump.
I’ve included the numbers next to the tiered values to help illustrate that the resulting risk score is merely the sum of the probability and impact ranks. This also ensures you are being honest in your scoring by not tweaking the score based on any bias.
The risk score correlates to the amount of attention and energy a particular risk may warrant from you. If the risk score is low, then either the impact or probability is low, or both, and not much energy is needed to keep track of it. However, for a high-risk score, the impact is either high or it is almost inevitable that the risk will be realized, meaning that you will need to be ready to act upon your strategies and likely need to watch the risk closely.
In Table 6.2, I’ve included a few high-level, first-pass risks associated with the Mercury program:
|
ID |
Risk |
Probability |
Impact |
Strategy |
|
1 |
Cross-platform tooling issues |
High |
High |
Acceptance: Shift timelines to account for delays Mitigation: Training and crashing |
|
2 |
Tight testing timeline |
Medium |
Medium |
Acceptance: Shift timelines to account for delays Mitigation: Shift timelines to allow for buffer |
|
3 |
App store approval delays |
Low |
Low |
Acceptance: Shift timelines to account for delays |
Table 6.2 – Risk log for the Mercury program
In this risk log, I do not include the actual risk score as it is derivative of the probability and impact. It also saves space for this illustration. However, depending on your stakeholders and status audience, including the calculated risk score for clarity’s sake may be helpful.
For the first two risks, I included both an acceptance and mitigation strategy. Though both wouldn’t necessarily be utilized, depending on the situation when the risk is realized, a different approach may be appropriate.
For the first risk, mitigation can also work as an avoidance tactic. With this risk being identified early enough in the exercise, the best course of action may be building training and crashing into the schedule at the beginning to hopefully avoid the issues of a new platform. However, if not possible at first, these strategies can be used to mitigate the impact it has on the schedule in-flight.
For the second risk, the mitigation and acceptance are also the same – it depends on whether you account for it early or late. This isn’t always the case but was appropriate for this risk. From a planning perspective, ensuring testing has enough room for iteration is the best course of action if you have the space in your timeline to make it work.
The last risk is low-impact and low-probability, so it is a good candidate for acceptance. A quick search of iOS app store approval rates shows that they sit at 60% approval within 24 hours and the outlier approval approaches 5 days. This is a small enough impact and probability that the shift in timelines is acceptable. This could be avoided by adding enough buffer to account for the edge cases on approvals as well.
When risk assessment needs to be quick
When timelines are tight, there are methods to use to ensure that risk assessment is not skipped over entirely. Though there are likely to be gaps in analysis when rushed – as the risk in and of itself should be cataloged – capturing some is better than running the project completely blind to what may come at you down the road.
The risk register, if it exists, is a real time saver if it is searchable using multiple criteria. The more you can filter the results, the more relevant they will be to your specific needs. The probability and impact would still need to be determined but the identification can be largely copied and pasted if need be. Then, a quick iteration to determine the risk score is needed. Often, the strategies to solve a particular risk can be reused if the risks are specific enough to the situation. Again, peculiarities in the exact project may require some tweaking but it’s better than working from scratch.
I’ve found that in cases where a fully indexed risk register isn’t available, even risks that are grouped into larger thematic buckets can be a good shortcut. Think of this as adding labels or tags to each item, such as networking or cross-platform coordination. Even project types can be useful categories. For instance, if you have an ecosystem with multiple data flows, based on the type of transaction taking place, each transaction type or use case could have its own set of risks that are common within that use case. The same refinements would apply here to the probability and impact, as well as strategies.
Lastly, doing a working session with stakeholders to talk through requirements as a single pass can provide a lot of value in a short amount of time. Build in time during the session to identify, analyze, and plan the risk strategies; then, you can update the overall project plan for cases where avoidance was the best strategy to follow.
Driving clarity in risk management is your responsibility as a TPM, and like most aspects of project management, it involves the help of others. In the case of risk identification and analysis, the more people that can contribute to your success, the better.
So far, we’ve discussed some aspects of risk management that you will see, some of which exist regardless of the industry you are in. Next, let’s look specifically at the type of risks you will encounter in the tech industry and use these scenarios to drive further clarity into the Mercury program.
Managing risks in a technology landscape
There are various aspects of software and hardware development that are common in the industry but less so in other professions. These relate to the development process itself. Let’s take a look at a typical software development life cycle (SDLC) and discuss the common risks that arise at each stage:
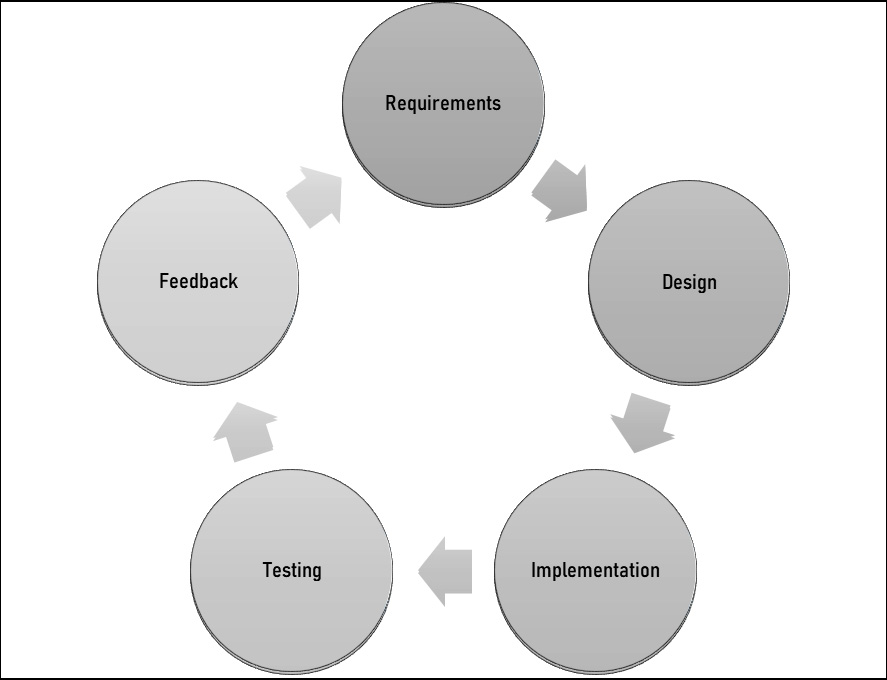
Figure 6.2 – SDLC
The SDLC specifies the series of steps or processes involved in software development. This cycle can be adapted to any style of development, including waterfall and agile methodologies. The steps may vary or happen in mini-cycles within the larger cycle, but the steps are still present. Let’s explore each one.
We’ve already talked about the requirements phase in various forms in this book. In general, the focus of the requirements phase is to reduce the overall risk by bringing clarity to the requirements. The clearer the requirements, the less room there will be for scope creep in low-level designs and their implementation. In that sense, the main risk in this step is not driving clarity.
The design phase is where the high-level and low-level designs are drafted based on the requirements. This process can uncover technical issues with the requirements that were not apparent at first. Aspects that are specific to the technologies being used in a service, or how that service interacts with other services, will come out here in the API definitions, architecture strategies, and release strategy. For distributed systems, also known as Software-as-a-Service (SaaS) architectures, aspects such as latency or availability can play a role in changing or adding requirements and increasing development time as systems often have specific latency targets and availability goals. If your organization is in this type of environment, this risk should always be listed per your company’s practices. While you work on getting estimates for work in the requirements phase, you can ask specifically about hot topics such as latency to ensure they are considered in the estimates given. If there is a set process involved at your company, adding a buffer to account for it may also be an option.
The implementation phase is where the code or hardware is built based on the designs. Developer overhead should be considered in this phase, but this is where a lot of that buffer will be taken up. So, if the team is new, or you are new, and the buffers are newly minted, this could be a risk to watch out for. Track your buffer and constantly re-base your plan as the buffer is taken up. Dates may need to be adjusted or milestones crashed if the buffer is insufficient. Two specific risks may crop up here that the design process may not have caught.
Deploying the code is often not factored into the effort estimates from developers. I often talk about the concept of a task being done, done, done. In that, I mean that a task, or bit of code, is not truly done until the code is written (first done), it is reviewed and approved (second done), and finally has made its way to the production fleet and been verified (the final done). Knowing your time to production, or the amount of time post-code completion that exists until the code reaches production, is a good metric to ensure you are adding enough of a buffer. Also, any temporary stresses on the deployment pipelines should be accounted for. As there are always unknown unknowns, tracking this as a risk is always prudent.
During implementation, you will also need to perform any security certifications that need to take place. Every company’s Information Security (InfoSec) team will have different requirements, depending on the risk aversion of their organization and the nature of the data they work with. These certifications can take up a significant amount of time, depending on what data your service needs to handle, store, and vend. A new service typically takes longer than re-certifying an existing service. The timing of these activities should be known in the company and can be referenced. Regardless of how prepared you are for this process, it is an unknown that is out of your direct control – the InfoSec analysis may find an issue your team didn’t foresee and delay the process further than planned.
The testing step is where a lot of the unknown unknowns cause issues. These can be problems that only robust testing was able to find, usually in edge cases for your software or service. The level of test framework maturity you work with will determine the level of risk involved here. If you are testing a self-contained software package, then high-test coverage can suffice to greatly reduce the chance of undetected defects. In larger, distributed systems, there may be software states or transactions that are so vast in number as to make full test coverage impossible. Also, when adding new features, there are more chances for unknowns since what you are adding is new. These circumstances all add together to determine the level of risk you may face during the testing step.
The feedback step, also known as the evolution or iteration step, is where you plan the next iteration of your product or service based on feedback from users and stakeholders. There are no inherent risks to this stage, though it should include risk analysis while prioritizing which feedback to act upon in the next cycle. This would be a form of high-level analysis; for instance, the feedback may be a good idea but still somewhat vague. This can cause scope creep during the requirements and design phases if the requirement isn’t sufficiently clear enough to transform into requirements.
Cross-step risks also exist within the tech industry. These impact your resource availability due to factors outside of the project. Depending on the company and team that you are working with, on-call rotations can impact developer availability. Though this should have been accounted for during planning, things such as sickness or impromptu time off can shift the on-call schedules and cause a developer to be on-call more than expected to cover for others.
Another cross-step risk that occurs is also related to security: mandatory software updates. This can come in the form of mundane version updates away from versions that are leaving their support cycle. Though these upgrades are well published, a project may run into a use case where it can’t move forward without the upgrade and need to take time to do so. Operational teams can help reduce this burden, but they aren’t always caught and can be a risk to consider.
Another version of a cross-step security risk comes when an industry-wide vulnerability has been discovered that requires immediate attention. In December 2021, the log4j exploit, referred to as log4shell, caused industry-wide panic as firms rushed to patch all log4j instances in their services. Naturally, this was an all-hands-on-deck situation that diverted a lot of development hours into deploying the patch. There’s no arguing, no negotiation of resourcing or payback – projects are just impacted at that moment. These are hard to predict and calling out a risk like this is akin to crying wolf. However, it is good to know that these can and do happen. A good amount of buffer can alleviate the impact if everything else is going well in the project. The good news here, if any, is that most stakeholders are understanding of delays caused by industry-wide catastrophes.
Technical risks in the Mercury program
Each project within the Mercury program will have technical risks, as will the program itself. We’ve already discussed the idea of creating a P2P subsystem that is shared across the different platforms. As this is cross-project work that creates project dependencies for every project, this would be considered a program-level risk. A separate project may be spun up to handle the sub-system, but the risk merely shifts from the program to that project.
To introduce the subsystem, you can use a cross-platform development environment to organize the shared code and make it easier to utilize in each operating system (OS). This platform was called out in Table 6.1 as Risk ID 1 – Cross-platform tooling issues. Table 6.3 provides clarity on this risk by breaking it up into multiple risks:
|
ID |
Risk |
Probability |
Impact |
Strategy |
|
1 |
Cross-platform tooling issues |
High |
High |
Acceptance: Shift timelines to account for delays Mitigation: Training and crashing |
|
1.1 |
New Integrated Desktop Environment (IDE) |
High |
High |
Mitigation: Training on a new IDE |
|
1.2 |
New coding language for some teams |
High |
High |
Mitigation: Training on a new language |
|
1.3 |
Cross-team collaboration |
High |
Medium |
Mitigation: Daily stand-ups, co-location, or chat rooms |
Table 6.3 – Cross-platform IDE risk analysis
Three additional risks were added in the same way you would break down a user story into smaller sub-tasks. I used outline notation to denote that they are related and expand upon the original risk. This list is not exhaustive of the risks that could occur cross-platform but is used to illustrate diving deeper into a risk to add clarity.
Two of the three risks relate to dealing with new technologies, both the IDE as well as possibly a new language. For instance, if the iOS developers are used to using the Swift programming language, they may have a learning curve to switch to a MonoDevelop-supported language such as C#. This task may be easier for an Android developer who is used to using Java as both Java and C# are C-based languages and Swift is not. So, the risk to each project may have a different impact and probability.
The last risk is a risk that occurs anytime you have cross-team or cross-project collaboration as this introduces additional communication. The world today is arguably much better at collaborating across different groups (whether that’s different teams, companies, or locations) since the pandemic forced new habits. The risk still exists, especially when collaborating with a team you are unfamiliar with, as there is always a storming phase where the different groups are working out how to best communicate with each other.
So far, we’ve learned about the risk assessment process and the cyclical nature of assessing and planning for risks, as well as some unique risks faced in the tech industry. Next, we’ll explore how risk management differs between the project and program levels.
Exploring the differences between a project and a program
Risk management, as a process, does not vary between a project and a program. Instead of thinking about cross-task risks at the project level, you must think about cross-project risks at the program level. Risk registers, risk logs, and scorecards are utilized in both cases.
As for the tools, each one provides risk management forms and templates at the project level. Tracking risks at the program level may require some workarounds in popular tools. Creating a program project within the program to track these concerns is one such way. Transferring risks down to the projects can also work, though this will include some duplication. Depending on the level of cross-project communication, each project team knowing about every risk that impacts them is a way to reduce instances of risks being missed.
Assessment
When planning the project composition of a program, one aspect to look at is how the project structures can create risk. Cross-project dependencies require a higher amount of coordination than task dependencies within a project.
Figure 6.3 shows program milestones with dependencies between them. We’ll look at how this division of work can create efficiencies as well as risks:
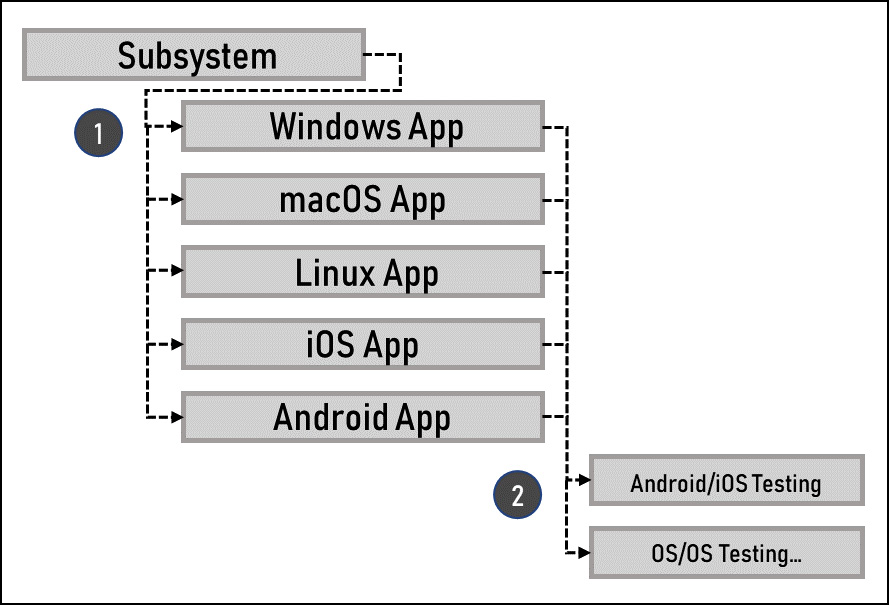
Figure 6.3 – Cross-project risks
In this example, the subsystem for the P2P network is a separate milestone and is tracked outside of the OS projects. By doing this, we remove duplicative effort across all five OS projects, but we introduce the same number of cross-project dependencies on that subsystem, as indicated by label 1 in Figure 6.3. If the subsystem is delayed, it will delay all five subsequent projects.
In label 2, we can see another dependency that exists between all five OS projects. As each OS needs to test interoperability with all other OSes, this can lead to multiple cross-project delays if testing goes wrong in one OS project. For instance, if the Windows Rollout Project is delayed, then all testing with Windows is delayed, which can delay all other projects as well. Some shifting of tests can reduce the impact of the delay by testing the integrations that are readily assuming they weren’t all being run in parallel, or Windows could be completely separated in scope to allow the other platforms to move forward and launch Windows at a later date if more time were needed.
As you can see, just as we would look for and analyze cross-task risks at the project level, you’d do the same at the program level. Each of these risks may be tracked at the project level but should also be monitored at the program level.
Summary
In this chapter, we learned how to drive clarity in risk management through the steps of the risk assessment process. We discussed the different risk strategies available and how tracking risks is a constant process where the strategy that’s utilized to address risk may change over time. Then, we discussed some key risk categories that show up in the tech industry. We also dove deeper into the Mercury program by driving clarity in terms of the identified risks. Lastly, we looked at how risk management differs in scope from the program to project levels and used the Mercury program to illustrate how a program decision can both remove and create risk based on the project composition of the program.
In Chapter 7, we’ll close our deep dive into key management areas by focusing on stakeholder management. We’ll learn how to drive clarity with stakeholders through various stakeholder processes such as communication plans and status reporting. We’ll look at what makes stakeholder management unique in the tech industry and the challenges a TPM will face.