
5
Plan Management
In this chapter, we’ll start delving deeper into the key management areas I discussed in Chapter 1, starting with plan management. We’ll build on the Mercury program example to inspect all stages of creating a plan both at the project and program levels.
We’ll dive into plan management by exploring the following:
- Driving clarity from requirements to planned work
- Planning resources in a technology landscape
- Exploring the differences between a project and a program
Let’s start planning!
Driving clarity from requirements to planned work
In Chapter 4, we discussed the importance of driving clarity in all aspects of a project or program. Out of all of the areas where driving clarity is needed, plan management is the most important.
When writing a project plan, we might find ourselves asking why. Why are we doing this? I ask myself this every time I’m writing one, even though it is one of the aspects of project management I enjoy the most. The answer to why we do it is simple: it enables us to be a force multiplier. We know the work that needs to be done and so does everyone else. The team spends less time on determining what and when and instead focuses on how to achieve the tasks and goals. Driving clarity in requirements early on takes less time than correcting the issue later in execution as this can lead to bad estimations due to poor understanding, which results in longer timelines.
The first step in driving clarity in your requirements and beginning your project plan is choosing the right tool or making full use of the tools you have available. Let’s explore some of the project management tools available.
Project management tools
The project plan is one of the most crucial artifacts for your project. This includes many aspects, which we’ll cover in this chapter, such as the task list, resourcing, and predecessors that combine to produce a Gantt chart of the project timeline. This is a lot of work to do and there are several tools out there that can help you do it.
Through my interviews with industry leaders, I confirmed something I suspected was true all along – there is no standard tool in project management. It often comes down to personal preference combined with the constraints placed by your company, usually related to security concerns arising from your company data being stored on cloud servers.
Nonetheless, I do have a list of tools and feature comparisons to help drive home the variability in the marketplace that exists today. I can say, though, that the one and only tool that was used at every company that I interviewed for this book was Microsoft Excel.
I must confess that I also use Excel from time to time, for instance, for the plans in this book! Sometimes keeping it simple and in a well-known format is the best way to go. You lose a lot of functionality that you will find in dedicated project management tooling, but you are also free from their preconceived notions of what project management must be.
Taking a step up in functionality, Microsoft Project is ubiquitous in the industry – at least in name. It is certainly the standard in regard to features that other tools emulate and is a good introduction to purpose-built tools for project management. However, it doesn’t span multiple projects easily, so for program or portfolio management, tools geared toward portfolio management are best.
I use a portfolio management tool in my day-to-day program management so I can easily track multiple projects and build a program roadmap. I often start in Excel as the resource constraints on how project tasks are planned in most tools do not fit well with how my team handles resourcing. I’ll get into this a bit more later in the chapter.
In Table 5.1, I’ve listed some tools, though certainly not all, that cover portfolio and program management and some high-level features for comparison. Again, it comes down to personal preference and company need but this may help you in making decisions as well as knowing the tools that are out there and in use across the industry.
|
Tool |
Project Management |
Portfolio Management |
Resource Management |
Stakeholder Management |
|
MS Project |
☑ |
☑ |
☑ | |
|
Smartsheet |
☑ |
☑ |
☑ |
☑ |
|
Clarizen |
☑ |
☑ |
☑ |
☑ |
|
Asana |
☑ |
☑ |
☑ |
☑ |
|
MS Excel |
Table 5.1 – Comparing program management tools
The project and portfolio management industry has matured a lot in the last five years and now includes quite a few options that are strictly online and require no local setup. From the areas that we are looking at, most of these tools will provide the basic needs to track a project down to the task level and tie it to resourcing. Stakeholder management for most tools is relegated to an entry list and dashboards to share information with stakeholders.
The two outliers on this list, MS Project, and MS Excel, are added because of their ubiquity. MS Project handles project management well but doesn’t offer portfolio management to the degree you see in other tools in the field. It does have good portability to other tools due to its maturity, so it can be a good starting point. MS Excel offers literally no specialized functionality for project management – it is a blank canvas. You can start working and add new fields (columns) and entries (rows) to the upper limit of the software itself. To this end, there is no barrier to entry or learning curve and most people know how to use it. A word of caution: to be effective, it takes a lot of work to add formulas, lookups, and straight-up manual manipulation.
Note
MS Excel has no built-in functionality but is widely used and thereby included in the comparison table.
Tools are great, especially when they are set up and customized to fit your needs, but this can take time. Time isn’t always on our side and sometimes we just need to get moving. Let’s explore some things you can do when you need to be quick in planning your project.
Diving deep into the project plan
We’re going to explore the step-by-step process of getting a project plan built. This is similar to learning math in the way that you start out writing down every step even when the step is obvious. As you get better, steps are done in your head, or multiple steps are performed at the same time. For now, we’ll show all of the steps. In real life, I usually combine the first two and the next two together. The steps we’ll cover are the following:
- Requirements gathering and refinement
- Building use cases from the requirements
- Task breakdown with estimates
- Assembling the project plan
Let us look at each of these in detail.
Requirements gathering and refinement
This is a crucial step where a TPM drives clarity into the requirements. As this is the first step toward building a plan, everything builds from this foundation, so clarity is key.
Table 5.2 shows the high-level requirements for the Mercury program’s Windows Rollout Project.
|
ID |
Requirement |
|
1 |
Create a peer-to-peer (P2P) messaging system |
|
2 |
System must allow sending text messages to other peers on the system |
|
3 |
Standard UX elements from other messaging apps should be available |
|
4 |
All messages sent and received for a user must be accessible to the user within the app until the user explicitly deletes a message |
Table 5.2 – Initial requirements for the Mercury program’s Windows Rollout Project
The requirements are pretty straightforward here but are high-level. Reading through these, there are quite a few gaps and generalizations. Let’s take a look at them one by one.
Requirement 1 doesn’t mention the type of P2P system. Specifically, it doesn’t mention that no central servers should exist. This is crucial as some P2P systems do have relay servers.
Requirement 2 doesn’t specify anything about the nature of the text of the message. The meaning of the text can vary depending on the situation and should be clarified. For instance, rich text supports formatting, whereas plain text does not.
Requirement 3 is vague in that each messaging application has its own look and feel and feature set. There is no common reference here, so assumptions will be made by whoever is doing the design and their assumptions may not match that of the business team. The desired UX elements should be clearly called out.
Requirement 4 is a compound requirement; it is asking for multiple features in the same line. Though this can be okay, it makes traceability more difficult, so this should be broken up into multiple requirements.
Table 5.3 takes the feedback we just discussed and expands on the requirements.
|
ID |
Requirements |
|
1.0 |
A P2P messaging system, with no servers, should be created |
|
2.0 |
The system must allow sending text messages to other users on the network/system |
|
2.1 |
The text message should support all Unicode characters, including emojis |
|
2.2 |
The text should support rich text formatting (bold, italic, underline, font type, and size) |
|
3.0 |
Standard UX elements seen in other messaging apps should be available |
|
3.1 |
Address book of saved contacts |
|
3.1.1 |
Add to address book |
|
3.1.2 |
Remove from address book |
|
3.1.3 |
Load address book entirely or a single address |
|
3.1.3 |
Export address book entirely or a single address |
|
3.2 |
User profile |
|
3.2.1 |
User profile image |
|
3.2.2 |
User alias should be changeable |
|
3.2.3 |
Short bio section including description/bio, company, title |
|
3.3 |
Presence indicator |
|
3.3.1 |
Configurable statuses |
|
3.3.2 |
Configurable locations |
|
3.4 |
Access control |
|
3.4.1 |
User should be able to accept contact requests |
|
3.4.2 |
User should be able to block contact requests |
|
4.0 |
All messages sent and received should be visible to the user |
|
4.1 |
Exception for when a message is deleted by the user |
|
4.2 |
Messages should contain a status indicator of {sent, received, read} |
Table 5.3 – Clarified requirements
The new requirements utilized an outline numbering system, so the original four requirements keep their ordinals and additional requirements are listed below them. The bolded lines are the original requirements. A messaging system is bound to have a lot of requirements and this list is meant to just be illustrative of some of the expansions that could be made.
For requirement 1, I added the clarification that no central server should exist as a standard P2P network is de-centralized. This is enough for the moment to ensure that the right type of P2P network is being developed.
For requirement 2, two additional requirements were added to provide context that the text should support all Unicode characters as well as rich text formatting. The specific formatting required is also listed to clear any doubt.
For requirement 3, we added the specific features we want to include: an editable user profile, an address book, presence indicators, and access control.
Lastly, requirement 4 was broken down into components for traceability and a status feature was added.
Every person reading this book has a different perspective while reading and thus may find requirements or features that they would add, and possibly some expansion on those I’ve included here as well. This will always be the case and I suggest that requirements analysis is not done in a closed room and that multiple stakeholders are involved, at least at some point, as they may see a gap that you do not.
Building use cases from the requirements
To provide context to the requirements and make it easier to test and validate, use cases are created that may span multiple requirements but tell a story on the behavior of the system. Each use case will trace back to the requirements that it will satisfy to ensure that all requirements are met.
Table 5.4 shows a typical set of use cases for the requirements we’ve reviewed.
|
ID |
Requirement IDs |
Use Case |
|
1 |
1.0 |
As an admin, have no centralized setup or maintenance |
|
2 |
1.0 |
As a user, install and use without a central server |
|
3 |
3.2 |
As a user, create a user profile with a picture and an alias |
|
4 |
3.1 |
As a user, add or remove a contact to my contact list |
|
5 |
3.4 |
As a user, block and accept a contact request |
|
6 |
2 |
As a user, send messages to a contact using rich text |
|
7 |
4 |
As a user, see new messages sent to me |
|
8 |
4 |
As a user, see all messages both sent and received |
|
9 |
4.1 |
As a user, delete a message |
|
10 |
3.3 |
As a user, set presence information |
Table 5.4 – Use cases
The requirements are relatively simple for this application so the use cases will closely follow the requirements one-to-one, though in some more complex projects a single use case may cover multiple requirements. A use case should tell a story about something a user should be able to do. You often see them written out as a story, such as this:
As a user/admin/seller/customer, I can perform some action.
This provides context as to what you are solving and creates a test plan item as well! Also, for use cases that trace back to a top-level requirement, such as in requirement 2, the use case covers all sub-requirements from that requirement as well.
Task breakdown with estimates
Now, we will move on to the start of the project plan itself. We will take the requirements and use cases we have defined, and break them down into tasks. Table 5.5 shows this in detail.
|
ID |
Use Case ID |
Task |
Estimate (Weeks) |
|
1 |
1, 2 |
Create P2P network |
12 |
|
2 |
1, 2 |
Design network |
4 |
|
3 |
1, 2 |
Implement |
6 |
|
4 |
6 |
Text message send/receive API |
8 |
|
5 |
6 |
Set up API for request/response |
4 |
|
6 |
7, 8 |
Use an Ack tag to track message status |
2 |
|
7 |
6 |
Ensure Unicode support in API payload |
1 |
|
8 |
5 |
Text message to new contact initiates contact request |
1 |
|
9 |
4 |
Address book |
16 |
|
10 |
4 |
Add/remove API using message protocol/API |
4 |
|
11 |
4 |
Import/export of the address book |
4 |
|
12 |
4 |
Import/export of an address entry |
4 |
|
13 |
- |
Support search/discovery for members on network |
4 |
|
14 |
3 |
User profile object |
3 |
|
15 |
3 |
CRUD |
1 |
|
16 |
3 |
Alias CRUD |
1 |
|
17 |
3 |
Bio text CRUD |
1 |
|
18 |
10 |
Presence object |
2.5 |
|
19 |
10 |
Status key-value pair |
1 |
|
20 |
10 |
Location key-value pair |
1 |
|
21 |
10 |
Support full Unicode including emojis in values |
0.5 |
|
22 |
5 |
Access control |
1 |
|
23 |
5 |
Accept or deny contact request |
1 |
|
24 |
4 |
Message library |
2.5 |
|
25 |
8 |
Maintain message list for both sent and received |
2 |
|
26 |
9 |
Allow deletion of sent/received message from list |
0.5 |
Table 5.5 – From use cases to tasks
Each of these tasks expands upon one or more of the use cases and provides an estimate in number of weeks. As you can see, many of these are still high-level design and implementation tasks. The level to which you break it down depends on the expectations in your team as well as your ability for a given use case or high-level task to be broken down further. For the presence object, I suggest the data type to use as a key-value pair, but in the user profile object, I merely specify that a Create, Read, Update, Delete (CRUD) model should be used but not how or any specific behaviors.
At this stage, before moving on to the project plan, I will add buffers for the estimates and then review the task list and estimates with my project team. The team should all agree to what they are agreeing to accomplish and roughly the effort that it will take. If you don’t have the information about the estimates (ambiguity and confidence), now is when you work with your team to get those gaps filled in.
Assembling the project plan
The project plan is a living document that goes through multiple phases during the life of the project. In the beginning, it is strictly a plan – it marks the planned path to get to the end. However, as the project starts, it will start capturing real-time data in the form of actuals: actual start date, actual completion date, as well as actual resourcing. For now, we’ll focus on the starting point of the project plan as this form of the plan is what leads to the rest.
There are a few key pieces of data that you need to gather for any project. Aside from the standard items of the task description, duration, and predecessors, you’ll want to capture the requirements that it satisfies. Though I showed this as a separate chart – and it can be a separate exercise – I have found that having a central sheet to see all of the important data is best and reduces the churn of cross-referencing, which can lead to mistakes.
Depending on your company and how you handle resourcing, I have found that capturing the swarming capability of a given task is very beneficial. Swarming is the act of having multiple people work on the same task at the same time. This can be in the form of overlapping sub-tasks such as quality assurance and actual implementation or splitting the development up among multiple developers. The swarming count is the maximum number of cooks in the kitchen that the task can handle but doesn’t represent the actual number of people you might assign if everything is going okay. I have found that having this available ahead of time speeds up my ability to react to changes where I can speed up a task that is in danger of missing a milestone or that impacts other work from being able to start on time.
Last but not least, start date and end date round out the remainder of your basic plan. Your situation may compel you to add more than this, but these are what I have found are a good starting point for every project. In fact, I use a template for the fields I use to ensure that I don’t forget!
Table 5.6 shows the requirements and tasks we’ve covered in this chapter as a project plan with all of the fields we have discussed.
|
ID |
ReqId |
Task |
Duration |
Swarm # |
Predecessors |
Start Date |
End Date |
|
1 |
1 |
Create P2P network |
16 | ||||
|
2 |
1 |
Design network |
6 |
1 |
2-Jan-23 |
6-Feb-23 | |
|
3 |
1 |
Implement |
10 |
2 |
2fs |
13-Feb-23 |
24-Mar-23 |
|
4 |
1.3 |
Create a networkId to tie a message to a given network instance |
3 |
1 |
2fs |
27-Mar-23 |
14-Apr-23 |
|
5 |
2 |
Text message send/receive API |
13 | ||||
|
6 |
2 |
Set up API for request/response |
6 |
2 |
2-Jan-23 |
20-Jan-23 | |
|
7 |
4.2 |
Use an Ack tag to track message status |
3 |
1 |
6fs |
23-Jan-23 |
17-Feb-23 |
|
8 |
2.1 |
Ensure Unicode support in API payload |
2 |
1 |
6fs |
23-Jan-23 |
3-Feb-23 |
|
9 |
3.4.1 |
New text message to new contact initiates contact request |
2 |
1 |
6fs |
6-Feb-23 |
17-Feb-23 |
Table 5.6 – Excerpt of Windows Rollout Project Plan
The plan is relatively straightforward, but we’ll discuss a few points to illustrate how these fields are utilized to build out a project plan. First up, the duration here may look different from the duration first shown because I applied buffers to these numbers. In short, no estimate is perfect, and buffering protects your plan from reality. We’ll discuss this in more detail in the next section. For the swarming number, most of these tasks are straightforward and very singular in nature and adding additional people likely won’t work out, so most are given a value of 1. A few that are implementation-focused received a 2 as a lot of development can be paired up so long as more than one code package is being touched. In a real example, your developers and software development managers should be able to assist you in determining the maximum amount of swarm you can handle. If you know the systems well enough, don’t hesitate to use your own judgment.
For the start and end dates, I used the swarm here as an actual resourcing count, so the duration is split by the resource count. A duration of four weeks but a swarming count of 2 would end up at two calendar weeks. I’ll usually capture the planned resourcing as well, but for brevity, I used the swarm field for both.
The last field to discuss is the predecessor. Though this is a default column in all project management tools, we’ll discuss it as a refresher. There are a few different types of predecessors you can have. The most common is the finish-start relationship, shown as fs, where the task number listed must finish before the given task can start. Start-start (ss), start-finish (sf), and finish-finish (ff) all exist as well and follow the same paradigm. I use finish-start the most – which is likely why it is the default relationship in most tools – though I’ve found it very useful to include lags. For instance, the implementation of a design doesn’t always have to wait until the design is completely finished. There may be aspects of the design, or a key point such as an API definition being ready, where implementation can begin, and you fast-track the implementation. Additionally, you can break the task apart and have the API definition be a separate task and list it as an ff, with the rest of the design as an fs. Just like when swarming, I like to list these areas out ahead of time as well – it doesn’t mean I will fast-track, but I know that I can, and the sooner I know, the easier it will be to quickly adapt to changes. Catching these optimizations in the plan that are based on how to fast-track and how a particular story might be broken down into smaller deliverables is a key way in which a TPM brings value to the planning process.
Now that we’ve discussed the four main steps to take when building a plan, let’s see how we might be able to speed this up somewhat.
When planning has to be quick
Even when you have the time, using time-saving tricks can help you focus on the tasks that have no real shortcuts or just need more attention. Planning can be repetitive from project to project, especially when working with the same teams on domain areas as the themes of the type of work, the people, and resourcing available will be the same, and over time, knowing how well the people work together can help with estimations. When moving fast, removing repetitive work is the highest-value place to focus your energy. Here are the areas with highly repeatable effort that we can reduce the time spent on:
- Repeatable high-level estimates
- Management checklists
- Project plan templates
- Buffering
Let’s explore each of these.
Repeatable high-level estimates
In many environments, there are repeatable tasks that continually come up across projects. These often relate to configurations and data modeling. Keep a list of these tasks, their descriptions, and the typical effort estimate. I typically use a range for the estimate to give some room for quick tweaking. If you feel a specific instance of a task is more complicated, just use the upper range; if standard or simpler, use the lower ranges.
When building out your project plan, consult this list to easily knock out the repeatable items and move on to where your attention is needed. As a bonus, this list is also a good place to pull from for software improvements as repeatable work is the best to automate as it tends to have a high and guaranteed return on investment (ROI).
Management checklists
Just as some tasks are repeatable, there is a lot when it comes to managing a project that is repeated from project to project. Generically speaking, each key management area and process in the project management life cycle has repeated actions: reviewing requirements, building use cases and then a task list, analyzing risks, and building a stakeholder communication plan. The list can be very long as there is a lot to project management, and it is also fungible to a specific scenario. Certain tasks may be reduced to a static list – your stakeholders, for instance, might be the same in a small company or team and may not change from project to project.
As you work on your projects, look at the items you are repeating the most and start creating a list of these items along with standard operating procedures for them. When you are in a hurry on the next project, run down the checklist.
Project plan templates
Many of the portfolio management tools out there offer the ability to create and deploy templates for various aspects of project management. These templates are great for when a particular aspect of the project is standardized for your company or team. They can also take parts of your management checklist and delegate them to others as the template with needed or pre-populated information is already there.
For a project plan, tasks such as requirements gathering and verification, creating functional specifications, and launch plans are tasks that are present for every project. In software development, tasks such as code deployment, integration testing, and end-to-end testing are also always present. These may be added at the end, or possibly per feature or milestone depending on how your software landscape operates.
Buffers
Part of your project plan is adding in task estimates. Aside from the repeatable work I mentioned previously, estimates typically come from subject matter experts, usually developers. As a TPM, you may also be in the position to estimate these items yourself. This depends on your company and team needs as well as your own abilities.
In either case, you will have a set of estimates for each task; however, that is not often added directly into a plan. One of the responsibilities of a PM is to analyze an estimate and project plan and apply buffers. Nothing ever goes exactly according to plan, and it is our job to account for that. To aid in this, I often apply a matrix when determining the right level of buffer. This might take some trial and error to come up with as each person estimates differently, and each company has its own overhead that feeds into standard buffers. Table 5.7 is an example of what this might look like.
|
Level of Ambiguity in Task |
Confidence of Estimate Accuracy |
Team Overhead |
Buffer |
|
Medium |
Low |
10% |
35% |
|
High |
Low |
10% |
40% |
|
Low |
Medium |
10% |
25% |
|
Medium |
Medium |
10% |
30% |
|
High |
Medium |
10% |
35% |
|
Low |
High |
10% |
20% |
|
Medium |
High |
10% |
25% |
Table 5.7 – Estimation buffer matrix
In this example, the team has a modest overhead of 10%. This accounts for standing meetings, recurring training, and other team activities that take a set amount of time. Each team should have its own overhead and should be revisited often to ensure it reflects the current realities in the team.
The level of ambiguity and the confidence of the estimate work together as a scorecard to determine the buffer. In increments of 5%, high ambiguity adds 15% with low at 5%, and the reverse for confidence with high confidence at 5% and low at 15%. This added to the team overhead gets you the percent increase for each estimate. Notice that none of these is 0% because estimates and real life never agree! There is always a buffer for the estimates you have even if you came up with the estimate. Adding buffers, though intuitive and most of us do this, is not the textbook approach to estimations via the critical path or PERT methodologies. This method is closer to the critical chain method. I’ve added a resource in the Further reading section of this chapter.
Note
Table 5.7 makes adding buffers formulaic or straightforward. However, as was alluded to, there is nuance involved here. I’ve spent the better part of my career refining the buffers I use, and I always scrutinize my percentages when there are changes to the team or organization or I’m simply starting a new complex project.
We’ve taken a detailed look into what it takes to drive clarity into requirements in order to produce a working project plan. Now that we have a plan, let’s look closer at defining the milestones and feature list for the project.
Defining milestones and the feature list of a plan
Milestones and feature lists are different measurements that a TPM has against the health of their project. Milestones are often pre-determined and in some organizations are exactly the same for every project. These are goals during the project cycle that the project is moving toward. A few common milestones in a software development project would be design completion, implementation completion, user acceptance testing completion, and launch, as examples. For any given software project, these milestones would all exist to some degree and make it easy to compare project health across a program.
Somewhat in contrast to this, a feature list is specific to a project. As it is called, it’s a list of features that are being built. From an agile methodology, this could be synonymous with the sprint demo at the end of a sprint where the tenet for each sprint is to deliver value. However, it can be separate as well, but in either case, it is an effective way to share when a specific feature will be available to your stakeholders and makes communicating dependent work easier by grouping tasks together that deliver a feature. These features usually correlate to the bolded top-level stories or tasks in my project plan. For instance, the presence object for location and status is a feature that can be delivered alone and be usable, as is the ability to send a text message. As you can see in Table 5.6, the top-level tasks, or features, also correspond to use cases and this is often the case.
Table 5.7 represents the feature list from the project plan.
|
Feature |
Start Date |
End Date |
|
Create P2P network |
2-Jan-23 |
14-Apr-23 |
|
Text message send/receive API |
2-Jan-23 |
17-Feb-23 |
|
Address book |
17-Apr-23 |
9-Jun-23 |
|
User profile object |
20-Feb-23 |
3-Mar-23 |
|
Presence object |
27-Feb-23 |
13-Mar-23 |
|
Access control |
20-Mar-23 |
24-Mar-23 |
|
Message library |
20-Mar-23 |
7-Apr-23 |
Table 5.8 – Feature list
Though the information is available in the project plan, it is often useful to list it separately as these are key metrics to follow the health of a project. As I covered in Chapter 1, different stakeholders require different levels of information and most stakeholders don’t want to sift through a full project plan to discern what is happening, so this provides a concise snapshot of the project’s trajectory.
You should now have a better understanding of the different ways TPMs drive clarity while executing plan management. We used the Mercury program to build out from requirements through to a project plan. We also discussed some tricks to lighten the work during this phase. Next, we’re going to discuss resourcing and how it may look different in a technology company compared to other business domains.
Planning resources in a technology landscape
Every industry has its own unique challenges to project and program management and the tech industry is no different. There are two main aspects to resourcing that are consistent across the tech industry and are worth exploring in more depth: prioritization and team overhead.
Prioritization
From my experience, and through the interviews I conducted for this book, tech companies don’t follow a projectized resourcing model where a project is formed, resources are assigned, and the project keeps the same funding through out the life of the project. Instead, these large companies utilize capacity-constrained prioritization, where they perform multiple prioritization exercises throughout the year to align their existing capacity to the most strategic projects. The frequency of these exercises varies from company to company, and in some cases, team to team, but can happen as often as monthly, quarterly, yearly, or some combination of these. This cyclical prioritization relationship is demonstrated in Figure 5.1.
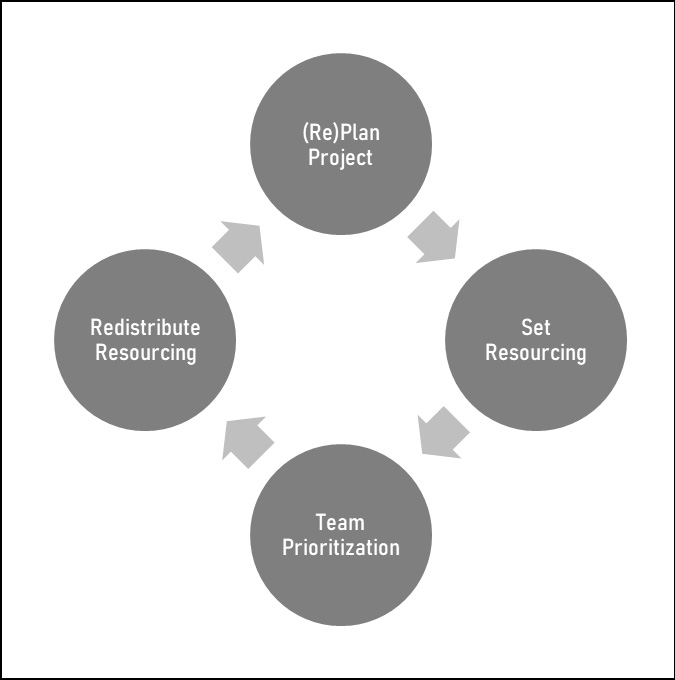
Figure 5.1 – Cyclical prioritization
The preceding diagram shows the relationship between the project plan and the capacity-constrained prioritization process used in tech companies. This is essentially a specialized version of the Plan, Do, Check, Act (PDCA) process. Once a project is planned and resourcing is set, a team prioritization cycle can then change the number of resources for your project either up or down. Either way, this leads to re-planning based on the new numbers you have. This is why I front-load a lot of pre-planning work such as which tasks can handle more resourcing, or swarming, adding in a buffer, and fine-tuning the predecessors so I know quickly how tight a finish-to-start relationship actually is.
Team overhead
We briefly discussed overhead when talking about shortcuts to use while project planning. In the example, I used a 10% overhead buffer. In reality, I’ve seen anywhere from 10% to 40% overhead on various teams I’ve worked with. Let’s talk about a few of the major components of overhead that you’ll want to keep track of.
On-call rotations
Many software development teams have on-call rotations where a software developer will listen to ticket queues for problems. If a severe problem occurs, a developer may be asked to look at the ticket at any time of the day or night. Most on-call rotations are a week in duration where the daily duration may be all 24 hours or split up into shifts to cover the full day or the working day depending on the criticality. During the on-call, the developer is often not available for project work.
Depending on the size of your project and the number of teams you are working with, on-call rotations can be a constant source of resourcing loss that can be much worse than other sources of loss such as vacation. A vacation is usually known well in advance and impacts a single person’s tasks. On the other hand, on-call jumps from person to person, it can impact multiple resources in the same week, and developers may not remember they have an on-call rotation coming up (it’s not nearly as exciting as a vacation, so I don’t blame them).
To help combat this, the buffer time for your project should look at the teams involved and their rotation schedules to ensure you have enough slack to cover the intermittent stoppages in work. Check with the SDMs and the SDEs to understand how heavy ticket queues are as some teams rarely have major issues and an SDE who is on-call may be able to have some project time.
A quick note about on-call and overhead is that I have heard the argument that on-call is separate from overhead and should be tracked separately. To me, this depends on the team(s) you are working with. I usually start with a generalized buffer for overhead that includes on-call and may add explicit on-call items into my project as I know more about the rotation schedule.
Training and team-related work
Like many other industries, technology evolves constantly. To keep up, developers, as well as SDMs, TPMs, and others, attend training to learn about new advances or to brush up on known skills. These are a bit harder to track as it requires constant vigilance on the schedules of your developers and can be as painful as on-call. When a popular course such as Design Patterns comes along, a large number of developers will take the course and can all be gone at once.
Most companies have a schedule of classes that you can use to ask about availability with your team during sprint planning if running agile or some other planning forum. It’s also good to ask SDMs about training quotas for their team and see whether they know the current trend in attendance to help you determine a good buffer.
Team-related work and offsite meetings have a similar impact on the project as training does. Many tech companies have started a trend of hackathon weeks, availability weeks, or improvement weeks. These all are geared toward allowing developers to work on projects that directly impact their services’ maintainability or add some quality-of-life features. During these workshops, the entire team may not be available. The same methodologies apply here in terms of a buffer and consultation on the frequency of these events.
Company- or organization-wide outages
In larger tech companies, there are often company-wide events that can restrict code deployments. The events may be internal, geared toward reliability checks or security, or they may be externally motivated such as a sales event or a press conference for a new product. Though these are not team-by-team or resource-by-resource, they do need to be considered in the overall project plan.
Team meetings
Most teams have some number of standing meetings that range from operations to team-building exercises. This number is often set and the SDMs should have a good idea of what the impact here is. As a note, when discussing overhead, it isn’t too unlikely that this bucket is the only bucket people think about, so be sure to probe when discussing an overhead number so that it covers all of these topics.
Project versus non-project hours
All of these components add up to subtract from the project hours available to a specific team. As each team may be different, there may be different degrees of overhead that you will be tracking in the project. Figure 5.2 demonstrates the breakdown of project and non-project hours.

Figure 5.2 – Showing overhead, non-project, and project hours to determine available hours
In this scenario, the team has an overhead of 30%, leaving 70% of the team members’ time to work on project tasks. The 30% is inclusive of the three sections discussed in the previous section: team meetings, training and vacation, and on-call rotations. The 70% is likely to fluctuate month to month based on actual team meetings, whether or not a particular person was in the on-call rotation for the month, as well as vacations and training. The law of large numbers states that with a large enough dataset, the results will be close to the expected outcome. This means that the overhead percentage of a team will equal the expected amount over the course of a project. When this doesn’t happen, it’s usually because the expected overhead is wishful thinking – ensure that you and your team are being honest when determining this number; it may just uncover a need for process improvement.
Resource overhead
The overhead mentioned here is illustrative and will change from team to team. When I discuss overhead it references the type of overhead that there is some control over. If absolutely needed, I can request that an SDM take an SDE out of the on-call rotation or pause training for a limited time.
Now let’s move on to discuss the tools that you will use for resource planning in a technology landscape.
Tooling for resource planning
Just as with project planning, most tools on the market cover resourcing in the same way: non-swarming and projectized. For some industries, this practice is fine and follows how they approach resourcing. However, as discussed in this chapter, tech companies tend to use capacity planning that may shift due to priorities over the life of the project.
The lack of swarming capabilities means that a task timeline won’t automatically reduce when you add additional resources, it will actually reduce the time each resource works on the task and keep the duration the same. Some tools allow you to change this behavior, but it isn’t consistent. This means any time you need to swarm – or even want to know what the impact of swarming would be – you need to do it manually either through changing durations or forcing the hours spent to reduce the calendar time.
In prioritization meetings, I am often approached by management asking what dates I could meet with x, y, or z resources. So, instead of me dictating the number of people I need, I help weigh the number of resources against priority based on the best ROI I can provide. In these circumstances, I often export to Excel in a Gantt chart style and manually move tasks around to see the outcome.
The other issue, somewhat alluded to, is that the resourcing provided and the optimized resourcing for a project rarely match. This leads to issues where tasks with no written predecessors will all start at the same time, regardless of the number of people assigned. Some tools, such as MS Project, will warn you that a resource is overbooked but requires step-by-step approval to shift timelines. This is still far better than other tools that completely ignore, or hide under a budget sub-system, the fact that resources are overbooked. Not all tools are like this either, but I am yet to find a tool that can handle all of these issues well, so you are left with manual work in at least one of these scenarios. For this, I’ll often use a forced constraint for the start date or create a fake predecessor based on resource availability.
When planning has to be quick
When planning a project, ensure that you do not forget about overhead. Either ahead of a project, or through multiple projects with multiple teams, build up tables of standard items per team such as vacation trends, on-call rotations, team outings, or improvement weeks, as well as training.
If the tables are still taking longer than you have, then a quick chat with SDMs on their understanding of their teams’ overhead can suffice early on in a project. Usually, a 10-minute conversation with an SDM to talk through the overhead list from this chapter and fill in values is enough time for a rough number. As it is an estimate in and of itself, don’t forget to add a buffer until you have enough data to make the numbers more concise.
With regards to vacations, these often vary from person to person, some patterns may exist within your team, especially depending on the type of services they run. Local holidays often play into when people will take time off, such as Christmas, or a simple 3-day weekend that is padded to 4 or 5 days. Watch for these patterns and ensure that they are considered when planning.
Now that we know a little bit more about resourcing in a technology landscape, let’s apply this to the project plan for the Mercury program in Table 5.9.
|
Task |
Duration |
Swarm # |
Resourcing |
Start Date |
End Date |
|
Create P2P network |
16 | ||||
|
Design network |
6 |
1 |
Arun |
2-Jan-23 |
6-Feb-23 |
|
Implement |
10 |
2 |
Arun, Bex |
13-Feb-23 |
24-Mar-23 |
|
Create network Id |
3 |
1 |
Arun |
27-Mar-23 |
14-Apr-23 |
|
Arun on-call |
1 |
1 |
Arun |
20-Feb-23 |
24-Feb-23 |
|
Bex on-call |
1 |
1 |
Bex |
6-Mar-23 |
10-Mar-23 |
Table 5.9 – Updated partial plan with resourcing
For the sake of formatting and space, I reduced the fields that are visible as well as the number of tasks to be enough to understand the concepts we are discussing. As you can see in Table 5.9, Arun and Bex both have on-call rotations during the project. They both fall during the implementation of the P2P network between 2/14/23 and 3/28/23. Notice that the duration is 10 weeks and with two resources this should last five weeks on the calendar, but it actually takes six weeks. This accounts for the week each that both Arun and Bex are unavailable.
As I did here, the on-call is a separate task on the project so that it is easy to track. However, some tools allow you to enter calendar time off in the tool itself, and this can automatically shift work during the time off. Though a bit of extra work, I prefer the approach of adding tasks because it makes the gap in the Gantt chart much more explicable. With resourcing, you have to cross-reference other sections of the tool and cannot easily convey this via a plan without manual work.
We’ve discussed project planning in great detail and applied the knowledge to the Mercury program example. We then saw how resourcing is different in a technology landscape. Last, we’ll explore how planning differs between a project and a program.
Exploring the differences between a project and a program
Many of the tools and processes are the same between a project and a program. One major difference is scope. In this case, there is the program scope, which has its own set of requirements in the form of the program goals. These requirements are relayed down to the projects that impact them. Though I’ve been referencing the Windows Rollout Project, these requirements could easily have been for any of the other platforms.
When starting the program, you need to refine the goals in the same way you refine the project requirements. In Chapter 3, we stated the Mercury program’s goal is to have a P2P messaging application with a 90% user reach. This is an okay goal with enough wiggle room to assume success, but from a requirement standpoint, it’s too vague. What is user reach? How do we measure 90% of that?
There are also technical issues with this statement. Let’s say that the user base means all users of a given platform. The P2P network would span across the world, and thus across physical and logical networks. Many devices that have access to the internet do not have a public-facing IP address meaning there is no way for a direct connection from one device to another when they are on different networks. A relay would be needed to – at the very least – route the call between the devices. This can be done in a way to make the traffic not readable by the relay and for it to be a dumb router, which would satisfy most information security (InfoSec) teams at large tech firms. However, this loosely goes against the requirement of no centralized system.
Even if we talk about a private installation of this program for an enterprise client, their network is likely large enough for internal network segmentation that also requires a relay. If the relays were also installed on the local network, they would need to be maintained and essentially centralized. The relays could be public and maintained by the Mercury program corporation, but this would force traffic out of the network to travel across network segments.
As you can see, just by probing a bit into two words in the goal, we uncovered several potential issues that the program will need to address before the projects can start their work.
Let’s look a bit closer at some of the aspects of plan management that may require some different strategies.
Tooling
The tools used for program versus project planning are largely the same, so long as the tool can handle portfolio management. Having multiple projects under a program or portfolio umbrella allows unique reporting as well as cross-project dependency tracking. Some tools will automatically update a cross-project dependency once a slip occurs while others require an explicit refresh to the cross-project dependency.
The automatic tying of multiple projects can act as a forcing function so that everyone is aware of the dependency as well as any change to it.
Planning
As a TPM running a program, one of your responsibilities will be to find opportunities across project boundaries to optimize time, effort, and scope. This is done by evaluating the technical requirements and possible solutions to optimize the path forward, which can lead to a better architecture by ensuring designs across projects align and are consistent where feasible.
For this program, there are multiple platforms that will have their own instance of the Mercury messaging app. When you have the same app across multiple platforms, there are opportunities for shared code. Some operating systems will more easily be able to share code than others.
When I wrote the original Windows application, Microsoft’s .NET was around Framework 3.5 and the Common Language Runtime (CLR) for non-Windows systems was not robust. This would have meant that only code written in C – a language shared by all of these platforms – would be shareable. Arguably, the pain of writing in such a low-level language would outweigh the benefits.
In recent years, there have been frameworks that more capably span across operating systems. With the proliferation of smartphones and smart TVs, the desire to write once and deploy in multiple platforms has led to better tools to facilitate this.
Mono Project is one such framework. It uses the open source version of the .NET framework and has CLRs for all of the platforms that we are targeting in this program. The amount of code sharing possible will depend on the level of system coverage each CLR has on its respective operating system as well as the number of idiosyncratic definitions of network protocols and other lower-level APIs as these can cause divergencies in implementations.
From a planning perspective, these questions may become initial work at the program level to determine the right path forward in terms of frameworks to use and the target amount of code sharing that balances the difficulties in coordinating and writing with the reduced scope per-project. This is yet another example of where a technical program manager brings value to the program by evaluating technical avenues to increase the efficiency of the plan.
Knowing when to define a program
As discussed earlier in this section, scope is the major differentiator between a program and a project. Chapter 1 also discussed that a program often has a longer timeframe than a project. When your company’s projects are around half a year to a year in length, a program may be multiple years long. If projects are a few months long, a program may only last up to a year. In any case, though, they are relative to one another.
When you are faced with a set of requirements or goals and are trying to decide whether to spin up a project or a program, there are a few litmus tests you can do to see whether a program is the right fit:
- Do you have multiple goals to achieve?
- Is the timeline fixed or based on achieving the goals?
- How many stakeholders are involved?
If you have multiple goals to achieve, then multiple projects, one or more per goal, would ensure clarity of purpose for each project. In this case, a program to manage these projects would make the most sense. To be clear, by multiple goals, I’m not referring to features or milestones but end goals.
If the goal you are trying to achieve has a deadline, this is often a reason for a focused project to drive toward the deadline. If you have multiple goals, and one is time-bound, a program with a project specifically for the time-bounded goal may be a good fit.
Lastly, if your goal spans multiple departments or organizations within your company, all driving toward the goal or goals, a program with projects per organization may be the most effective way to manage the large number of stakeholders. Each organization may have a succinct deliverable that contributes toward a goal.
Figure 5.3 takes a close look at the company organization structure and how the Mercury program and the projects within relate.

Figure 5.3 – Project and program boundaries
The company responsible for the Mercury application divides devices between desktop and mobile. Within these divisions, each operating system has its own team with its own roadmap and priorities. The Mercury program spans both divisions and each operating system team is responsible for a project within the Mercury program to deliver Mercury on their OS. This can be useful to map out because at first glance, the number of stakeholders in this example isn’t too large, but the way they are organized and the large vertical slice of the program goal that they each own lends this to be treated as a program with projects as opposed to a single project.
As the questions alluded to, a program will often span multiple organizations and goals. It utilizes the Mercury program’s company structure to show how the program spans multiple organizations with each organization having a dedicated project.
An answer to one of these questions in favor of a program does not mean that a program is absolutely required but may lean your answer in that direction. For instance, a regulatory compliance project in a company may need to span operations and accounting organizations but with a deadline and concrete deliverable, a project is likely the best way forward. Conversely, the Mercury program has a single stated goal but spans multiple organizations each with a concrete deliverable of an app that contributes to that goal and with no constraint on the timeline. Though this could be treated as a project, the complexities across the organization and distinct deliverables lend themselves to be treated as a program.
At the end of the day, these questions and answers are inputs to help you decide what the most effective and easy way to manage your goals will be for you.
Summary
In this chapter, we discussed plan management in greater detail. We drove toward clarity by refining requirements into use cases, tasks, and then a basic project plan. Asking questions during each step ensured that each artifact could be traced back to the requirements.
We covered how a tech firm can add unique challenges to plan management through capacity-constrained prioritization causing mid-project changes in resourcing based on priority shifts. We also discussed the components of team overhead in a tech team including on-call rotations that service-based teams utilize for service health and stability.
We started discussing the various tools that are available to program managers for both projects and programs and each key management area. Lastly, we discussed how planning differs between a project and a program, which is tied to scope, and that defining a program comes down to ease of management of the goals you are delivering.
In Chapter 6, we’ll continue the deep-dive discussions and focus on risk management. We’ll cover in more detail what risk management is, how driving clarity works in risk analysis, and discuss the unique challenges in technology that contribute to risks you will likely see in your project. We’ll also build on the Windows Rollout Project plan that we’ve developed in this chapter and run a risk analysis.
Further reading
- Dr. Goldratt, Eliyahu. Critical Chain (North River Press, 1997). This book describes the critical chain methodology that I have discussed under the Buffers heading in this chapter. The method is more intuitive to the way we work and give us a tangible way to handle the unknowns by assigning buffers based on complexity and ambiguity.