INTRODUCTION
The Simplify Wall Street Portfolio
Many people refer to “Wall Street” and the “financial industry” as if these were synonymous. We’ll sometimes take that liberty, too, but in reality, many financial services firms operate far from the actual Wall Street in Lower Manhattan. In discussing the financial industry, wherever it may operate, we follow a definition described in a 2012 paper, “The Growth of Modern Finance,” by Harvard Business School professors Robin Greenwood and David Scharfstein.1 These authors give a detailed breakdown of the U.S. financial industry:
![]() the securities industry (investment management and advisory services, brokerage, etc.),
the securities industry (investment management and advisory services, brokerage, etc.),
![]() credit intermediation (loans, bank deposits, credit cards, etc.), and
credit intermediation (loans, bank deposits, credit cards, etc.), and
![]() the insurance industry.
the insurance industry.
The securities industry, the fastest-growing sector, is what we mean when we use the term “financial industry” in this book.
Almost everybody gets one thing wrong about the financial industry: they think people in the financial industry know how to make money and therefore can help them make money, too. They think these folks have “magical” ways to make money with money, since most people in the financial industry make good money themselves.
Certainly some people in the financial services industry are smart and do know how to make money, but not in the way you think—not because of any particularly special or high-level knowledge requiring turbo-charged brainpower. This is the sort of fundamental fallacy we’ll explore more fully in Part II, where we discuss the “deadly temptations” common to investors of all types. The fact is, Wall Streeters and others in the financial services industry know how to make money in the most mundane way you can imagine: by charging more for their products and services than it costs to make or deliver them. In other words, they make money by generating a profit. It’s how they generate that profit and why that profit is so big that is the basis of our argument to resist the deadly temptations and follow our 3 Simple Rules instead.
HOW THE FINANCIAL INDUSTRY MAKES MONEY
Every business, even a “nonprofit” business, needs to earn a reasonable profit. A profit is necessary because the alternative is a loss; and if you lose money regularly, you will eventually go out of business. This fact applies whether the business is a lemonade stand selling cold drinks, a retailer peddling women’s clothes, a homeless shelter—a nonprofit—serving free meals every Friday night, or a big investment firm offering mutual funds and IRAs.
Every business also strives to make its products and/or services seem special, even unique, so that they stand out among the crowd and attract more customers than their competitors do. The financial industry has a challenge because their products (mutual funds, retirement packages, hedge funds, etc.) and services (investment advice, portfolio management, stock trading, etc.) don’t easily lend themselves to appearing distinctive, let alone unique. If a product/service is hard to distinguish from that of competitors, the business must wield other strategies to still sell more and earn a profit.
To do this, the financial industry uses a common strategy: price confusion. Price confusion means pretty much what you’d think: difficulty in determining what exactly the price is. Let’s say a case of paper is advertised in an e-mail promotion at the “low” price of $29.99. It sounds like a great deal, until you read the fine print and see that the real cost is $39.99, which you must pay now if you want your case of paper. The $10 difference comes only if you fill out the paperwork to get a special rebate. The business hopes to confuse customers around the price so that they’ll wind up spending $39.99 and not bother submitting the rebate form.
Price confusion also occurs when the price of a product—say, a printer—is truly low, but the costs of necessities to operate that product—ink cartridges—are high. Another example is when airlines get into price wars with one another. A low-priced airfare may initially make you happy—until you pay for expensive add-ons like a checked bag or meals during the flight. Wall Street and other financial industry firms engage in this form of price confusion, too, by charging fees to conduct their business. There are so many layers of fees and so many names for them—managerial, advisory, administration, custodial, commissions—that most people prefer to ignore their statements rather than decipher them. Another strategy is to make the price sound like much less than it is. That can be done by stating it as a small percentage of a much bigger number. If an investment advisor or manager charges you 1% of your investments, it sounds small, but your cost can add up to tens or even hundreds of thousands of dollars in a few years. The real cost, then, of financial products/services becomes confusing because these fees are usually hidden.
If you were the sellers of these investment products, and if you didn’t have to clearly explain each fee, would you make it perfectly clear to your customers how much they’re paying in total—especially when the amount is jaw-dropping when stated in ordinary dollars and cents?
The financial industry doesn’t stop at price confusion, however. Many businesses also engage in product confusion. If they can sell you a bicycle but let you think it’s a luxury limo, they can really jack up the price. Investors often can’t distinguish the price from the product, or even know what the exact “product,” let alone price, is. It’s as though a customer is saying, “I’m paying you something in fees to buy $X in returns.” If the return is negative (a loss), that figure represents another cost, on top of the fees. It’s confusing!
Greg Smith shares an example of a purposely confusing product in his book Why I Left Goldman Sachs: A Wall Street Story:
A Goldman quant [an investment analyst who uses a lot of math] came up with a sexy new black box with a very unsexy name. Call it Clorox.
Clorox was what is known as a “multi-asset-class momentum product,” a fancy term for “Give us your money and we’ll reallocate your funds based on historical models (taking a big markup on every reallocation).” This product was a bit like a jazzed-up version of basic portfolio management. It was like taking a baloney sandwich and offering it to a client as a Panino di Bologna. The first is worth fifty cents; the second, you can sell for eight dollars.2
Goldman could sell its “Clorox” product as a unique offering, something to distinguish the firm from its competitors and thereby attract more customers—and make greater profits.
This is why the financial industry makes so much money: not because its employees are brilliant at investing, but because the product—some form of investment (stocks, mutual funds, etc.) or advice—lends itself to spawning price and product confusion. What the financial industry is good at is increasing both product and price confusion by adding more, and more complicated, products, and keeping the total price hidden. They have succeeded in charging you the price of an artisan-crafted lunch for a baloney sandwich. That’s all.
Wall Street and the financial industry have mastered profit generation through price and product confusion to an extraordinary degree. The securities industry—that sector we’re focusing on in this book—had revenues in 2007 in the United States alone of almost $700 billion. Of that, asset management (primarily investment advice and portfolio management) was the largest component, $342 billion in 2007—well over four times the level in 1997.3 (It has grown further since 2007, but this is the most recent year for which we have reliable data.)
As a percentage of gross domestic product (GDP—the value of all types of products created in the United States), securities industry revenues grew more than tenfold from 1980 to 2007, from 0.24% in 1980 to 2.44% in 2007. According to Harvard researchers Greenwood and Scharfstein, this tenfold growth was due mostly to an increase in fees, specifically.
Clearly, galloping growth in the securities industry, particularly its investment advisory and investment management components (i.e., the topic of this book), has been a main reason that the financial industry as a whole has grown so large over the last 30 years. It is important to remember this fact as we proceed, and to consider the reasons for the growth.
JUSTIFYING THE MEANS—IF NOT THE ENDS
Remember the misconception that opened this chapter: that people in the financial industry know how to make money with money. Even if they did, does it follow that they can help you to make money, too, or that they will? No, it doesn’t. Nevertheless, people working on Wall Street and elsewhere in the financial industry often believe that they’re helping you make money, even when selling you something that is not so special in terms of either a good price or a distinctive product.
There are two reasons for this phenomenon. The first involves the “silo effect.” No single person or group in a large organization or network is wholly responsible for all the stages of a product—the way it is designed, priced, marketed, and actually comes out in practice. Different groups at a company may make these decisions separately, in their own department, or “silo.” To complicate things further, the silos seldom interact or communicate effectively with each other, so one doesn’t know what another is doing. This is the silo effect: One group makes a product they believe will help consumers, another group prices it, but no one typically looks at the larger picture and says, “If we price it this way, we’ve removed the value of the product—it’s no longer doing what it’s supposed to do.” Each decision might be thought to be in the customer’s interest, but nobody assesses the overall result to know for sure whether that winds up being true. It’s as if one team creates what they believe is a low-calorie granola bar; another team adds a lot of nuts, coconut, and chocolate; and no one notices that the bar is no longer doing what it was supposed to do. In the financial industry, there’s a long stretch between that quantitative analyst who concocted “Clorox,” for example, and the financial advisor selling that product—and a longer stretch, still, to positive returns on the investment for the customer. Each of these silos—creation, sales, and end value (returns)—operates independently of one another. It’s easy, therefore, for one group to carry on the self-delusion that they’re helping customers (and easy to absolve oneself of responsibility if things go wrong).
The second reason the financial industry believes they’re helping you is simply that when you do buy their product, they assume—not unreasonably—that you must want it. They’re engaging in a business transaction with you. When you agree to buy, they assume it’s what you want. Like any smart businesspeople interested in making money, they won’t exert themselves to point out these products’ weaknesses or to make it any clearer than they have to how much you’re really paying for them. It’s their job to market the products that will make handsome profits—to design something they can convince you to buy, to figure out how to charge you as much as they can without losing you as a client, and then to convince you to buy it. In practice, they might use innovative means to obscure how much you’re paying (i.e., price confusion).
People working in the financial industry can justify their means and comfort themselves if they need to, by assuming that you are also maximizing your profit in your own way. It’s not up to them to second-guess how you do it. Even if they believe it’s their job to serve their clients’ best interests, they may feel they can only gauge what those interests are by what the clients are willing to buy.
We’re compelled, and happy, to note that many in the financial industry don’t fit the mold we’ve just laid out. Many people are not overly greedy, will tell you the whole truth, and will recommend products and services that they believe are in the client’s best interests, even when it doesn’t maximize their own profits. These providers are to be admired and applauded. This praise applies to mutual fund firms that provide simple, ultra-low-cost investment products; to financial advisors who charge transparently by the hour, day, or task, such as creating a long-term financial plan, or as a very low percentage of investment assets; to financial journalists who have a healthy skepticism of what industry sources tell them and delve to get at the truth; and to academicians who bend over backward to be clear and transparent in their writing, and who either are genuinely mathematically rigorous or eschew mathematics when it’s simply unnecessary.
Because misinformation and deceptions are so endemic in the industry, however, it is difficult for investors to distinguish truths from falsehoods. This can often make it difficult for honest, ethical, and genuinely knowledgeable professionals to get through. We hope that the publication of this book will make it easier for those true professionals—the better elements in the financial industry—to get their message across.
In the final analysis, it’s not the job of people, good or bad, working in the financial industry to make you money. It’s your job. We hope that the Simplify Wall Street portfolio that results from following our 3 Simple Rules of Investing will help you do that job successfully.
THE SIMPLIFY WALL STREET PORTFOLIO
Simplicity is the ultimate sophistication.
—LEONARDO DA VINCI
Many investors, as we’ve noted, are perplexed by the array of possible investment vehicles and strategies, not to mention their costs. They would be justified to lower the number of alternatives merely to reduce the price and product confusion and make it easier to make a decision, even if in the process they missed some slightly better results. But in our case, the best alternative is as plain as the nose on your face. It’s the least costly, the easiest to implement, and the least risky for the benefit an investor can expect to get from it.
With this in mind, we’ve designed the Simplify Wall Street portfolio with just these five common investment products at its core:
![]() Government inflation-protected securities (in the United States, these are Treasury Inflation-Protected Securities, or TIPS)
Government inflation-protected securities (in the United States, these are Treasury Inflation-Protected Securities, or TIPS)
![]() A low-cost total U.S. domestic equity (stock) index fund, either a mutual fund or an exchange-traded fund (ETF—i.e., a sort of mutual fund that can be traded like stocks on an exchange)
A low-cost total U.S. domestic equity (stock) index fund, either a mutual fund or an exchange-traded fund (ETF—i.e., a sort of mutual fund that can be traded like stocks on an exchange)
![]() A low-cost total international equity index fund, either a mutual fund or an ETF
A low-cost total international equity index fund, either a mutual fund or an ETF
![]() Single-premium income annuities
Single-premium income annuities
![]() Low-cost term life insurance
Low-cost term life insurance
In Rule #1, “Simplify Your Options,” we’ll delve into these items in greater detail and add a few more alternatives, too, but still the whole portfolio contains only 10 possible investment products.
A Portfolio for Everyone
Besides its modest number of investment vehicles and the easy-to-understand advantages of each, the Simplify Wall Street portfolio is also appealing because it works for all types of investors, no matter what their experience, knowledge base, or financial circumstances. We divide investors into four general categories:
1. Superrich individuals with multigenerational wealth and institutional investors (investors who are managing huge assets that represent, e.g., a corporation’s or state government’s retirement fund for its employees or an endowment at a university).
2. Reasonably well-off people
3. People who are getting by
4. Struggling individuals (the working poor)
The main difference between category 1—the multigenerational or institutional investor—and categories 2-4 is that the latter categories have a life cycle. That is, their investments will accumulate for a period and then wind down as the individuals doing the investing grow older and start making withdrawals. By contrast, institutional funds—such as pension, endowment, and foundation funds—usually don’t have an end point—there is no life cycle. Similarly, ultrawealthy people and families usually don’t need a spend-down plan, either. They need cash flow, as institutional investors do, but they also need estate planning—specific counsel on how to preserve and pass on their wealth to future generations. Most people assume that category 1 investors, the superrich and institutional investors, are different from ordinary investors, but they can be seduced by the 7 Deadly Temptations and fall prey to investment frauds as much as everybody else. Many investors in this category were fooled by Bernie Madoff’s fraudulent investing schemes, after all, and by the subprime mortgage securities that collapsed in the financial crisis in 2008. The frauds may have a more polished appearance or sales pitch and better connections, but studies show that these investors waste many billions of dollars paying for worthless investment advice and management.4
Reasonably well-off investors, our second category, aren’t rich. They must set aside money to invest in order to make withdrawals when they need the money later, to pay for their children’s college expenses and to finance their retirement. They therefore want to get the most out of their investments but also create a comfortable and secure safety net, in case investments go very badly.
Many individuals are in the third “getting by” category. These investors can barely invest enough to fund their retirement. We’ll have good news and bad news for them. The good news is that they do have a good chance of building a retirement account. The bad news is that they won’t also be able to afford a secure safety net. So, in the unlikely but possible event that their investments don’t succeed, getting-by investors will be either living well below their expectations or working longer than they had hoped.
Struggling investors are faring even worse than those in category 3: they’re hardly getting by at all and can’t afford to invest. Unfortunately, this category includes the vast majority of people on Earth, including most people in the United States. Struggling investors are living paycheck to paycheck. This vulnerable group is frequently preyed upon by predators like payday lenders who take advantage of their instability. They will have to work and save as much as they can, though many will have no opportunity at all to save or invest. For those few who can save some money, there are (in the United States) federal, state, and local programs that offer very generous incentives to jump-start their savings (see the box).
THE TERMINOLOGY AND CONTEXT FOR OUR PORTFOLIO
Before we move on to the 3 Simple Rules, let’s define a few words and numbers, and offer some historical context, so that you understand the Simplify Wall Street portfolio even better.
Rates of Return on Investment
How much your investments gain or lose is measured as a “rate of return on investment,” or simply “return.” This figure is the percentage by which your investments grow every year, on average. For example, suppose you invest $100. A year later you have $105. Your rate of return was 5%.
“Nominal” dollars means to economists the dollars you see in your billfold. These dollars don’t change over time. “Real” dollars means something different to them—it means what you can buy with those dollars. That changes because of inflation. Similarly, the rate of return can be a “real” rate or a “nominal” rate. A nominal rate is the percentage rate of growth in nominal dollars. If you invest $100 and have $105 a year later, your nominal return was 5%. The real rate is the rate of growth in purchasing power—in other words, the nominal rate adjusted for inflation. For example, let’s say inflation will be 2% for the next 23 years. If your nominal rate of return is 5%, then your $1 will grow to $3 in 23 years. But if you think you can buy three burgers with that $3 in 23 years that are now priced at $1 each, think again. For the real, inflation-adjusted rate of return, we’ll need to deduct that 2% for inflation from your 5% nominal return, so the real rate of return is 3%. So, your dollar will grow to a purchasing power of only $2, and you’ll be able to eat only two burgers.
Let’s now look at what the returns are likely to be in the future. Table 1a summarizes the expectations for long-term bonds and inflation, and Table 1b summarizes the expectations for equities (equities means stocks).
TABLE 1A U.S. Treasury and Corporate Bond Expected Returns and Expected Inflation September 2013
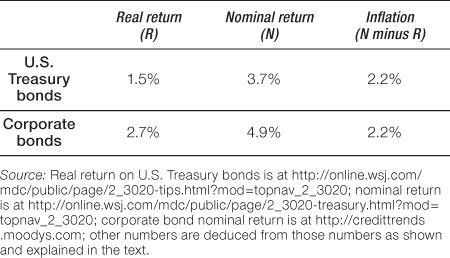
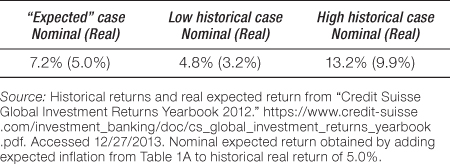
TABLE 1B Global Equities Expected long-Term Annual Returns and high and LOW Scenarios
We’ll explain how we got these numbers, but first we have to ask you to do something no one likes to do: reel in your expectations.
What History Tells Us
An endless number of investment gurus peddle unrealistic claims and aspirations. Unfortunately, these statements are not true—except in the same sense that someone actually does win the lottery. But people would like them to be true. It’s one of the reasons the financial industry serves up so many shaded truths and near-lies: because they can raise clients’ hopes and spirits.
A challenge today is that for almost two decades—in the 1980s and 1990s—the real return on investment in stocks was unusually high. It averaged more than 16% a year from August 1982 until the end of 1999.7 In the last five years of the 1990s, it averaged 25.5%. This figure is still vivid in the memories of people who will soon retire or are already retired. At that time, they came to expect such high returns.
These very high rates of return were in part a correction for the poor returns over the prior 10-year period. In 1982, at the end of that dismal time frame, the consensus outlook was bleak. Stocks’ prices were so low that they implied that future corporate earnings growth rates would be negative. But this expectation turned out to be completely wrong. Partly due to correcting that very negative expectation, the price of stocks subsequently soared in the 1980s and 1990s. These high expectations nourished an overcorrection of the negative view of 1982—a bubble. (This overcorrection was partly compensated for by the poor returns of the first decade of the 2000s.) But this booming stock market led the generation who lived through it around 20 years ago to think that 15% to 25% real annual rates of return on stocks were to be expected. Many of them still think that, even though it’s wrong.
The best estimates of future expected rates of return come from information that is specified exactly by contract. Such precisely specified contracts, unfortunately, apply only to fixed-income investments, such as bonds. For example, the contract could say that the price of the bond is $1,000, and it will pay $40 a year in interest until maturity, when the $1,000 principal will be returned. Hence, the expected rate of return is 4%. (This number is also called the bond’s “yield to maturity,” or simply its “yield.”)
Expected Rates of Return on Bonds
The issuer of a bond—usually a corporation or government—guarantees you a specified stream of payments every six months (the bond’s interest or “coupon”) until the bond matures. When the bond matures, you’ll get approximately what you originally paid for it back—the principal (unless, of course, the bond issuer defaults—that is, can’t make the payments). The bond’s yield to maturity is the return you get from now until it matures, if all the payments are made. We know what that rate is, because it can be calculated with certainty.
Let’s start with the safest, least risky investment you can possibly make, U.S. Treasury Inflation-Protected Securities—TIPS. (We’ll be saying much more about these later in the book.) At the time of this writing, 30-year TIPS (TIPS maturing in 30 years) yielded about 1.5%.8 This is a real—that is, inflation-adjusted—rate of return because the TIPS’ principal value increases annually for inflation.
The nominal Treasury rate of return is the yield on a non-inflation-protected U.S. Treasury bond. At the time of this writing, the yield on a 30-year Treasury bond is about 3.7%. This is a nominal return because the bond’s principal does not increase with inflation.
We can infer from the 3.7% nominal return on Treasury bonds and the 1.5% real return on TIPS that their difference, 2.2%, is what the issuers of the bonds and the investors who buy them expect inflation to be over the next 30 years. Of course, this doesn’t mean that’s what inflation will be; it’s just their best guess right now.
Both TIPS and U.S. Treasury bonds are guaranteed by the U.S. government. That makes them extremely low-risk. Indeed, financial academics refer to them as “risk-free.” With a little more risk, you could invest in a diversified basket of U.S. domestic corporate bonds. At the time of this writing, the yields on long-term corporate bonds average about 4.9%.9 Hence, the “risk premium” for investing in riskier corporate bonds instead of U.S. government bonds is about 1.2% (the corporate bond yield of 4.9% less the Treasury bond rate of 3.7%).
And remember, those yields of 3.7% for 30-year Treasury bonds and 4.9% for long-term corporate bonds are nominal returns. If we assume 2.2% inflation, then the real rate of return on Treasury bonds is expected to be 1.5%, just like TIPS. The real return on corporate bonds is expected to be 2.7%. These numbers round off the entries in Table 1a.
Expected Rates of Return on Stocks
Stocks (also called equities) are more risky than bonds for two reasons. First, there’s no contract with stocks, as there is with bonds, saying that the investor will receive any specific series of payments. Second, if the institution that issued the bond goes bankrupt, it must pay bondholders before stock owners get anything.
Because stocks are riskier than bonds, an investor will require a higher expected return to invest in stocks. The difference between the expected return on stocks and the expected return on bonds is often called the “equity risk premium.” The amount of the equity risk premium can be estimated (a better term might be “guessed at”) in various ways.10 The historical average has been about 4% to 4.5%.
The return on stocks varies quite a lot from year to year, as anyone who has invested in them knows. However, their long-term average annual returns do not vary as much when measured over long time periods such as 30 or 35 years. As we’ll see, this is the time period for which an individual’s average retirement dollar is typically invested.
Three professors from the London Business School studied the past performance of stocks in 19 developed countries.11 The countries included most of the major nations of Western Europe and Northern Europe (i.e., Scandinavia) plus the United States, Canada, Australia, Japan, New Zealand, and South Africa. The results of the study showed that from 1900 to 2011, stocks of these 19 countries offered average real returns from 2% to 7% a year—Italy lowest with about 2%; Australia highest with about 7%; Germany and France about 3%; Switzerland and Norway about 4%; the United Kingdom and Finland about 5%; and the United States, Sweden, Canada, and New Zealand about 6%.12
These are the kinds of real returns that are realistic—moderate single-digit returns, not whopping double-digit ones. Occasionally higher or lower returns occur for a while, sometimes for a long time, but they’re not what you should expect. If you’re lucky and you’re invested in stocks, you’ll get them. But you can’t expect them, and you can’t plan on them.
The future is never predictable, but one must sometimes use numbers for planning. For those purposes, the real rates of return from 1900 to 2011 that we just cited are the best guide we have. Those real rates ranged from 2% to 7%, with a country-weighted average—a global stock return—of 5.0%.13 (The nominal country-weighted average return over the same years was 8.3%.) For our discussion in later chapters of this book, we’ll use this long-term historical global average of 5.0% as our expected real rate of return on stocks. We won’t, however, use 8.3%—the historical rate—as the expected nominal return. In addition, we inferred earlier that investors anticipate 2.2% inflation in the next 30 years. Hence, our assumed nominal return on equities will be 7.2%—the real return of 5.0% plus 2.2% inflation.
But those are all only the expected returns, the ones we deem most likely. A whole range of other returns are possible. We’ll want to estimate how much worse or better it could get. If we consider single years, it can get much, much better—or much, much worse. The highest single-year real returns on stocks in the United States were more than +53%, which occurred in 1933 and 1954. The worst were losses of nearly 37.5%, which occurred in 1931, 1937, and 2008.
But if we look at a long time period, the variation is far less. The worst three-decade real return was +3.4%, and the worst nominal return was +4.8%. Those were in the early part of the twentieth century, from 1910 to 1940. After 1925, the worst real return was 4.5%, and the worst nominal return was 7.7%. The best 30-year returns were quite good: the best real return was 9.9%, and the best nominal return was 13.2%.
We’ll use these best and worst 30-year returns (see Table 1b) as our guesstimates of the best and the worst that could happen over 30 years. It is true that there is no guarantee whatsoever that worse (or better) could not happen, even a negative global return. As investment writer William Bernstein has said, “A long-term negative global stock return requires not merely universal inflation, but universal Armageddon.” In that event, no investment would be safe.
ONE SMALL STEP FOR THE INVESTOR, ONE GIANT LEAP FOR SOCIETY?
Given that so many on Wall Street and in the mainstream securities industry earn their gargantuan incomes thanks to the fact that you pay much more than you realize for a product that you don’t understand, how will they react when we show you how to pay 1/20 or 1/40 as much for something just as good or better—and perhaps not even to them? Well, we’d expect them to fight this advice tooth and nail. They’ll create every argument they can think up why we’re wrong. Their standard rebuttals to sales objections already try to dispute a few of our claims, and they’ll intensify their counterarguments. They have become comfortable because their customers (or their “muppets,” as Greg Smith says some of his Goldman Sachs colleagues called their clients) so far have shown few signs of truly realizing that they’ve been paying a lot for really very little.
The damage is greater than that, however. Investment strategies and vehicles created in the belief that they will spread out risk and increase returns actually create more risk not just for the individual investor but for the entire financial system. If hundreds of thousands of people around the world purchase shaky investment products that eventually blow up, the financial systems in those investors’ countries can collapse in the explosion. The dramatic economic downturn of 2007-2009 in the United States, for example, was in part due to investment products that were nothing more than bundles of poorly qualified (so-called subprime) mortgages, repackaged and sold as promising investments.
The sorts of investment products we’ve described from Wall Street and the financial industry can also concentrate power and increase economic inequality. A minuscule percentage of the population is getting both phenomenally rich and unduly powerful, in large part because the rest of the population has been seduced into paying extraordinary fees for something that they believe they need—investment products, advice, and management—but that is, in its higher-priced forms, nearly worthless. Funds thus continue to flow to ultrawealthy captains of finance from far less wealthy investors by means of opaque, complex-sounding, well-marketed, and confusingly priced investment products and services. This cycle does nothing but exacerbate economic imbalances, intensifying economic hardship for those who pay, while entrenching a financial elite that is not only too powerful but increasingly removed from and uncomprehending of the lives of the rest of society.