MISTAKE #3
Misunderstanding Performance and Financial Information
Many myths persist in the investment management field; a few because of investors' biases, some because they make for cute stories in the media, and many because professionals encourage and perpetuate them. In this chapter, we will take a look at some of the most common misperceptions.
Misunderstanding #1—Judging Performance in a Vacuum
A friend shared with me the performance of a money manager they were considering. The manager was essentially saying, “Hey, look at how awesomely this portfolio has performed; put your money in this!” While this may literally be the single worst way to decide on investments, this is how most Americans choose their portfolio.
So what's the problem? The problem is a function of misunderstanding “reference sets.” Reference sets can best be explained this way: Assume you have a room full of 12,000 people and tell them to each flip a coin. If you repeat this about 13 times, someone will likely have flipped heads every time. We should not marvel at the brilliance of such a person. Instead, we should expect this outcome.
Similarly, if we visit a Las Vegas casino and find someone winning at roulette, we don't hand them all of our money. We know this is one gambler in a reference set full of gamblers and that most of them are losing. In his book, The Black Swan, Nassim Taleb calls this “the reference point argument,” which he describes as not computing odds from the vantage point of a winning gambler, but from that of all the gamblers who started at the same time (Taleb 2007). We know that some people give their money to the “hot hand” gambler to bet for them. These people are shortsighted and exhibit the same behavior as an investor giving their money to the latest fund manager on a winning streak.
It is also how most money managers market their success stories. For example, it is not uncommon for a money manager to manage 6 to 10 portfolios or funds. Not surprisingly, one or two of these are likely to outperform their benchmark. Slick glossies and PowerPoint presentations are then made to tout the performance, completely ignoring the majority of portfolios or funds that did not meet or beat their benchmark. Then investors buy in; the fund eventually underperforms, so the manager then touts another portfolio, and the investor moves to the next hot hand … and so on.
Mutual fund companies use the same strategy. As with all decades, from 2000 to 2010, most large company mutual fund managers underperformed the S&P 500. That is quite a spectacular feat considering the S&P 500 itself was barely positive over the decade (assuming dividends are included). You would never know it when looking at the advertisements from mutual fund companies, though!
Whenever a money manager who is trading stocks in one market tries to sell you on their performance, ask them for the performance of all of their strategies. The full reference set will expose the outperformance of one or two strategies as what they really are: one of many expected outcomes. Of the vast reference set of mutual funds and hedge funds, the overwhelming majority underperform, and there is no evidence the winners will continue to win.
This is why you should always ignore a particular investment manager's past performance and question what type of money manager would choose to market himself that way in the first place. Suppose you are working with an advisor who considers your personal situation—taxes, state of residence, outside holdings, etc. In that case, the portfolio should be customized to the point that they cannot show past model performance anyway.
A trader's past performance in any given market has little or no bearing on their expected future performance. Under most circumstances, the key to understanding why a manager has outperformed over a period of time is to look at the entire field. For example, the few professional traders who were able to beat the S&P 500 over a given 10-year period should not be viewed as the active managers to hire going forward. Instead, they should be seen as a great example of a field full of carnage, one that an intelligent investor should avoid altogether.
Misunderstanding #2—Believing the Financial Media Exists to Help You Make Smart Decisions (a.k.a. the Media Is Killing You)1
Do you know what investing for the long run but listening to market news every day is like? It's like a man walking up a big hill with a yo-yo and keeping his eyes fixed on the yo-yo instead of the hill.
—Alan Abelson
It seems that no matter which direction the market is heading, there is always a chorus of vocal fatalists that dominate the financial media.
Of course, this is nothing new. Financial media have been selling fear dating back to the 1907 crash. Many books have been written citing how incorrect the financial media have been about its more recent predictions, such as the 1970s stagflation, the 1987 crash, the tech bubble (which took hysteria to an entirely new level since it accompanied the rise of 24-hour televised financial news), 9/11, the 2008 crisis, and the European debt crisis.
Yet every bear market has given way to a bull market, and every economic contraction has given way to economic expansion. One would think that the financial media would be reassuring during a time of crisis, especially since there is one about every three to five years. So, why is that not the case?
During any crisis (debt ceiling crisis, fiscal cliff, European debt, whatever), many pundits will encourage viewers to go to cash, and many money managers will do just that, all with the purpose of “protecting” assets. Those who follow their advice often permanently miss the gains that occur as the crisis subsides.
The main issue with financial media is that many who consume it fail to understand the purpose of its existence. Media is business, and businesses exist to make a profit. The primary purpose of CNBC, FOX Business News, CNN, and your local radio station is not to inform; it is to make money. They exist, quite simply, to make a profit.
The profit is made by selling advertisements. The ads are sold at higher prices on shows and stations with higher ratings. Therefore, the primary purpose of any financial show is to get as many viewers as possible (they call them “eyeballs”) and to get those viewers to watch for as long as possible.
The rough math is:

To get viewers, shows often overdramatize and draw out events. Many events are packaged into stories with a tag line, storyline, and story arch. Often, it is accompanied by what screenwriters call “putting a clock on it.”2 Just as a movie will create tension and a sense of urgency with a ticking clock (“If Sandra Bullock doesn't get to the space station in 90 minutes, she will get hit by space junk and die!”),3 the financial media matches many of these stories with a clock in the lower right-hand corner of the screen. Tick, tick, tick. Just think of the “The Sequester,” “The Fiscal Cliff,” and so on. For a recent example, recall the clock winding down, by the minute (really, we need by the minute?) to the Debt Ceiling limit. To further tie viewers to the set, producers and hosts will often press guests for short-term market calls. These tactics often cause viewers to panic and make mistakes.
How many retirement plans were messed up when some viewers went to cash during the fiscal crisis, the government shutdown, the debt ceiling talks, or the coronavirus-fueled market meltdown? In their study titled “Financial News and Client Stress,” Dr. John Grable of Kansas State University and Dr. Sonya Britt of the University of Georgia found that an individual's stress level increases substantially while viewing financial news, regardless of what the financial news is about (Grable and Britt 2012). When the market is going down, people are worried about their accounts, and when the market is going up, people are upset they are not more aggressively positioned!
The study found that 67 percent of people watching financial news on CNBC, Bloomberg, Fox Business, and CNN showed increased stress levels. Even when the financial news was positive, 75 percent exhibited signs of increased stress (Grable and Britt 2012).
Physicians often tell their patients to control their stress levels because stress and anxiety greatly increase the probability of sickness, disease, and even death.4
Not to mention that it is simply not fun to be stressed out. From a financial perspective, there is another side effect of stress that can cause immediate damage: People tend to make poorer decisions when under stress. The classic example is the investor who watches a lot of financial news and reacts in a panic, creating permanent losses in their portfolio.
In my experience, I have noticed that those who are too busy to watch the financial media closely rarely make mistakes. On the other hand, it is not uncommon for a retiree who watches a lot of financial news to make a significant trading decision with negative consequences.
No one is saying the media creates a crisis.5 I am merely saying the media is not motivated to educate and reassure the viewer because that would reduce viewership. It is likely not a coincidence that one of the most interviewed economists on CNBC is the persistently ominous Nouriel Roubini. You may recall his nickname, Dr. Doom.
It is not unlike The Weather Channel, which has its regular viewers. However, nothing stirs up viewership like a hurricane or tornado. The meteorologist can hardly contain his glee, knowing ratings are very high. Unlike a hurricane, which leaves even the prepared with permanent damage on occasion, every bear market storm has passed, leaving the well-positioned and reasoned investor 100 percent intact.
This is not to say all media is bad (it is not), that all news is full of hyperbole (some is not), or that everyone who watches financial news, even lots of it, gets stressed out (just most of them). It does mean, though, that if you are watching a lot of financial news, you should take a moment to ask yourself what you are getting out of it and how it makes you feel.
More importantly, if the stress gets to you, do not let it impact your decision-making or keep you from following your strategy. The key to having a successful, repeatable investment strategy is to stay disciplined, and a core component of staying disciplined is to recognize and shut out the noise.
Misunderstanding #3—Believing That the Market Cares About Today
Although it's easy to forget sometimes, a share is not a lottery ticket … it's part ownership of a business.
—Peter Lynch
If a business does well, the stock eventually follows.
—Warren Buffett
People often ask the question: What makes the stock market move up or down? Some are confident that they know the answer, but they are almost always wrong.
People will often cite one of the following as being the primary driver of stock prices: unemployment, housing, economic policy, monetary policy, the strength of the dollar, consumer confidence, retail sales, and interest rates. All are popular choices. In order, the answer to each of these is no, no, no, still no, no, no again, no, and another final no.
The stock market cares about only one thing above all else: anticipated earnings. If companies make more money, their share prices eventually rise. The stock price is simply a reflection of a company's earning power. Everything else is noise.
Assume for a moment that you are going to buy a sandwich shop. What do you care about? The only factor you care about is anticipated earnings. If you buy the sandwich shop, you are doing so because you believe the profits earned will justify the purchase price with a good return.
To arrive at this conclusion, though, you will look at other factors that will affect your ability to make money owning this sandwich shop. For example, if interest rates are low, you will make lower payments on your loan, thus making the shop more profitable. In this case, interest rates only matter because they affect your anticipated earnings. Commodity prices will also likely matter, as oil and food are commodities. If oil prices go up, it will cost more to have the food delivered to your shop every day. Rising food costs increase your expenses as well. Both increases in commodity prices eat away at your bottom line, thus hurting anticipated earnings. Consumer confidence matters because if consumers think their financial world is collapsing, they will forgo your $8 sandwich and make the kids a PB&J at home. That will drive down sales, which would impact your earnings. You get the idea.
Note, however, the critical word here is “anticipated.” No one cares about yesterday's earnings. For example, let's go back to that sandwich shop you want to buy. You are talking to the owner, reviewing his financials, and you can see he made $100,000 each of the last three years, selling about 20,000 sandwiches a year. It sounds pretty stable, so you are thinking about offering him $200,000 for his business, knowing that you can make $100,000 per year once you pay off the debt it takes to buy it. But you are too smart for that. You notice that he sells 5,000 of his sandwiches each year to a large corporate client. That client just went out of business. If you back those sales out, the sandwich shop would be much less profitable, so you would no longer offer the same price. You are focused on the only thing that matters: anticipated earnings.
The bottom line is this: All of the other factors in the economy matter only because people buying and selling stocks are trying to determine how the changes in various “indicators”—like unemployment, interest rates, etc.—will ultimately affect a company's anticipated earnings. No one cares how much health care companies made in the past.
They want to know how the new healthcare reform laws will impact these companies' future earnings. No one cares if Starbucks made a million or a billion last year. They want to know if their earnings will be hurt now that McDonald's is selling gourmet coffee. No one cares how much money General Dynamics made selling military supplies to the government in the past. They want to know if military conflicts will persist, driving up future sales.
That is why when the U.S. bear market was in full swing, investors bought Walmart stock. The thought was that Walmart's earnings would likely go up as consumers moved “downstream” to buy everything as inexpensively as possible. The same reasoning drove Nordstrom's stock price down. McDonald's did fine as investors figured consumers would want to eat out on the cheap. The same logic drove down the stock price of higher-end restaurants like the Cheesecake Factory. Of course, companies selling alcohol did fine as people tend to drink when they are depressed (and when they are happy, which is why alcohol is considered “recession proof”).
The stock market as a whole tends to move up well before a recession is over. It does not care what is going on today. It is anticipating the earnings of companies in the future. If the stock market drops, it is because investors believe future earnings will get worse. If the market moves up, it is because investors believe the economic climate is changing to enable companies to become more profitable in the future.
Of course, so many variables go into guessing anticipated earnings that the market is not always right in the very short term (even though it is always right in the long run). For example, you can buy the perfect sandwich store in perfect condition and then have a multitude of surprises derail your profits, like a crime in the area, unforeseen road construction blocking access to your shop, and so on. Likewise, we can have a nearly perfect economic environment, and someone can fly a plane into a building and turn everything upside down overnight.
However, unlike your sandwich store, which can go to zero, the stock market itself is resilient. Every time in history, no matter how bad things have appeared, U.S. companies as a whole have ultimately found a way to not only make money, but to make more money than they did before. Every single time. And, as always, the stock market will continue to follow the earnings.
Misunderstanding #4—Believing an All-Time High Means the Market is Due for a Pullback
Stock Market Hits All-Time High. Now What?
I think the market is a little frothy, and I have cashed out all my positions.
—Steve Grasso, Director of Institutional Trading at Stuart Frankel, in the same article
Don't get scared because of an “all-time high.”
Whenever the market breaks through to a new high, there is talk of a bubble. Every time any market moves into new territory, the talk of a correction or bear market gets more and more incessant. You can count on it. Watching and reading the coverage regarding the Dow passing any landmark can make one's head spin.
One point of view is that once the Dow passes a “barrier,” the average investor will jump back into the market, and professional traders who have been sitting the market out will have to get back in, both driving the stock market much higher.
The more common slant is that the Dow, having plowed through a new threshold, is ripe for a pullback. The market, they argue, has come too far, too fast. Both crowds don't understand that Dow 18,000, 20,000, 25,000, and 30,000 are just numbers, and for the most part, mean nothing. The latter crowd is also primarily comprised of the “investors” who sat in cash while contemplating the pullback that would accompany the previous Dow threshold breakthrough.
First, simply because a market is at a new high does not automatically qualify it as a “bubble.” A bubble is when an asset class trades at a level far beyond its intrinsic value. In the not so distant past, we have watched a few bubbles burst. One was the tech bubble, when technology stocks were trading approximately five times higher than their historical valuation level. Another was real estate, which was trading at more than 50 percent above its historical valuation level when it finally burst.
So, to determine if the U.S. stock market is a bubble, we need to understand how stocks are valued in the first place. As with all asset classes, there are many ways to value stocks. However, the most referenced calculation is the P/E ratio. The P/E ratio is calculated by taking the stock price and dividing it by the company's earnings. For example, if a stock is at $100 per share, and the earnings are $5 per share, then the P/E ratio is 20. Stock prices can go up and the market can keep hitting new highs but remain fairly valued.
To illustrate this concept, let's step into the real estate market for a moment. Let's say that the typical residential real estate investment yields an investor 10 percent. An investor searches the market and finds a duplex to buy for $100,000. The investor rents out the duplex, and after paying the cost of taxes, maintenance, and insurance, makes an annual profit of $10,000. The investor is making 10 percent and is quite happy.
A few years go by, and the economy has recovered a bit. Renters can afford to pay more, so the investor charges more rent, and his annual profit is now $15,000.
A new investor comes along and wants to buy a property to earn the typical residential real estate return of 10 percent. The new investor pays the previous owner $150,000 for his duplex as the profits are now $15,000, which will net him 10 percent.
The value of the duplex went from $100,000 to $150,000 because the earnings went up. Although the price is up 50 percent, the expected return is still the same. However, if the duplex had gone up in value from $100,000 to $150,000, with the profit staying at $10,000, we would have a “bubble,” meaning the investment price is much higher than the historical average. Bubbles tend to end badly. They always eventually burst. A bubble is not defined by rising prices alone; rather, a bubble is defined by rising prices relative to earnings.
The stock market does not sort of work like this; it works exactly like this.
The stock market exemplified this concept during its ride from the S&P 500 at 1,100 to the S&P 500 at 3,200. When the S&P was at 1,100, the market was trading at 20.7 times earnings. When it was at 3,200, the market was trading at 19.6 times earnings. In other words, by this measure, the market was a better value at 3,200 than it was at 1,100. Even though the market's annualized growth during this time frame was over 12.5%, it was outpaced by the growth of corporate earnings over the same period.
It is also important to remember that it does not matter how high a stock price goes; instead, it is how high it goes relative to its earnings. A company making $10 million per year with a share price of $100 may one day go on to make $15 million per year, at which point no one should be surprised if the stock trades at $150.
Finally, of note is that the market hits all-time highs all the time, more often than once a month on average. Basic inflation is responsible for a portion of the gains. As I type this, I am drinking a Diet Coke, currently selling at an all-time high. I wish I could eat a candy bar as well. They are also selling at all-time highs. If you purchased this book7 through the mail, it would have been mailed with stamps that are also priced at an all-time high. Almost everything is at an all-time high most of the time, whether it is a meal at McDonald's, a car, or the cost to build a house. When you buy your turkey for the holidays, it will likely not be selling at an all-time low. The same goes for your new car, a new shirt, or new jewelry.
The Dow flirting with thresholds is psychological; ultimately, it means nothing. Market prices, like all investments, follow earnings. And for the long-term investor, that is all that matters. The next time you read that the market has hit an “all-time high,” shrug and smile. It's no reason to panic.
Misunderstanding #5—Believing Correlation Equals Causation
A black cat crossing your path sometimes signifies an animal is going somewhere.
—Groucho Marx
Just because something happens often, or appears to maintain a pattern, does not mean that there is an actual cause and effect taking place. Scientists, doctors, and statisticians learn in introductory classes that “correlation does not mean causation.”
For example, there is a predictive measure known as the “Super Bowl Indicator.” The stock market tends to do well when the NFC wins and mediocre when the AFC wins. This indicator has been about 80 percent accurate. Nevertheless, its value going forward as an indicator is 0 percent. There is also a predictive measure known as the “Sports Illustrated Swimsuit Edition Indicator.” When the cover model is American, U.S. stocks tend to perform better than their historical average. When the cover model is not American, U.S. stocks tend to perform worse than their historical average. While this has resulted in quite remarkable results with a more than 6 percent per year difference in returns, this indicator's value is, of course, worthless as well.8
While we can have fun with this sort of stuff, no one takes it seriously. Or do they? Let's look at a few popular recurring stories.
October Is The Worst Month to Invest
October: This is one of the peculiarly dangerous months to speculate in stocks. The others are July, January, September, April, November, May, March, June, December, August, and February.
—Mark Twain
In late September, I met with a prospective client who wanted to wait to invest his account until November because of articles he had read about how poorly stocks perform in October.
Almost every month, the financial media release stories about the historical trends of a particular month. A 2012 CNN article went over all the terrible things that have happened in the market during October (Voigt 2011).
These articles reiterate a perception that there are “good times” and “bad times” to be invested and that some easy rules of thumb—such as not investing in the market in October—can be followed to achieve better returns.
Unfortunately, it is just not that easy. These articles are classic examples of the media giving investors data that makes them less knowledgeable about investing than before reading the information.
Even if the October pattern were relevant, it sure does not hold much water. Articles on why not to invest in October state that the pattern looks quite reliable if you leave out specific periods. It is like saying that the Denver Broncos have the best Super Bowl winning percentage if you exclude their five title game losses, or that Republicans have won every modern presidential election if you leave out the Obama, Clinton, Carter, and Biden administrations. You cannot just leave out entire pieces of a data set as if they are irrelevant exceptions!
Sell in May and Go Away
Market timing does not work, at least not using Sell in May and Go Away. As with most market-timing strategies, a little bit of analysis often reveals the devil in the details.
—Rick Ferri, Forbes (2013)
The “Sell in May and Go Away” theory holds that investors should sell their stocks at the beginning of May and re-enter the market at the beginning of November. This theory is promoted on the idea that the market has historically performed better during the November through April six-month period than the May through October six-month period. It is true that historically the stock market, at first glance, has had a better return during the November through April time period. But does this correlation imply causation? Many people believe it is real and persistent, arguing that traders take the summer months off. Another theory posits that investors receive much of their money at year-end or the beginning of the year and invest it. For our purposes, let's assume that yes, we believe that this anomaly will persist.
A recent study by CXO Advisory Group looked back at a 142-year period of the market ending in 2012 (CXO 2013). The return of a simple buy-and-hold strategy dramatically outperformed the “Sell in May” strategy. The gap is much higher when portfolio friction, the impact of costs, are included. One major factor? The “Sell in May and Go Away” proponents seem to ignore dividends9 when comparing Treasuries' returns during the “Go Away” period to the total returns of stocks. Because stocks do pay dividends, even in the worst of times, they must be included in a fair analysis of the strategy. As is often the case, even the most cursory examination of a market “rule of thumb” will often disprove or greatly diminish its actual probability of success.
Misunderstanding #6—Believing Financial News Is Actionable
Stupid is as stupid does.
—Forrest Gump
The overwhelming majority of financial news is just noise. Part of being a successful investor is filtering out the noise as much as possible. A great example of this is how financial media will create, often out of thin air, an explanation for minor market movements.
For example, if the Dow is at 26,000 and closes the day up 100 points, it may sound like a decent-sized move, but it's not. It is a move of just .004 or a little more of one-third of 1 percent. This sort of move is usual, expected, and occurs because nothing substantive has happened. Nonetheless, the financial media needs to report on the day and will create a headline to explain the change. They will select from any of the day's announcements and backfill a headline. For example, a headline might read “Stocks Up on Housing Report” or “Stocks Up on Middle East Talks.” If the move is just 100 points, there is actually no explanation needed.
Let's say you run a chain of sandwich shops, and you sell an average of 26,000 sandwiches per day. Now, let's say that today you sold 26,100. Is there a reason? Are you going to examine all the things you did right today to sell 100 more sandwiches, or do you consider it perfectly normal variance? If, instead, you sell 25,900 sandwiches, are you going to look for the reasons why? Perhaps someone should be fired? Maybe you should remodel the stores? Of course not, because selling 100 sandwiches more or less on any given day is perfectly normal. In fact, selling 200 sandwiches more or less on any given day is also perfectly normal and would not cause you to blink, even for a moment.
Now, if you sell a thousand (more or less) sandwiches, perhaps something else is going on that merits investigation. It's the same with the stock market. The reality is that most market movements require no explanation. They just happen. The market doesn't close precisely where it opened very often, just like a chain of sandwich shops that sells an average of 26,000 sandwiches a day rarely actually sells that many on any given day. It's almost always more or less.
Just for fun, read the headlines on your favorite financial media site at the end of the day, and watch how they will often backfill a headline to explain statistically insignificant moves in the market. They have no choice. Can you imagine logging on to see CNBC and reading the headline “Nothing Big Happened Today; Check Back Tomorrow”?
Misunderstanding #7—Believing Republicans Are Better for the Market Than Democrats
The common viewpoint is that Republicans are good for … the economy. Meanwhile, the common view of Democrat policies is that they … are economy killers. Well, for those who feel this way, it may be time to review … economic history.
—Adam Hartung, Forbes (2012)
Most investors equate a Democratic victory as synonymous with a stock market downturn. History tells quite a different story. The markets are about as politically neutral as can be, with the broad market index up an average of 49% during Republican administrations versus an average of 46% during Democrat administrations. Even Congressional control by one party or the other doesn't significantly skew the results, as seen in the chart below:

There are two main theories for this traditionally unexpected result. The first theory is that investors expect radical changes from Democratic presidents, including significantly higher taxes on income and investments, corporate taxes, and an environment generally less friendly toward corporations. The same theory holds that investors expect tax cuts, spending cuts, and fiscal restraint from Republican presidents. The stock market adjusts in advance of the expected outcome of the election. When a Democrat replaces a Republican, the market often adjusts upward when it realizes that the new president may be friendlier than originally expected toward corporations and high-income taxpayers. Likewise, the market often adjusts downward when it realizes that the new Republican president may not cut spending as expected. Proponents of this theory typically cite two examples: (1) tax cuts, free trade, and record surpluses under President Clinton and (2) record spending and deficits under President George W. Bush. The point is that the market has certain expectations from each party, and many times those expectations are not fulfilled, for whatever reason. The second theory is that this statistic is irrelevant and has more to do with the “luck of the draw” than with whoever is President (much in the same way the stock market tends to go up if the AFC wins the Super Bowl and decline if the NFC wins).
We do know with certainty that the market is continuously “pricing in” hundreds of variables—from the deficit to interest rates; the business cycle to commodity prices; from consumer confidence to corporate profits; and yes, whoever controls the White House and Congress.
As a result, we cannot emphasize one factor alone as having such a significant impact on stock market performance. In total, an election itself will not drive the markets.
Misunderstanding #8—Overestimating the Impact of a Manager
Among the smaller duties of life, I hardly know any one more important than that of not praising where praise is not due.
—Sydney Smith
The asset class selection is responsible for 88 percent of an investor's return, yet investors tend to give the most credit or blame to the asset manager for performance (see Figure 3.1).
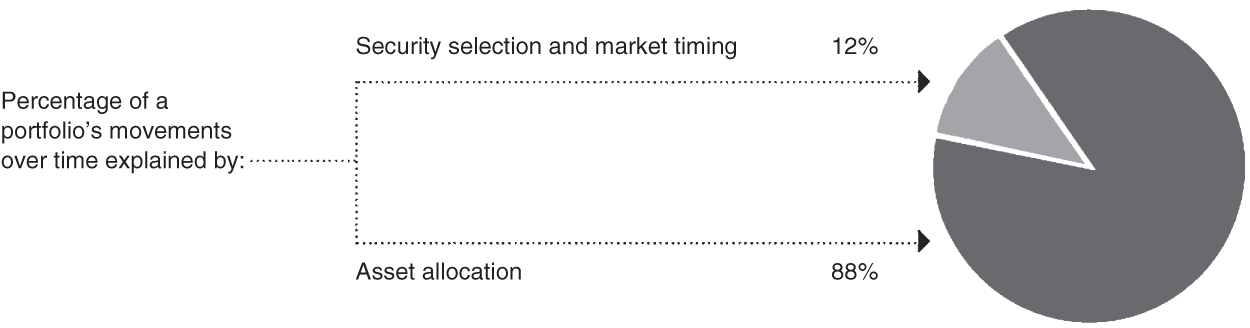
Sources: The Vanguard Group, Inc. 2013. “Vanguard's Principles for Investing Success.” The Vanguard Group; Using data from Morningstar.
In any given year, the top-performing and worst-performing funds tend to be in the same category. For example, in 2017, emerging markets funds were some of the top performers. Were the fund managers geniuses? No. The emerging markets index outperformed most of them. They simply happened to manage emerging markets funds in a year when the asset class did well. That same group performed quite poorly the next year when emerging markets were hammered. Were the same managers complete idiots? No. They just happened to manage emerging markets funds in a year when this asset class underperformed other areas of the market.
The reality is that when looking at performance, an investor must remember two important things: (1) Regardless of how the manager performed, the odds are very high they will lose to the index going forward, and (2) even if the performance is excellent, most of the return is indicative of how the asset class performed, rather than due to the manager's skill. The manager, for the most part, is along for the ride.
Misunderstanding #9—Believing Market Drops Are the Time to Get Defensive
The stock market is the only thing people prefer not to buy when it is on sale.
—Origin Unknown
When the market is dropping, all of the powerful forces we cover in this book, from the media to your behavioral instincts, will encourage you to take action to protect your portfolio. This usually means “getting defensive” by going to cash or switching your allocation, which is often a monumental mistake—one of the worst an investor can make. As we covered exhaustively in Chapter 1, this strategy does not work and causes more harm than good. Your reaction to a market drop should be the exact opposite. If you like the market at 26,000, you should love it at 20,000.
Your asset allocation should be a function of your goals. If 60 percent of your portfolio is in stocks, and the market drops 20 percent, you should buy more stocks to get your portfolio back to its target allocation. Selling stocks is abandoning the plan at the worst possible time.
Stocks seem to be the one thing that no one wants to buy when they are on sale. If your favorite restaurant offers everything at half off, you will eat there more. If your favorite car is for sale for half off, you will quickly buy one. If a grocery store cut the price of everything by 50 percent, you would go on a shopping spree. Yet when stock prices are cut in half, investors freeze and do nothing, or even worse, sell. Instead, they wait for the prices to double, and then they want to buy! Ignore all the prognosticators who are tempting and even encouraging you to panic and make a poor decision. Remember, everything is on sale. The time to buy is now.
Avoiding Mistake #3—Misunderstanding Performance and Financial Information
The greatest enemy of knowledge is not ignorance; it is the illusion of knowledge.
—Daniel J. Boorstin, The Discoverers: A History of Man's Search to Know His World and Himself
A large part of the financial information an investor encounters is worthless, damaging, or misleading. For investors to protect themselves from taking action based on this sort of information, they must understand how reference sets work, understand that performance data can be misleading, view financial news with skepticism, and most importantly, develop a skill for filtering out the noise.
Notes
- 1 A special note to all you English majors: Yes, we are aware that “media” is plural and therefore using “the” before media is not necessary, and even considered incorrect. We researched this a bit and have found “media” widely accepted in the singular for several decades. We also think it just sounds better than saying “media is killing you.” Since we have space, here is our defense:
The etymologically plural form media is often used as a singular to refer to a particular means of communication, as in, the Internet is the most exciting new media since television. Many people regard this usage as incorrect, preferring medium in such contexts. People also use media with the definite article as a collective term to refer not to the forms of communication themselves so much as the communities and institutions behind them. In this sense, the media means something like “the press.” Like other collective nouns, it may take a singular or plural verb depending on the intended meaning. If the point is to emphasize the multifaceted nature of the press, a plural verb may be more appropriate: The media have covered the trial in a variety of formats. Frequently, however, media stands as a singular noun for the aggregate of journalists and broadcasters: The media has not shown much interest in covering the trial. This development of a singular media parallels that of more established words such as data and agenda, which are also Latin plurals that have acquired a singular meaning. (The American Heritage Dictionary of the English Language, 4th edition, 2000)
- 2 Thanks to my brother, Mark, a screenwriter for sharing this concept with me. For free.
- 3 This is a reference to the 2013 blockbuster Gravity, and not to be confused with the “If Sandra Bullock doesn't help disarm a bomb on this bus before it drops below a certain speed, everyone will die!” which would be a reference to the 1994 blockbuster Speed.
- 4 If you are asking, “Did Peter basically just allege that the news can kill you?” Well, if you watch too much of it and get worked up about it, then yes, I did!
- 5 Actually, some people do say that, or that the media at least contribute to some crises.
- 6 The stock market has hit well over 250 all-time highs since then. All of these “events” have been accompanied by commentators talking about things like “being overdue for a correction,” the market being “frothy,” how it's time for a “pullback,” and the like.
- 7 Thank you!
- 8 Other than having an excuse to look at the Sports Illustrated swimsuit edition for business purposes.
- 9 Why is it that those who want to scare people out of the market or promote market timing leave out dividends? All that matters with any investment is the total return, which is capital appreciation plus dividends or income.