
The Exponential Trendline of Economic Growth
Study the past, if you would divine the future
—Confucius
The future influences the present just as much as the past.
—Friedrich Nietzsche
The first and most important concept to internalize is the accelerating rate of change. This is a very under-discussed subject even though it increasingly affects almost everything about modern life. One of the best places to read about this is Ray Kurzweil’s 2001 essay, despite the age of the article (the dearth of more recent writings by multiple people is itself a problem that this whitepaper aims to correct). From his essay, we see how technological progress is accelerating, multifaceted, and diverse. The essay also proves that technological progress is not in stagnation or reversal, as some claim. It is important to note how exponentially accelerating processes have been going on since the dawn of life on Earth, and through the evolution of life, with each unit of change taking even smaller intervals of time. That process has continued through measures of progress within human society as well, especially in economics and technology. In this chapter, we will specifically focus on the economic side of accelerating change, for no other metric does more to demonstrate how fortunate we are to be alive in the 21st century.
For now, we will use the customary metric of “Real” GDP growth rates (i.e., inflation adjusted), while later explaining why the less famous but more natural measurement of nominal gross domestic product (NGDP), despite including inflation, is the more relevant measurement for the future. “Real” GDP overstates the dangers of moderate inflation, while understating the dangers of negative inflation (deflation), ironically making it less real, in an era of high technology. Furthermore, is GDP even the correct metric anymore? GDP is calculated in a manner that favors doing “even more with more” to a greater degree than it favors doing “the same with less,” while technology is primarily about the latter. It is also true that GDP does not always provide the most precise measure of prosperity, for which indices such as the Human Development Index are more comprehensive. But for lack of a better alternative in tracking centuries of progress, we will use GDP, in particular “Real” GDP, for the purposes of these calculations.
Economic Growth Through the Ages
Everyone has studied historical events in school, passing exams and even writing papers. Contemporary schooling barely describes the greatest historical transformation of all time—the very recent upliftment of the human condition. An education about historical events is utterly incomplete without a sufficient illustration of the prosperity levels of the era. This backdrop has to go far deeper than a “there were no air-planes in those days” level of cursory mention, for only then can the conditions precipitating wars over resources, slavery, and so on be truly grasped. Romanticizing the imagery of some past society invariably necessitates a selective focus on the topmost aristocrats, while ignoring the brutal and brief lives that the other 99% were condemned to. Effectively, any lament about “how good things were then” is an inaccurate fictionalization.
We are presently accustomed to per capita real growth rates of almost 3%/year for the world economy and consider this to be a status quo cruising speed, as though such a growth rate has always existed. In reality, such growth rates did not begin until the middle of the 20th century. In the 19th century, the average world growth rate was much lower, at about 1%/year. Before that, annual growth rates were a fraction of 1% from the 16th through the 18th centuries, and virtually 0% for the thousands of years of human civilization before that. The accelerating rate of economic growth (which is the second derivative, mind you) has not stopped, despite how lackluster present conditions may feel.
Let us examine the following two charts, which indicate world GDP per capita in current dollars first on a linear scale and then on a logarithmic scale, 1960 to 2014. The exponential nature of economic growth is apparent from both charts, but each depicts the trajectory in a different light. If you projected the same trend forward just a few more years, we can see that a much higher level of prosperity arrives. The topic of adjusting for inflation may arise, but as we will see in a later section, current methods of calculating inflation overstate inflation rates, and are thus starting to become obsolete.
We have world GDP estimates going back centuries, and if we take a simple linear regression of past data and project it until the year 2050, on a third chart with a logarithmic scale on the vertical axis, we get a window into the future. We can examine this even more effectively with the horizontal axis oriented as looking backward from the present. Note the parabolic curve despite the scale being logarithmic, effectively exhibiting a second derivative of exponential growth. The accelerating nature of economic growth, going back centuries, is apparent when the chart is presented in this way, and proves that it could not have existed until recently.

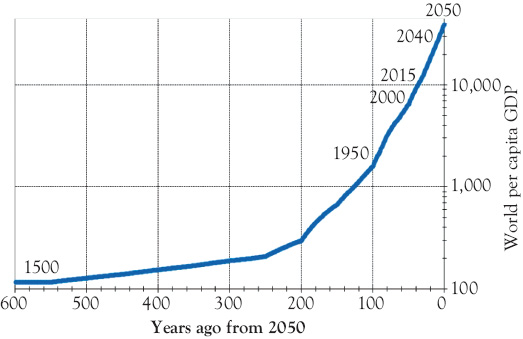
Imagine if 3% annual growth rates in per capita GDP, implying a doubling every 24 years, had started from 500 BC, resulting in over 105 doublings by now. Or from 1500 AD or even from 1800 AD, which would still have yielded nine doublings since then, resulting in a growth factor of an incredible 512x. Since growth rates of this nature were never possible before the modern era, the second-derivative indicates that there is no reason to think that the trendline has stopped or even plateaued. The key word here is trendline, as distinct from actual data.
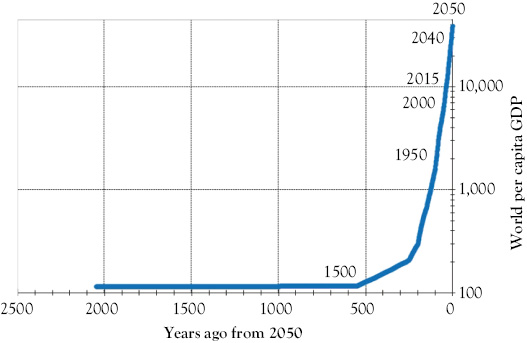
If thousands of years of nearly 0% growth can be followed by a century of 1%, several decades of 2%, and then another few decades of 3% growth, simple mathematical extrapolation of that trend implies much higher growth rates in the near future. This fourth chart is an extension of the same chart backward 2,500 years. As we can see, the steep trajectory of growth has never, at any time, halted or reversed. In terms of simple multipliers, the rise from 1% to 3% trendline growth is no different, proportionally, than a rise from 3% to 9% growth later on in the curve. Mathematically, this should not “seem” any more rapid for the estimated year the curve intersects than today’s growth rates would have seemed in the 19th century. You may be skeptical about this if you have not read the later chapters in this whitepaper yet. Is an unstoppable progression of ever-rising growth rates a believable outcome? Since past performance is not always a predictor of future outcomes, surely we cannot just project the trendline to a point where in just a few decades even ordinary people are destined to have great prosperity. Is there some ceiling of human productivity that we have arrived at? How will most people acquire the skills to produce that much output? Is it not inevitable for the law of large numbers to eventually catch up, even if an identical skeptic in the 19th century would have been proven wrong had he dismissed an accurate prediction of 2015 prosperity as too optimistic?
The crucially unpredictable ingredient in such projections is that of nation-state risk. Economic growth within an individual country does not just happen without the right set of conditions. Sometimes, the wrong policies, centralized micromanagement, or ossified assumptions can lead to economic declines such as the Great Depression. Recoveries since these calamities have generally returned world GDP back to the trendline as though the crisis never happened, but some nations often leapfrog others in the process, capturing a disproportionate share of the recovery. The most prominent example is of how China and India jointly declined from being 40% of the world GDP in 1820 to just 2% in 1975, even as the aggregate world GDP trendline was a smooth exponential curve throughout that period. This period was essentially the “Dark Ages” for China and India, precisely coinciding with when the West was outperforming by the greatest margin. The rapid recoveries of China, and to a lesser extent India, since then can be seen as the start of a process of mean reversion to historical norms of GDP share, assisted by the steeply rising world trendline. The two nations are now jointly 18% of world GDP, and may very well recover all the way up to the traditional 40% in a matter of just years, not decades or centuries.
Thus, there is reason to believe that if governments adjust policies accordingly and proactively, world GDP per capita can be restored to the trendline. There is similar reason to believe that the economy may force a toppling of obstacles preventing the trendline from reverting back to its natural state. So far, this trajectory has reverted to the exponential trendline through world wars, economic depressions, plagues, and the dissolution of empires.
Yet most developed countries today somehow appear to be stuck in a lengthy malaise of subpar growth, combined with little or no inflation. There seems to be a resigned acceptance of a melancholy “Real” per capita growth rate of less than 2% in the United States, and under 1% in Europe, even though this is less than what was seen in the 1990s. The default assumption appears to be that this will be the norm for the foreseeable future, in direct violation of the expected accelerating gradient of growth. Even worse, the NGDP that the United States normally sees has fallen from over 6% prior to 2007 to under 4% now, which adds a poorly understood but nonetheless substantial damper on economic vibrancy and the pace of innovation. As more years of this divergence accumulate, the opportunity cost is rising. The world can no longer afford to continue to ignore how technology has altered the fundamentals of macroeconomics.