
Chapter 5
PV Market Development
5.1 Strategic and Consumer Goods in Society and Why Strategic Ones Need Initial Support
Before we start explaining and understanding the growth of the PV or other renewables sectors, we first have to ask why market support programs should be introduced for technologies which have a much higher cost at their start – like electricity from PV or other renewables – when the same product can be produced much more cheaply with conventional technologies – like gas, coal and nuclear powered plants. The product kWh is no different depending on which power generating system was used. So, why then should politicians facilitate support programs that society has to pay for?
5.1.1 Consumer and Strategic Goods – a Message to Economists
We must differentiate between two distinct products within a society. I like to call them “consumer goods” and “strategic goods”. Figure 5.1 gives some examples for each category. It is obvious to me that the consumer goods should not be used to influence the respective production industry with industry-political actions – although I know that in many cases this is unfortunately happening. Since people simply want the new car, the new mobile phone, the new house and many other consumer goods, we should have a level playing field for the global industry to create efficient competition for the benefit of the customers. Free trade, no state interference and a worldwide contest is the right way to go, and here I am in agreement with some of the liberal political principles. In contrast to this, there is the way strategic goods should be handled. Just some examples:
- … the way electricity is produced
The product sold to the customer is a kWh electricity. The product kWh will be not different depending on the technology producing electricity, but the cost will be different. As a consequence, each utility company would just adopt the approach with the lowest cost in order to have an advantage over their competitors. A new technology would have no chance to be utilized as long as it was more expensive than the existing methods. And any new technology entering the market will start with high cost and high price at low volume production. Without the hundreds of billions of dollars spent on support and subsidies, the nuclear industry would never have had a chance to enter into utility scale competing with coal and oil 40 years ago. But at that time the whole world believed that this new technology could really be the future and would provide endless and cheap electricity and therefore all the relevant states spent the necessary billions so as not to lose out against the others. By now we should know better! - … the way transportation is done
I remember when in the mid-1980s politicians in Europe pushed for a legislation on the catalyst to remove HC, CO, NOx and – for diesel cars – unburned carbon. An additional positive side effect was the removal of lead in the petrol as this would have been a poison to the catalyst. The first reaction by the European carmakers was an outcry although they should have known better, since the introduction of the catalyst had been successfully carried out 10 years beforehand in US and a few years beforehand in Japan. Without the interference of politics, we would most probably still today have the dirty exhaust by the millions of cars on European streets; at the very least introducing the catalyst would have been delayed by many years which would have caused a lot of damage to the environment and to the health of people. - … the way people are living in the urban environment
Without additional incentives most existing houses would take much longer to get refurbished in the way which was described in the preceding chapter: insulation, low-e windows, heat pumps, solar thermal, PV systems and much more. The new building directive in Europe which will enter into force in 2018 pushes even harder to reduce the traditional waste of energy.
Figure 5.1 Consumer and strategic goods.

To summarize: if for strategic goods within a society drawbacks are encountered for the traditional way in which a strategic good was provided so far, it is necessary to provide either a legal framework (like with the catalyst) or a support for the new industry (like nuclear 40 years ago, or renewables today) either by subsidizing the industry or – as I will show – through a much better way: supporting the customers in buying the new technology. It is part of the true leadership of politicians to recognize the development of new and better ways to serve important strategic goods in a society and to provide the appropriate support to bring this new technology into the mainstream.
5.1.2 Market Pull Versus Technology Push – What is the Best Support Program?
In the preceding chapter it was already highlighted that technology push programs like for the wind energy in the US in the 1970s or Germany with its GROWIAN in the 1980s have not been successful in introducing a new technology. Millions of dollars in R&D money were given to big research organizations which worked together with research divisions from – most often – big companies and who made the mistake of using a scaling factor which was much too high compared to the state of the art technology. Such research projects in most cases resulted in prototype machines which did not make their way to volume production (for examples see the wind energy chapter). In contrast to just funding big research projects at institutes and companies, one should additionally support the investor of the device, for example in PV or wind, in producing the product under consideration e.g. electricity. There are two possibilities: either the state can provide support for the investment in form of an investment subsidy and/or tax credits, or by paying a fixed tariff for that product over a defined period of time. The first scheme was widely used in the US and Japan (until recently); the second was first introduced in Germany as early as in 1991 (feed-in law for renewables in general plus an investment subsidy of 70% for PV systems) and was adopted for the different renewable technologies in 2001 with the EEG (renewable Energy Sources Act) without investment subsidy.
There are several drawbacks with the investment subsidy scheme as experienced in the past. First, a maximum price value must be defined for this investment. In the case of PV in 1991 this maximum price was determined by the funding ministry at 13,500 € per kW installed. It is no surprise that it did not take too long before all over Germany the specific price for a PV system was at or around that number – for lower as well as for better quality systems! This does not really create a competitive market. Another finding was the investor’s loss of interest in long term performance, especially private investors. Once the subsidy had been received, many did not pay attention to the best continuous functioning of the complete system, including regular maintenance.
These disadvantages can be overcome when the support is given in the form of a properly calculated fixed tariff over a defined period of time. In the case of PV the principles were defined along the following philosophy: the period of time was determined at 20 years, also determining the depreciation time of a PV system. This should guarantee good quality of the components as well as of the workmanship. The proper calculation was done by taking the above depreciation time, the financing conditions at the time for the investment, and an allowance to make a decent profit on the invested capital over the 20 years. “Decent” should mean that the return on investment should be in the range of more than ~6% but less than ~10% per year. The numbers were not fixed but were seen as a gentlemen’s agreement in the public/political discussion: more than 6%, because otherwise investors would take other investment decisions and less than 10% as the money for this tariff is collected from all electricity payers. As the tariff is paid for 20 years, the investor has a great interest in maintaining a properly working system for the entire period, and it also makes investors look regularly at whether the electricity production is really what it should be. There are web pages today which show for each postal code how many kWhs per kW should have been produced within the actual time period for a standard system. Quality is also of major importance because the whole system must at least work for 20 years with only little degradation. The last, but definitely not the least important argument for this type of support is that it creates a highly competitive environment. Because the investor in the PV system gets the support, he looks at the market place where he can buy the product at the desired quality for the best price. It is therefore no surprise that in Germany we have the worldwide lowest prices for PV systems per kW for the different applications.
As will be described later, the FiT (Feed-in tariff) program which was introduced in Germany in 2001 was able to initiate a growth of the PV market which was very successful, both in terms of quantity and also in terms of price decrease. An important aspect is also where the budget to pay the FiT should come from. If it is taken from a ministry’s budget (coming from the tax payer) it is very dangerous, as tight budgets in countries will always initiate a new debate every year on how much can be afforded in the budget for the next year. If, however, this budget is distributed among all electricity users, this represents a much easier way forward – as long as the increase in the kWh-price is reasonable and accepted by the general public.
A short remark on another support scheme called quota together with certificates. Here politics defines a fixed share of renewables and utility companies are obligated to fulfill this with the evidence of certificates. These certificates are tradable. Utility companies are either able to produce the needed share themselves or they buy certificates from operators of renewable energy systems. If the company is not able to provide enough certificates relative to its produced electricity it will be fined. Advocates for quota systems often argue that this support is more market conform compared to FiT’s because there is some trading involved.
FiT’s basically have no limit for the share of renewables – which is a great advantage over the politically fixed volume for quotas. The incentive for the investor is the guaranteed price for a fixed time (normally 20 +/− 5 years) dependent on the technology and region. Furthermore a digression of the FiT as a function of time is foreseen to account for technological progress.
For countries which have introduced either a quota system or FiT-program for the same technology, in this case wind energy, the number of installations and also the resulting cost figures are compared in Table 5.1. If countries with similar electricity markets are compared (e.g. Germany with Great Britain, Spain with Italy) there is a remarkable increase in size by a factor of about 4 to be seen for countries with the FiT support scheme. Also, the resulting price level is considerably better for FiT-countries by more than 50% on average – and this for countries with comparable wind conditions. This can indeed be taken as clear evidence of the superiority of FiT-programs over quota systems.
Table 5.1 Comparison of wind power price and cumulative volume in countries with FiT’s and quota at the end of 2011 (source: EWEA, 2012 and EREF, 2009).

It is interesting to follow the political discussion in many EU member states up to the highest levels in the EU Commission where supporters of quota systems would like to install a so-called “harmonized support scheme for all renewables within the EU27”. What may sound quite nice turns out to be the best strategy to prohibit the quick growth of renewables. The ultimate goal for them is to install only those renewables which at a given place and time are the cheapest ones, namely centralized and large systems. Especially the small and decentralized systems like PV on roofs would become obsolete, because no utility company would make any investment and private households would no longer benefit from such installations. As one Commissioner always argued: wind systems should only be installed in places with high wind speed – preferably off-shore wind parks – and solar systems only in those regions with the highest insolation – preferably in Southern Europe. In both cases it may take many decades until a significant share of renewables is established, because off-shore needs some additional time to solve the technological challenges and Solar in Southern Europe would need Super Grids to transport the generated electricity to the consumers in the rest of Europe through a number of countries.
My conclusion from these facts is that those pushing for a quota system rather than a FiT system are actually fighting against the cost effective large volume introduction of a competitive portfolio of renewables over traditional energy technologies.
Today, there is a highly controversial discussion around the globe on the following topic: For the strategic product “renewable electricity kWh”, a country has decided on a support scheme for PV with a feed-in tariff as just described. The question arises whether it is appropriate to give preference to locally produced components (also called “local content” for modules and inverters) as long as the country’s population is paying for the growth of the market and the politicians have to take the responsibility.
One extreme is found in the state of Ontario in Canada, where a law was put in place that required 60% of local content for the system components from 2011 onwards. This implied that most of the value added work for a module or an inverter had to be done locally, which had resulted in a number of new production companies for these components. The disadvantage of this approach was twofold: as production cost for the relatively small volume factories was significantly higher than the state of the art production facilities, the price at which the components were sold to the customers also increased, which resulted in a much higher installed system price, requiring a proportionally increased feed-in tariff; in 2012 the FiT in Ontario was more than three times as high as the one in Germany although the average global irradiation is more than 25% higher, which means that FiT in Ontario should be 25% lower (annual irradiation (900 – 1,200) kWh/m2 in Germany compared with (1,300 – 1,400) kWh/m2 in Ontario. However, the feed-in tariff in 2012 was (13.5 – 19.5) €ct/kWh in Germany and (64.2 – 80.2) CADct/kWh which corresponds to (49 – 62) €ct/kWh). Another aspect is the violation of the WTO rules which are accepted by many countries in the world. It remains to be seen whether the legal actions already taken by other countries (e.g. Japan) will put an end to this type of local content.
In Italy, another interesting scheme for local content has been proposed, which also aims to push the local production industry. The approach taken was a bonus to the FiT that was paid if the product was produced in Europe, where the bonus is 10% higher if more than 60% value adding to a component is done in Europe. Also, France introduced a bonus scheme late in 2011, which adds 5% to the tariff if the module is fabricated in Europe and an additional 5% if also the solar cell is fabricated in Europe. This scheme does not prohibit the import of any components and the level of the bonus is quite reasonable – it will be interesting to see how this scheme develops, although it in principle also violates the WTO rules in general but is much “softer” than high import duties or the Ontario model.
In all WTO countries companies within an industrial sector have the right to ask the responsible legal entity (i.e. DG Trade in Europe, the Department of Commerce in the US) to determine import duties for products coming from a particular country if an infringement of anti-dumping or anti-subsidy rules can be proven. This was done in the US in 2012 for PV modules containing solar cells produced in China. There is an ongoing procedure in Europe (to be concluded at the beginning of December 2013) for wafers, cells and modules produced in China.
5.2 PV Applications and History
There are many different customer needs which can be effectively powered by PV. The optimal PV product is by no means a “one size fits all” solution. However, the different PV technologies, which will be explained later in more detail, can help to make nicely custom tailored products. Another important aspect for the many applications is the different parameters which have to be met when a specific product is optimally developed. This can be best understood by taking a closer look to Figure 5.2. The four rows show for two typical examples each of PV systems for on-grid (that is PV systems integrated into the electric network), off-grid (stand-alone systems, not attached to the grid), consumer (ranging from powering watches and calculators through garden and house appliances to integrating them into other products like sun roofs in cars) and high efficiency products for special applications. The timely development when the major applications entered the market is shown in Figure 5.3.
Figure 5.2 PV systems serving a multitude of different customer needs.

Figure 5.3 PV market and application evolution.

Below each picture the specific focus for the different applications is given. Starting at the top right hand we can see the first commercial use, namely solar cells to power satellites. This was first done for the Vanguard I satellite, launched in 1958 in the US. Prior to that, the satellites had been powered by atomic batteries, which had a clear disadvantage to the lightweight solar cells due to their high weight (Promethium 147). It was and still is the weight per power (g/W) customer focus which drives technology for PV in satellites. First, greater and greater efficiency was developed with crystalline solar cells which were increasingly switched to the substantially higher efficient III–V solar cells (GaAs based) in the 1990s, which today surpass an efficiency of 40%. An interesting spin-off is the introduction of concentrated PV (CPV) in recent years, where these highly efficient solar cells are mounted on a two axis tracking device and each small cell (~5×5 mm2) receives solar light from a concentrating Fresnel lens with a size of ~100 × 100 mm2, thereby reaching a concentration ratio of about 400. Obviously the customer focus in this case is the highest efficiency per area (W/mm2). Concentration ratios can go as high as 1,000. A typical system is shown in the bottom right hand picture.
The row to the left shows consumer goods. This application was started in the 1970s and was first used in millions of calculators and other small appliances. Preferred technology here was an amorphous silicon solar cell of a few cm2 area. The bottom picture shows a typical garden product swimming in a pond, where the round solar module drives a little pump which – proportional to the sun shine – gives a small water fountain.
The aesthetically pleasing integration of the solar module into the body housing for the various (OEM, Original Equipment Manufacturers) products makes thin film modules the preferred choice (round and different cell shapes for easy series integration, flexible modules to accommodate for bent body housings). The upper picture shows an application of a solar module integrated in the sun-roof of a car. The customer service here is a cooler interior of the car when sitting in the sun whilst parking. The module drives a ventilator, sucking cool air from beneath the car and thereby creating a considerable temperature drop inside the car which is at its biggest when it is most needed, because the more the sun is shining the quicker the ventilator turns. This is also the reason why for this application, where only a given and limited area is available for the module, the efficiency of the solar cells (W/m2) is a decisive factor.
The second row from the left illustrates two typical examples for off-grid applications. The bottom picture shows an industrial application, here the replacement of the diesel generator to power a remote telecommunication system. In former times there was the need for a regular visit by helicopter to fuel and maintain this system. With PV modules, batteries and a small diesel engine for the few times of year when the batteries are empty and there is no sunshine to charge them, much fewer visits are necessary, making the power supply much lower in cost per year. Other important industrial applications are the cathode protection of pipelines to prevent corrosion, off-shore navigation warning lights, horns in lighthouses, railroad crossings and many more remote systems where utility grid connection would be more costly compared to the PV system. Customer focus here is on high quality and a long life at a competitive price.
The other major application, seen in the top picture as solar home systems (in Indonesia), is to bring electricity to the billions of people living in rural areas in emerging economies and developing countries. Without PV they would not have access to light and communication tools for a long time to come. But with a solar home system as can be seen in the upper picture, the small module connected to a small battery can provide this service at a lower cost compared to burning candles to have at least a bit of light in the evening and instead of using dry batteries for listening to the radio. Adding the newly developed LED products which need much less electricity than former light bulbs there are so called “pico PV systems” available which combine a rather small PV module with such energy efficient lamps to cost effectively bring light to these regions and the people who live there. Also PV powered water pumping, both for drinking and irrigation, is less costly today as well as environmentally safer compared to diesel powered systems. The customer focus for this remote use is the cost for the hours of light, which can be offered to the household, the liters of water pumped with such a system, the time one can be connected to the world via radio, television and internet. In the 1980s this application was perceived as the major market segment for the coming decades. By connecting several houses together one can create a mini grid to efficiently power many remote villages. With today’s prices of the components of such a system (modules, inverters and batteries together with energy efficient appliances to decrease the electrical power input) the old dream of bringing power to billions of people which we had back in those days, could become true in the coming years. Access to money is also important – even if the cost is only some 10s of $ it constitutes a major investment for a household in developing countries. This can be supported through proper micro-financing schemes despite the fact that some of these schemes did not always achieve what they should have – which is not the fault of the micro-financing idea, developed by Muhammad Yunus with his Grameen bank, but rather due to the greed of individual banks who misused the scheme by asking for interest rates which are way too high and thereby driving customers into ruin.
The first row shows typical examples of on-grid applications: the top picture displays a roof-top system, where the modules are mounted on top of an existing roof of a private house, and the bottom picture shows a so called Building Integrated PhotoVoltaic (BIPV) system. In order to have grid connected systems as a mainstream application, the customer is focused on €ct/kWh generation cost. This firstly allows a comparison with the household price which he has to pay for today’s portfolio of power generating systems and at a later stage – actually not too far in the future – it will allow to compete with gas, coal and nuclear power generation. An important aspect for an additional customer need to be served in BIPV applications is the price/m2 and the homogeneous appearance of PV products when integrated into a façade or overhead shading.
The market split for the market categories on-grid, off-grid and consumer from 1995 to 2010 is shown in Table 5.2 [Navigant, 2012]. One observation is that in 1995 there was a clear dominance of off-grid applications with more than 80%. This changed quickly because of the rapid growth of on-grid systems. Even the off-grid, consumer and high efficiency applications grew in this time interval at a rate of about 15% per year. Most industries would be happy if they had such a growth rate over a period of ten years. But the on-grid segment, unanticipated by almost anyone, grew at an average of 66% annually during these years and increased its market penetration from only 13% in 1995 to a dominating 98% in 2010.
Table 5.2 Historical development for market segmentation.

5.3 Historical PV Market Development
Early in the 1980s, the US was the engine for PV production and deployment. As early as 1983 a 6.4 MW installation by the market leader at that time Arco Solar (later Siemens Solar, Shell Solar and then integrated into Solar World (crystalline Silicon business) and Saint Gobain (Thin-Film business)) was built for the utility company Pacific Gas and Electric (PG&E) in Carissa Plains, California. Another subsidiary of the oil company Amoco, Solarex, was also one of the biggest producers in the early days (their slogan in these times was ‘we are not the biggest, but the best’). When BP merged with Amoco the two subsidiaries Solarex and BP Solar were combined into BP Solar, which was for quite a while one of the Top 3 module producers worldwide (see also Table 5.3). The latest news is that BP Solar is just about to withdraw from the manufacturing of solar modules. With the exception of Total, who came from the downstream installation business and recently acquired Sun Power, one may ask why most of the big oil giants – Exxon, Shell, BP, ARCO, Mobil – who invested in this PV technology in the early days are now divesting. A couple of thoughts are:
- The big rush of oil companies into PV started after the oil crisis in the 1970s. Many of these companies were looking for new business opportunities related to energy
- The investment in the early days was comparably small for such big and rich companies and management was used to spending a couple of hundred millions of dollars on bore holes which were empty but at the same time finding ones which brought in a lot of money – PV was possibly seen as an either/or enterprise
- For the solar subsidiaries, the management positions in most cases were staffed in a similar way as in the mainstream business: job rotation of CEOs every few years (during my time as CEO of ASE and later of RWE Solar I have seen a handful of CEO colleagues in each of these solar companies)
- The mass production of PV modules and its subcomponents requires a different background in the executive mother company compared to what the mainstream business is doing (similar arguments apply to utility companies)
As a consequence it is not surprising that either dedicated newcomers or heavy weight mass producers are the ones to dominate the production arena in the future.
But now back to the further growth of the PV-market. After the first market push it was only California who made further installations, but on a small scale. Also in Italy a number of larger projects were installed in these years of the 1980s by the utility company ENEL, for example the 80 kW system on Vulcano Island or the remarkable 3.3 MW Serre plant. Similarly, the German utility RWE added a 300kW demonstration plant in Kobern-Gondorf in 1988, primarily aimed at testing the state of the art for module and inverter products but also looking at how to integrate PV into a nice-looking green field surrounding (they hired a botanist to help rare species of animals and plants to settle within the solar field). Another 1 MW test field was completed in 1994 in Toledo (Spain).
Projects such as those mentioned but also in general are no basis for a stable or even growing market. A first demonstration of integrating PV systems into private houses was the 1,000 roof program in Germany which started in September 1990. Because of German reunification this number was increased to a total of about 2,500 PV systems, each with a size of between 1 and 5 kW. The average size for all systems installed until 1993 was about 2.5 kW, so the total installed capacity for this demonstration project was about 6 MW. The support was given to the investor in form of an investment subsidy of 70% (up to a maximum of 13,500 €/kW installed price). An additional important cornerstone was established: in order to have a smooth grid integration, a feed-in law for renewables was introduced to support the above described PV project and also to support the installation of several 100 MW of wind energy. Besides many important positive achievements this project had one major deficit for PV: the annual size was very small (~2 MW per year) compared to the annual global market of about 60 to 80 MW in these years. As a consequence, the industry – the PV manufacturers in Germany and other European countries – did not need to invest in additional capacities. Obviously an industry-political goal to push the manufacturing industry at home was missing.
This was very different in Japan. I remember in the early 1990s during the German “1,000 roof program” when officials from the Japanese Ministry for Economy, Trade and Industry (METI) visited Germany and to look in detail at how the support was organized in the German demonstration program. In 1993 the “New Sunshine Project” was launched and an incentive program was started in 1994 with an investment subsidy similar to the one in Germany. This “Residential PV system Dissemination Program” – better known as “70.000 roof program” – was oriented towards commercialization of PV and especially towards building additional production capacities in Japan. This was possible because the program size allowed for it. With an average of 3 kW it was a total of more than 200 MW which had to be installed. As a consequence, until 2002 Japan was stimulating and leading the global market as can be seen in Figure 5.4.
Figure 5.4 Regional market evolution until 2005.

The simple goal was that the big Japanese module companies should invest quickly to reach mass production earlier than other companies across the globe. This should result in manufacturing in Japan at lower prices so they might be enabled to efficiently win market shares in other solar markets in the EU and the US by forcing out of the market those competitors, who had not reached mass production levels, and were thus likely producing at higher cost. In the first years, while Japan was the biggest global market place, the Japanese companies would focus on building sufficient capacity to supply the home market. It is no surprise to discover that, in 2000, the Japanese manufacturers enjoyed a ~40% market share compared with ~30% for US and ~20% for EU competitors. The details for the Top 10 manufacturers are shown in Table 5.3. The situation was summarized in an article by Oliver Ristau [5-1] in 2001: “In the coming two to three years, a Japanese-style export offensive can be expected. Until then, as defined in the METI Research Program “New Sunshine Project”, companies should have successfully taken the steps to mass production. Then what the Japanese had accomplished in other industry sectors could become reality: the flooding of foreign markets with low-priced, mass-produced articles.” However, as careful as the considerations of the METI were, the reality in later years developed quite differently. One drawback was the phasing - out of the investment subsidy program for PV installations at a point in time which was too early compared to the generation cost which had by then been achieved. This resulted in a slowing of growth until 2005 as seen in Figure 5.4, including even a decrease of the annual installations after 2006 until 2008. Although the annual market installations could be positively influenced after the introduction of support measures (compare Figure 5.5), the dominance enjoyed by Japanese producers suffered in a first wave when German manufacturers surpassed them in size and even more in a second wave which witnessed the rise of a huge Chinese production industry strategically supported by the Chinese government.
Table 5.3 Top 10 module production companies in 2000.

Figure 5.5 Regional market development until 2011.
After the end of the “1,000 roof program” in Germany there was only a small market increase, driven mainly by some municipality projects with some remarkable new ideas, like cost effective feed-in tariffs of about 1€/kWh paid to investors in several communities and towns, like in Aachen, Hammelburg, Munich and several others.
It was at the start of the newly elected Red-Green Coalition in Germany in 1998 when it was realized that it might not be possible to quickly introduce a feed-in tariff but that another market pull for PV could be established earlier. In 1999 the so-called 100,000 roof program was started with the goal of installing 300 MW PV systems. At the beginning, investors were given a zero interest rate loan for investments in solar PV systems. This resulted in a monetary benefit at the time of not more than 10% when compared to a credit, customary in banking. Due to relatively small-scale financial support the program was initially taken up rather slowly but accelerated quickly after being combined in 2000 with the Renewable Energy Sources Act (RESA = EEG). Until 2005, more than 90% of the European market, as shown in Figure 5.5, was in fact the German market. With the increasing German market, the year 2003 marked an important shift from Japan being the biggest market for PV installations until 2002 and Germany taking over this role in 2003 due to a much more generous support program for the investors in PV systems. At this point it is helpful to take a closer look at both the development of the feed-in tariff program as it had evolved in Germany since 1991 and how it originated. My own recollection of the chronology of this new and mind-set changing support program was as follows:
Among those who helped advance the renewable case, Wolf von Fabeck stands out. His contribution was important in regard to the question of cost-covering remuneration for electricity produced from all the different renewable technologies. After founding the Solarenergie-Förderverein Deutschland e.V. (SFV) headquartered in Aachen in 1986 he pioneered advocacy of this new form of market support in the late 1980s, with the objective of reaching 100% renewables as quickly as possible. Obviously he was also a forerunner in propagating a 100% renewably powered world which now, 20 years later, appears to be a topic taken seriously by more and more people (including the author).
In order to demonstrate the maturity of renewable energy theory and practice, two demonstration programs - “1,000 roof PV” and “100/250 MW wind” - were introduced in Germany in 1990. As already described, most of the financial support for the PV roof program was a 70% investment subsidy (with all the downsides mentioned). I remember the times when we had discussions about what else was needed to make this demonstration program a success. A bi-annual meeting was established (“Glottertal meetings”) in the late 1980s where industry, institutes and ministries regularly came together. In the late 1980s a new director in the department of the German ministry responsible for renewables was appointed (Dr. Sandtner). He did not come from the technology sector (as most of his predecessors) but from a legal and legislative background. The technology-oriented community at the time had some reservation over his appointment as we – wrongly – thought that we needed more technical expertise to further develop our industry.
However, fortunately for our industry, he introduced new ideas. An important feature was that a law was passed by government stating that renewable kWh had to be preferentially accepted into the grid, plus a feed-in tariff of 8.3 €ct/kWh for all renewable technologies. While this feed-in tariff was only a tiny fraction of the PV generation cost of about 110 €ct/kWh in those days, it was a stimulus for growth in the wind industry in Germany which already had a comparable generation cost on a good wind site. Hence, more by chance than by design, for wind energy, this “Stromeinspeisegesetz – STREG” (electricity feed-in law) in 1990 was already a cost-covering remuneration for electricity from renewables on windy sites.
It was in the small town of Burgdorf in Switzerland that a law was passed in 1991 to remunerate PV electricity at a rate of 1CHF/kWh for 12 years. Fortunately, this legislative framework was positively supported by the director of the local municipality (IBB, Industrielle Betriebe Burgdorf). As a consequence, PV power installed per capita – suggested by Thomas Nordmann as an easy to remember illustrative number – was much higher in this town compared to the rest of Switzerland. Other local municipalities in Germany, like Hammelburg, Freising and Aachen, also introduced cost covering feed-in schemes for PV systems in their area of responsibility in 1993.
The introduction of a federal law on a technology-dependent FiT with a respective level to allow a positive return on investment, oriented by the ideas of Wolf von Fabeck and the experiences already described, was the big breakthrough in 2000, substantially driven by Hans-Josef Fell from the Green Party, Hermann Scheer from the Social Democrats and many more supporters at the time and thereafter.
5.4 Feed-in Tariffs – Sustainable Versus Boom and Bust Market Growth
Until 2007 Germany was by far the biggest PV market. This changed in 2008 after Spain introduced a similar feed-in tariff in 2007 which boosted new installations to 2.7 GW, the largest market for PV installations in that year. In 2009 the Spanish market disappeared from the landscape with less than 100 MW of new installations – why?
The success story of the German feed-in tariff (EEG) was soon adopted by many countries in Europe and globally. More than 50 countries have by this point installed a similar support mechanism. The first country to follow was Spain, which introduced a tariff that was much too high compared with what existed in Germany. Table 5.4 summarizes the situation in the year 2008 for the two countries. It can be easily seen that for similar system sizes there was almost the same tariff with two important differences: firstly, solar radiation in Spain is much higher, by about 50%, and secondly, the tariff in Spain was decided to be paid not for 20 years, as in Germany, but for 25 years (and even for the years thereafter with a 20% tariff reduction). Since the major components, the modules and the inverters, are traded internationally, there is not a big price difference between the two countries. Even if the project development and installation in a new market is slightly more expensive it can be concluded that the generation cost in Spain was about one-third less than in Germany. The return on investment in Germany was aimed at around 8% for private systems. Due to the conditions just stated, investors in Spain could make a double digit return for more than 20 years, which naturally attracted many people and companies.
Table 5.4 Different Feed-in tariff’s in 2008 for Germany and Spain.

Another important difference between Spain and Germany was the origin of the feed-in tariff budget: in Germany it had been decided to spread the cost among electricity users (with some exemption rules for large power sensitive industries) leading to a small increase of the electricity price. This “small increase” is estimated as follows. At the end of 2008 we had ~5 GW of PV systems installed in Germany, which with the sunshine in this country produced (~1 kWh/WPV) about 5 TWh. These TWh receive the above stated tariff of ~45 €ct/kWh, resulting in an annual cost of 2.2 billion € to be paid for 20 years. The value of these TWh at the stock exchange is not constant but varies according to the prevailing market conditions. If we take the average number of the past years which is about 5 €ct/kWh we obtain 0.25 billion €. The difference between paid feed-in tariff and stock exchange value – in our case 1.95 billion € - is called in Germany “annual Wälzungssumme” and the total amount in 20 years, if the stock exchange value were constant, would be 39 billion €, which would be the “total Wälzungssumme” or cumulative feed-in tariff budget. It is this number which is often used as a negative argument by opponents of such a support scheme. The real development until today and anticipated in the future will be discussed later.
If we take the annual budget for the year 2008 when we had ~5 GW cumulative PV systems installed and divide it by the total electricity consumed in Germany (minus the exempted big industries) of ~500 TWh one obtains 2.2 billion € / 500 TWh = 0.44 €ct/kWh. This is obviously a small addition to the German electricity price for households, which in 2008 was about 23 €ct/kWh (relative 1.9%). It should also be noted that the annual budget in real currency goes down by the inflation rate of 2% to 3 % per year, hence in 20 years the 2.2 billion € are only 1.3 billion € or 0.27 €ct/kWh which may be compared with the electricity price in 20 years of about 42 €ct/kWh, assuming a 3 % price increase per year (relative 0.6%). The “burden of a mortgage” as it is often called, is substantially decreasing in future years in real terms compared to today’s financial burden. This simple calculation assumes a constant electricity consumption in Germany. All in all there is a wide acceptance among the general public for this sort of support. It is the retroactive measures of different kinds which make the situation unpleasant because they create unforeseeable risk, which makes financing more difficult, at least more expensive: additional taxes introduced in the Czech Republic, additional exemptions for industrial companies in Germany and unfortunately other retroactive changes in Europe.
With the exceptional PV installations in Germany in the years 2010 to 2012 with ~7.5 GW each year the cumulative installed PV power increased to ~33 GW at the end of 2012, which is a factor of ~6.5 compared to 2008. Due to the digression of the FiT the budget for the additional installations did not grow proportionally but with only by a factor 2.5 towards ~5.4 billion €. With the same calculation as for 2012 we have at the end of 2012 an additional 1.1 €ct/kWh for PV which is a total of ~1.5 €ct/kWh for all PV installations. For a household in Germany with an electricity consumption of 3,500 kWh this means a monthly addition of ~4.4 € to the electricity bill (for the total FiT including all renewable technologies this is 15 €). When listening to the agitated discussion in politics where in particular PV is blamed for “unaffordable electricity prices” I wonder whether one pack of cigarettes or preferably four scoops of ice cream per month are no longer affordable. The goal of this negative campaign is, for me, the ultimate attempt to have at least a quick and dramatic decrease in additional unwanted decentralized PV systems in Germany. A recent study by Prognos [5-2] concluded that with the current compensation in the EEG law an increase of the share of PV electricity from 4% in 2012 to 6.8% in 2016 – which is a 70% increase – would add less than half a cent per kWh – which is only 1.9%.
In contrast, the situation in Spain is one where most of the budget had to be paid by a ministry from tax money. As everyone knows, budgets are scrutinized every year and unforeseen expenses are very much disliked. And this is exactly what happened there: after introducing the generous tariff in 2007 it took many months to get approval due to bureaucratic hurdles. Hence, the minister did not notice how many applications were in preparation and when the green light was given for so many systems, in 2008 the minister could only watch as his budget shrank with each additional MW of installed PV systems. He did what he had to do in this situation in order to regain control of his budget and decided on a fixed cap of 500 MW for 2009 and thereafter- an upper bound that was never reached because investors found themselves in an insecure situation. The lesson learned was that, for a sustainable and long-lasting support scheme one cannot rely on budgets from ministries. It should also be mentioned that the tariff which was too generous also provoked a number of “black sheep” who were tempted to misuse this support, e.g., asking for unreasonable prices for necessary grid interconnection points – so it is important to keep the return within a reasonable range and not to overdo it. A similar boom and bust market occurred in the Czech Republic in the year 2010 with 1.5 GW and then a hard stop with almost nothing in 2011.
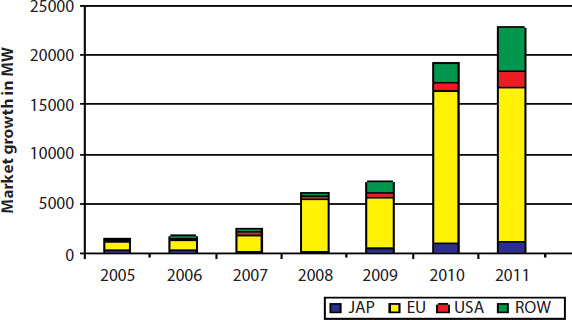
In 2009 it was Germany who once again led the new installations with 3.8 GW and the big increase in 2010 was in large part due to the 7.4 GW installed in Germany. Fortunately, new markets in Europe and worldwide also started to add significant installations, notably the European countries Italy, the Czech Republic (but see above the described bust in 2011), Belgium and Spain as well as the non-European countries the US, Japan, China and Australia.
When comparing installation numbers in different sources one should take a close look at the definition used. At the EPIA (European Photovoltaic Industry Association) we used the PV installations in a given year which were grid connected and monitored by official bodies in the respective countries. This gives the most trustworthy number for a country. However, especially in times of end-of-year-rallies, a lot of systems are installed in the last quarter in order to receive the tariff from the running year before the next digression starts (mostly in January), the numbers for “grid-connected” and “installed” PV systems can vary considerably. For example in 2010 there were two countries, Italy and France, which in addition to the grid-connected systems installed about 3.5 and 1.35 GW, respectively, which could not be connected to the grid for time reasons. In our EPIA market report for 2010, a global market number of 16.6 GW and 27.6 GW for 2011 was given. In other studies counting installed systems you find higher numbers for 2010 and lower ones for 2011, which can easily be understood by just looking at the installed systems for these two countries. For installed systems this gives a number of 16.6 + 4.8 = 21.4 GW for 2010 and 27.6 - 4.8 = 22.8 GW for 2011, which is comparable with many other studies discussing installed systems. The two approaches also have a severe consequence: the “grid connected” approach shows a huge growth of 66% from 2010 to 2011, with Italy as the biggest contributor in 2011 while the “PV installed” approach shows only a moderate 6% growth with Germany as the biggest contributor. It should be mentioned that in the numbers above, I assume that no significant installations in 2011 were made without also connecting them to the grid in the same year. A word of caution: always pay attention to which methodology is being used when comparing market numbers from different sources.
It is also interesting to see the cumulative PV installations in the main geographic regions as summarized in Figure 5.6. Due to the large growth in 2010, it can be seen that in this year alone, the volume of PV installations was almost the same as over the last 30 years. At the end of 2011 we had about 67 GW PV installed and in late 2012 we surpassed the 100 GW level globally. Let us compare this with the utility scale power producing technologies in two directions, power-wise and energy-wise.

On a sunny day the power of all PV installations is around 85 GW – the variance from the 102 GW number is accounted for by the power at standard test conditions (these are measured at 25°C and printed on the data sheet) minus the difference to the actual power given by the respective solar radiation (direct and diffuse) in the field (for the temperature influence on efficiency see the later chapter on technology). These 85 GW are equivalent to the power output of 65 full-size nuclear 1.3 GW reactors! The energy production in a year is also quite remarkable. If we cautiously assume a 1.3 kWh/WPV2 number for all systems globally installed we obtain 110 TWh electricity produced which is equivalent to the energy output of 12 full-size nuclear 1.3 GW reactors (assuming 7,000 hours per year running time). In this context, one may compare the planning and approval time with the time needed to construct and commission just one nuclear reactor – 10 years is very optimistic. In only 5 years (2008–2012), Germany installed some 27 GW PV with an energy production of about 3 nuclear reactors. Once the question of energy storage has been economically solved – which again is just another technology development and also boosted by e-mobility – the portfolio of renewables will outpace the traditional energy technologies in a surprisingly short period of time.
In only 10 years, from 2000 to 2010, the manufacturing landscape completely changed. When comparing Table 5.3 (Top 10 in 2000) with Table 5.5 (Top 10 in 2010) one can see a remarkable development. In 2010 the spread for the production volume in absolute numbers was between 2 and 40 MW, while 10 years later it was a staggering 600 to 1600 MW. Other important observations can be made for this same time interval. One is the fraction of “the other” manufacturers, which increased from about 20% in 2000 to 50% in 2010. Another is the change in regional distribution: From the four Japanese Top 10 in 2000, Sharp invested most quickly and gained a 30% market share in 2004 and 2005 when the runner-up only had a market share of about 10%. A strong increase in production was accomplished by German newcomers, like Q-Cells and Solar World. For example Q-Cells, which was founded in 1999 and produced its first solar cells in 2001, went straight to be No. 1 in 2007, overtaking Sharp and followed by the first big Chinese manufacturer Suntech. Due to a major support scheme in China to conquer the world production for solar modules by offering billions of $ of investment money (more than 30 billion alone for capacity increase) the number of Chinese newcomers increased their production in a short period of time. As seen in Table 5.5 the regional distribution in 2010 comprised five Chinese companies, two Taiwanese, and only one each for US, EU and Japan.
Table 5.5 Top 10 solar cell producers in 2010.

The further development until 2012 is shown in Table 5.6, again with major changes in such a short period of time. First the total volume increased by 50% and the share of the Top 10 decreased to ~40%. As the numbers for the companies below Top 6 become quite similar there is also some uncertainty. For example the report by IHS based on production numbers no longer features Sharp but lists the Singapore based company Flextronics in its Top10. The future of Suntech is also open, since they have filed for bankruptcy.
Table 5.6 Top 10 module manufacturers in 2012 (source: Solarbuzz).

It is astonishing to see that China which has been the No.1 in solar thermal collector production and installation for some time, is making a major move to also become No.1 in solar and wind. In other words, China is preparing to lead the most promising growth industries for the coming decades. Within the running 5 year plan (2011 – 2015) which has a budget of about $1.3 trillion they are not only willing but also able to make this happen. The next step will be to grow the Chinese market for PV installations in a similar way to what they achieved with wind installations. It should be no surprise that China will be No. 1 in new PV installations within the next years and with ~13 GW new installations in 2013 they have been the country with most PV systems installed.
The balance in production volume of the single highest value item of a PV system, the module, and the respective market size in the various worldwide regions is shown in Figure 5.7 for the time between 2000 and 2010. In 2000 there was a good balance with only the US producing significantly more than its market share. The increase of the EU market share from slightly less than 20% in 2000 to 80% in 2010 did not result in a similar growth in module production, which in fact declined from slightly above 20% in 2000 to about 15% in 2010. The big winners were China and Taiwan, growing their production share from nil in 2000 and to well above 50% in 2010. Japan is particularly interesting, as it managed to more or less keep the balance between market and module production share. It should already be highlighted here that this comparison does not show the whole picture. As will be described in a later chapter the real value added in a national economy is much higher than can be anticipated from the picture above, because the imported modules from China and Taiwan contain a number of value added components created in Europe, e.g. materials (poly silicon, screen printing pastes, encapsulation materials) and production equipment.
Figure 5.7 Market allocation versus regional production of PV modules.

5.5 PV Market Development Towards 2020
It is always a challenge to make projections of the market development for any industry – it is even more difficult to do so for an industry which has been driven by various support programs which cannot simply be extrapolated to the future in a business-as-usual mode. This was already described in the sections before for some countries. The strong growth in recent years meant that we grew almost “unnoticeably” to a size where all of a sudden considerable business was taken away from the traditional utility sector. This will certainly result in a reaction and in Germany and also Italy, the two biggest deployment countries, there is a severe argument pushed by the traditional energy sector and supported by biased politicians that the growth of PV installations should be stopped and that for example in Germany they should even be cut back from 7.5 GW down to 3 GW and less for the rest of this decade. This is a shame and a scandal and definitely fails to realize the great potential of decentralized electricity production by PV in combination with low voltage smart grids for the future. On the other hand we have the new countries which have just started to realize the positive impact of PV on their future power supply. Important examples are China, India and also the US as well as some South American countries and South Africa.
In this context, a bottom-up approach is difficult but still useful if a range is defined within which each of the regional markets could develop. At EPIA, a useful time horizon of 5 years is taken and repeated in a rolling year to year approach. Thereafter, we will also consider a top-down approach for a slightly longer time period until 2020.
5.5.1 Bottom-up Epia Market Forecast (2013 to 2017)
Every spring, our EPIA association has its annual general meeting where most of the members convene. This is a very good opportunity to take an additional day to discuss the global market of the preceding year and also to make projections for the coming five years for all relevant regional markets. As our members come from all over the world they can provide an in depth on-site contribution from their respective countries. The EPIA office sends out a questionnaire a couple of weeks before the assembly, asking each member to provide their best estimate for all the markets they have good knowledge of under two assumptions. The first which is called the “moderate” scenario should only take moderate political support schemes into account. The second, called the “policy driven” scenario assumes the best respective support scheme in all countries being considered. The big question remains what impact an assumed support scheme will ultimately have on market size. In Figure 5.8 the result of the EPIA market workshop from March 2013 is shown. As can be seen, the expectation in the moderate case was even a possible decrease of the global market and in the policy driven scenario a potential increase to 47 GW for the then running year 2013. A realistic range for 2013 could be around 37 GW. Also for the later years a much lower growth of between 9% and 22 % is anticipated compared to the average of 51% per year for the decade before.
Figure 5.8 10 year history and two 5 year bottom up forecasts of the cumulative PV market: low growth (yellow) = moderate (Business as usual) and high growth (red) = policy driven
(source: EPIA “Global Market Outlook 2013–2017”).

5.5.2 Top-down Epia Market Forecast (“Set for 2020”)
The SET plan – Strategic Energy Technologies – was adopted by the European Union in 2008 with two major timelines:
The long term goal is set for 2050 and targeted at limiting climate change to a global temperature rise of no more than 2°C, in particular by reducing EU greenhouse gas emissions by 80% – 95%.
For 2020, this plan provides the basis for the development and deployment of low carbon technologies in order to reach the well-known 20-20-20 goals by 2020: 20 % reduction of CO2 emissions (even 30% in reduction is foreseen under some boundary conditions), a 20 % share of renewables in the end energy and 20 % increase of energy efficiency.
In a study by the European Commission it was found that with the current trend we are not in line with either the reduction of CO2 or the renewable portion for end energy. The gap that was found is quite substantial. With business as usual, the predicted CO2 reduction was merely at only 15% – far away from the 20% or even 30%. The 20% end energy, which amounts to 3,200 TWh (a total of 16,000 TWh was expected in Europe (EU 27) as end energy in 2020) was found for a business as usual case to be only at about 2,000 TWh – so there is a large gap of 1,200 TWh which has to be closed. Photovoltaics at this point in time was generally not believed to be able to contribute a major share to electricity production. Therefore, EPIA launched a study “SET for 2020” (in analogy to the more general SET plan described before) together with the consultancy company A.T. Kearney to analyze in a top-down approach three growth scenarios and their potential impact on closing the above gap.
When the study was carried out during the autumn of 2008 and summer of 2009 we knew that the global market in 2008 which was 6.2 GW with Europe making up about 5 GW; the cumulative installations in Europe at the end of 2008 were 10 GW. Taking a look at the envisaged electricity consumption in 2020 we obtained the figure of 3.850 TWh from the EU Commission (corresponding to an increase of 20% over 2010 electricity consumption). This brings us to the three following scenarios: (a) “baseline”, providing 4%, (b) “accelerated” with 6% and (c) “paradigm shift” aiming at 12% of the EU’s electricity produced by PV (see Figure 5.9). In order to reach the necessary 150, 230 and 460 TWh for the three scenarios, a cumulative installation of 130, 200 and 400 GW would be needed. In order to see what global growth would be necessary to reach these European numbers, we made the simplified assumption that the market share of Europe would continuously decrease from about 80% in 2008 to 50% in 2020. The resulting annual global PV market was then calculated to be 90, 110 and 160 GW for the three cases. The required growth rates between 2010 and 2020 would then have been 26, 28 and 34% per year, assuming a 9 GW global market in 2010. When looking at Figure 5.8 it can be easily seen that even the “paradigm shift” scenario should be do-able. But reality makes it even better. As outlined earlier, the actual installations in 2010 were about 21 GW which decreases the annual growth to the very moderate levels of 16%, 18% and 23%. An important finding is the significant contribution PV can make to closing the above mentioned gap of renewable TWh: with the paradigm shift scenario the 460 TWh would contribute more than a third to the needed 1,200 TWh.
Figure 5.9 EPIA top-down market forecast until 2020.

Why did we call the high growth scenario a “paradigm shift”? During the course of our study we analyzed in more detail the ten most important countries within the EU 27 (to which we added Turkey and Norway) with respect to their potential cumulative PV installations and contribution of the needed TWh. Obviously this has to be connected to the specific country electricity needs and also to the irradiation conditions, as in our study we did not consider the transport of PV produced electricity from one country to the other. The six most dominant countries are summarized in Table 5.7 which account for 71% of cumulative installations and 74% of produced TWh. Especially the last line, the %-PV penetration of the country’s total annual electricity consumption, becomes an important parameter when adding more and more GW of PV in a country. For Germany, this is impressively demonstrated in a simulation done by the former institute ISET, now IWES in Kassel (Germany) and shown in Figure 5.10. The upper envelope of this graph shows the load curve in Germany for a typical summer week (here June) starting on Monday (day 1) through Saturday/Sunday (days 6 and 7). During the week there is a total load of between 40 and 60 GW with a pronounced peak load in the respective afternoons. Weekends typically show a reduction of the load to between 30 and 50 GW. At the time the simulation was done, we had 17 GW of wind power installed in Germany which for the particular June week was added as one contributor to the load curve. With the assumption of a homogeneous distribution of PV systems throughout Germany incremental steps of 10 GW PV systems were added and their output according to the actual insulation data of the June week considered can be seen in the graph. A first important fact is that PV obviously adds very efficiently to the afternoon peak load and reduces the otherwise needed power from peak load power stations. Up to about 30 to 40 GW PV installations, just the peak load is taken away. However, when adding additional GW’s this power digs first into the medium power and then also into the base load power generation from utilities. The priority access of renewables to the grid causes additional challenges because traditional fossil and nuclear power stations have to reduce their power output when renewable power is available; because this is rather difficult with nuclear and coal fired power stations, utilities who run those units prefer to sell their electricity to neighboring countries for free, sometimes even to pay for accepting those ‘too many’ kWh’s of electricity. Taking the 80 GW needed in Germany for the paradigm shift scenario and comparing this to the 50 GW shown, it can be clearly seen that for the Sunday afternoon the 100% load would be covered by PV alone – and all other power stations in Germany would have to be shut down in these few hours. Another important finding is the rise of a new peak load in the early evening hours – this is the first indication that additional measures must be taken when adding more and more renewables. Just imagine if we had 200 GW PV in Germany alone: most of the energy would have to be stored as the load in Germany would not absorb the actual power delivered. These additional measures are described in the next section and because of this we called this scenario a “paradigm shift” as a lot more has to happen besides installing additional GW’s of PV. The main reason why in our study we allowed for a higher fraction of PV produced electricity in southern countries compared to more northern ones is the fact that in these countries the maximum load not only occurs in the afternoon – as is the case in the northern countries – but also occurs in summer, when most TWh of PV electricity are produced (Northern countries typically show a higher load in winter times).
Table 5.7 PV deployment in focus countries under the paradigm shift scenario.

Figure 5.10 Electricity coverage of increasing PV installations in Germany from the country wide electricity load for a typical summer week.

5.6 Total Budget for Feed-in Tariff Support as Positive Investment for National Economies and Merit Order Effects for Electricity Customers
There is no doubt about the positive and outstanding impact of the feed-in tariff as the most effective support mechanism for renewable market development. This very positive element has of course been challenged by liberal economists, traditional utility companies and politicians with the major argument of it being too costly and a burden on the national economy. This section describes the opposite, namely that if all the budgets are seen as an investment for the respective country then, even if we apply conservative assumptions, we arrive at surprisingly a high Return on the Investment or a positive Net Present Value for this investment.
A first analysis of the additional value of a PV produced kWh compared to a gas fired peak power station (CCGT) was made in a study by ISET (now IWES) and published in the annual symposium in Staffelstein [5-3]. The annual report by LBBW “Valuing the invaluable” in 2008 [5-4] also analyzed which value in addition to just being another kWh electricity PV can offer, for example by introducing the concept of a “hedging value” for PV. Building on these results a major effort was undertaken within the previously mentioned EPIA study “SET for 2020”. The basic ideas were as follows:
- PV systems do not emit CO2, which is one value to be positively considered in relation to fossil power plants. As PV systems are able to replace peak power electricity production, a comparison with gas fired CCGT peak power plants was made. The CO2 emission for these plants have been calculated as ~330 g/kWh and assuming a future average market price for CO2 certificates of €38 per ton of CO2 this results in a saving of €ct1.2/kWh by using PV (for oil and hard coal power plants this number increases proportionally to their increased emissions). If other market prices for CO2 are considered this number changes proportionally. Although in Europe in 2013 CO2 certificates are traded at less than €5/t-CO2 this is unnaturally low for two reasons: first, a large number of such certificates was given to the industry for free when this trading started and secondly there is less industrial value creation in Europe due to the economic crises. Once this distortion is overcome we may return to certificate prices which really help cut down CO2 emissions.
- PV can be treated as a hedge against increasing electricity prices. Once PV plants are installed there is only little running and maintenance cost for more than 25 years (which is the warranty many PV module producers are giving on their product). This implies that an investor can reliably assume that his generation cost for electricity over this time period will remain constant. This is very different in the case of traditional electricity production. In the gas fired power stations running in Europe we currently use about 40% imported raw materials. This number is forecast to rise to 70% in 2020 (and most probably even higher in later years). As the gas price has a high share for CCGT produced electricity any change in highly volatile oil and gas prices will have a pronounced effect. In the LBBW study two hedging values of €ct1.5 and €ct3.1/kWh were discussed. The higher value would be consistent with an oil price scenario of $85/barrel in 2009, $110/barrel in 2012 and $135/barrel in 2018. The low value is consistent with 50 $/barrel in 2009, 63 $/barrel in 2012 and $100/barrel in 2018 (side note: when the study was carried out in 2008/09 one could have imagined the low price scenario, today in 2013 everything indicates towards the high price scenario). There is an even easier way to understand the magnitude of these two hedging values: a market study from the utility sector [5-5] shows a long term development in traded electricity prices between 2014 and 2034 of ~90 to ~€120/MWh for peak electricity (3,120 hours/year) and ~65 to ~€85/MW for base load electricity (8,760 hours/year), respectively. The price difference from the starting point in 2014 continuously increases towards 2 and €ct3ct/kWh over the 20 years, which equals a constant price difference of 1 and €ct1.5/kWh, which is the hedging value for the base load and peak electricity case mentioned above. If in future we also have a liberalized utility market in Europe, we will experience an even higher price for afternoon peak hours like in the US and Japan, where the above described increase over 20 years may well be in the range of 40 to €60/MWh, corresponding to a hedging value of 2 to €ct3/kWh. In summary, it is realistic to assume a hedging value for PV electricity in the range of 1.5 (low case) and €ct3.1/kWh (high case).
- In the EPIA study some other parameters were analyzed, like reduced grid losses (+€ct0.5/kWh), but also factors which reduce the value of a PV kWh like operating reserve (-€ct1.0/kWh) and lost margins for utilities (-€ct0.6/kWh).
Adding up all the above described individual value numbers in €ct/kWh gives:
(reduced CO2 1.2) + (reduced grid losses 0.5) + (hedging value low case 1.5 or high case 3.1) - (operating reserve 1.0) - (utility lost margins 0.6) = (added PV value 1.6 for the low or 3.2 for the high hedging value)
We now did what every investor in the industry is doing: taking an investment, including all financial costs associated, and summing up all the revenues generated in later years by the investment. All the annual benefits are then discounted and a Net Present Value (NPV) calculated (major assumptions were a real discount rate of 3% and an increase for electricity prices of 2% between 2010 and 2020 and, very conservatively, constant thereafter). Only if this number is positive the investment pays off. In addition, if more than one potential investment can be done then the one with the highest Net Present Value should be executed as this one is the most rewarding.
In our case the investment is the total budget for the FiT needed to reach a certain growth scenario – the EPIA study looked at the three cases already discussed: base case, accelerated case and paradigm shift – and the benefit is the annually produced electricity multiplied by the “added PV value” described before. It is no surprise that for the three growth scenarios in Europe we had three different total FiT budgets: €155bn, €182bn and €235bn for the baseline, accelerated and paradigm shift scenario, respectively, as shown in Table 5.8. The calculated Net Present Value is shown for the three growth scenarios using the two hedging values in Table 5.8. A first important observation is that for all six calculations there is a positive NPV, even if small for the low growth and low hedging value. It is surprising to many that the NPV becomes significantly higher for the higher investments in the accelerated and paradigm shift scenarios. But when we remember that we have a decrease in the PV generation cost in later years due to the yearly digression and much more TWh produced for the higher growth scenarios this can also be understood qualitatively. Consequently, for a society it is not a burden to pay the early investors a feed-in tariff to stimulate volume but is in fact a clear positive investment. When seen over time, those PV systems produce clean and ever cheaper electricity.
Table 5.8 FiT budget and Net Present Value (NPV) for three growth scenarios.

As renewables (until recently mainly wind, but increasingly now also PV) increasingly enter into the area of trading electricity, there is an interesting phenomenon called “Merit Order Effect” which makes traded electricity cheaper because of the input of prioritized electricity from renewables. An example to explain this: taking a look back at Figure 5.10 shows that on a sunny weekday the traded electricity in the afternoon is typically at a high price because peak power stations have to provide this peak without renewables. If, however, PV is providing this peak electricity then the more expensive peak power stations don’t have to be switched on and the traded price goes down. There have been a few times in Germany with strong wind conditions when the traded price even became negative. In general it is always the most expensive power stations which are shut down when renewable power comes onto the grid. This is why renewables have already shown an impact in reducing prices for all customers, even for those energy intensive companies who are exempted from paying the few cents per kWh which are used to pay the annual budget of the Feed-in tariff – which is obviously unfair to the many private households paying for this effect. With an increasing share of PV and wind power we have to redefine the value of those produced kWh’s which will become a challenging task.
5.7 New Electricity Market Design for Increasing Numbers of Variable Renewable Energy Systems
Today (2013) we are in a critical and highly sensitive situation. Looking at the example of Germany, it can be summarized as follows: First, we have the political goal to stop the EEG when cumulative PV installations will have reached 52 GW. Depending on the annual installations this may happen in about 2017 (+/− 1 year). Second, the increasing volume of PV and wind will cause a further significant decrease in the price of traded electricity (due to Merit Order effect); lowest prices which may even be negative will be seen at times when wind and/or PV are supplying power equal to or above the load curve.
If we do not change our current electricity market landscape we will face the challenge of how to encourage self-consumption, i.e. consumption of electricity generated with decentralized renewable technologies like PV independently of the grid, and how to absorb electricity at meaningful prices into the grid when it cannot be used at the producer’s site. Several aspects have to be considered after the expiration of the EEG:
- Continuing the existing EU directive on priorizing grid access for all renewables
- Self-produced electricity should not be taxed, at least for private households - otherwise one could also start asking for a taxation of vegetables grown in the own private garden
- The value of a PV kWh both for the owner of the PV system and society is at its highest when it is self-consumed: for the owner because he compares his retail price with the LCOE (Levelized Cost of Electricity) of his PV system (including storage, DSM (Demand Side Management) and IT (Information Technology) to boost self-consumption) and for society because those kWh do not use the grid infrastructure and services
- The direct sale of self produced electricity should be allowed to neighbors within the Low Voltage Grid area, like decided by a new law in Italy early 2014
- For all electricity from PV systems that is not self-consumed we have to develop a suitable model for calculating a fair value of those kWh’s with municipalities and other electricity providers, DSO’s and TSO’s (Distribution System Operators and Transmission System Operators). We should not work with price finding mechanisms from the past but should find new models based on a future renewable Energy world – it cannot be that those who invest in PV systems (and other renewable technologies) receive (almost) nothing for their kWh’s because an outdated stock exchange mechanism is used which was developed for other framework conditions.
It will take a major effort to make this change happen. As we have to significantly change well established patterns, all stakeholders have to be involved with political moderation – a lot will depend on having the “right and forward looking” political guidance. One important aspect: should the traditional energy sector not make substantial efforts for the fair integration of renewables with suitable market mechanisms it may force many home owners and SMEs to quickly shift to 100% autonomy. Should this prove to be financially successful it may cause the floodgates to open.
5.8 Developments for the Future Energy Infrastructure
5.8.1 Smart Grids as the Future Low Voltage Grid, Distribution and Super Grids
The existing electricity grid – everywhere – originates from a time when big central power stations produced base and medium load electricity with some peak power stations closer to the users. There was only one way for the electric power, namely from the big power station via the very high AC network (360 – 500 kV) first to the distribution grid (20 – 50 kV) and from there to the local low voltage grid (380 V) from where it was finally directed to the individual customers, households or small businesses. The houses were normally equipped with a meter which still in most cases electromechanically counts the electricity used. This technology has now been in use for many decades and does not contain any intelligence. The described situation will change dramatically in the coming years and has started in a few countries with first steps. For example, in the late 1990s Italy introduced the first smart meters in houses. In existing liberalized electricity markets the need to also charge households with different tariffs is already in use for example in Japan and the US. This will also be the case in future, gradually in all regions. It is the low voltage grid which until recently could be seen as “a stupid grid” as there was no possibility to actively take part in the distribution of electricity but only to react to the needs of the consumers. This will have to change in the future if we seriously move to a renewably powered world. Here we have to collect electricity produced by all renewables in the best possible way and make an optimized portfolio of the various renewable technologies – which will be different in future for the various countries. So far, customers were mere consumers of electricity, but with a PV system or other generators in the house they will also become electricity producers; sometimes this future customer is called a “pro-sumer”.
Figure 5.11 summarizes the situation of the various grid levels. We start with the green circles symbolizing the low voltage grids in a country. In the lower row this is shown for an urban situation, where a cluster of several low voltage grids is in close proximity (a) and for a rural case, where two situations are sketched for a larger (b) and smaller (c) grid area. It will be this low voltage grid which will develop and become the smart grid of the future. While “smart” today is unfortunately overused, in this context it nicely describes a variety of intelligent ways which were not in use until now.
Figure 5.11 Low voltage (LV) Smart Grids, distribution grids and high voltage Super Grids.

On top of the medium voltage distribution grid the notion of “super grid” is often discussed. The best known are the 360 kV to 500 kV AC transmission lines which have the disadvantage that they have high losses over larger distances. Although there are still possibilities to enlarge the transported electricity with such HV-AC grids (for example by allowing higher temperatures in the cable) this is limited. Thanks to the developments over the last two decades with high voltage DC grids, this is no longer an issue: with a 500 kV DC the losses are only about 3% per thousand km of electricity transported. This makes them ideal for trans-national electricity transport and to integrate them into future off-shore wind-parks. Whether this trans-national super grid could evolve into a worldwide super grid (which will be discussed in the last section) remains to be seen and depends mainly on the cost development for storage systems in all different sizes and storage times.
5.8.2 Supporting Measures for the Future Energy Infrastructure
Just a few ideas on what a future smart grid with intelligent meters and local production of renewable electricity will offer:
- The electrical appliances of households are closely monitored and controlled by the intelligent meters and optimize the self-consumption of locally produced electricity. The weather forecast for the coming 24/48 hours is also integrated to steer some of the appliances in times of highly probable electricity production from PV systems and adjacent wind power systems.
- In parallel to the well-known AC circuit, future houses may well have an additional DC grid as many appliances already run with DC power today (for example lighting, communication equipment and more). Households will also be equipped with a DC battery bank of 10+ kWh storage capacity to shift some of the afternoon produced PV kWh’s to the evening. The batteries used here must only fulfill the lowest storage cost for electricity; weight is not an issue for this application. Hence the well-known lead acid battery may still have a long life of usage ahead of it. A medium time goal is a storage cost of 5 to 8 €ct/kWh. Future inverters will also actively take part in the service of the low voltage grid, for example by providing needed reactive power. In addition, an optimized balance between DC power from the house-integrated PV/battery system into the parallel DC circuit of future houses, and feed-in of the unused kWh into the local low voltage AC grid will also be done.
- The family electric car with its battery is also integrated into the optimized production and usage of electricity in the respective household. These batteries have to be optimized in two directions: they must not only be low cost per kWh stored but also have a high ratio of kWh per kg battery weight. This is the main reason for today’s Li-ion battery systems in this sector.
- An interesting approach for future electric cars is the range extender offered with the Ampera from Opel (similar also in US by CM) and the brand-new BMW i3. These cars run purely on electricity with all the advantages that brings with it (for example future wheel hub motor). But when a longer distance has to be covered, a small turbine recharges the battery while driving. It could be an interesting option to consider this range extender (running with biofuel or gas produced by renewable electricity driven electrolysis to form hydrogen and by adding CO2 to get CH4) being used as a power and heat generator in the house during night and winter when needed. A quick calculation for Germany demonstrates how this idea could help overcome the often discussed challenges for power supply when no wind and no sun provides power: at a 20% share of electric cars (~10 million e-cars) where half are equipped with a range extender (average power 20 kW) this fleet could provide 100 GW power – which is more than the highest power requirement in Germany during the year. This would of course need an integration of the e-cars into the Smart-Grid and IT network.
- All produced kWh not used in the own house are offered to the neighboring households, SME’s and offices within the low voltage grid area. A new business opportunity for municipalities will develop as they can efficiently store all locally produced renewable electricity not currently used in the local grid in a larger battery bank in the transformer stations which will also communicate with other adjacent smart grid areas. Battery sizes could be in the MWh+ range and use Na-S battery systems for example. Such high temperature systems are not useful in households but can be well managed in a professional environment and offer lower cost per kWh stored electricity – a goal of below €ct5/kWh is realistic. Other storage technologies for this use could be redox flow type batteries which due to their costly infrastructure per unit (pumps and storage tanks for the electrolyte) have the advantage of larger capacities and due to their very low discharge they are well suited for storing electricity over longer periods of time.
These are just a few ideas and some food for thought when it comes to the future of smart homes, electro mobility, smart grids and intelligent interaction with local municipalities. The latter can effectively serve as a connection to the multitude of other municipalities via an exchange of information and electricity. Multidirectional transport of electricity within the smart grid areas is done with the medium voltage distribution grid. Input also occurs through wind parks and larger PV parks.
2 A PV system installed in a northern country like Germany produces 1,000 kWh/kWPV or 1 kWh/WPV and in regions like southern Italy this number is almost 2 kWh/WPV; hence the assumed average should be conservative.