Chapter 7
Tying Off a Few Data Vault Loose Ends
A quick glance at some more advanced topics
The basic building blocks for a Data Vault have a delightful elegance – there are just Hubs, Links, and Satellites. I love the pattern. But within this simplicity there are many variations. Perhaps one could compare Data Vault to Lego® bricks. The Lego I first encountered some years ago had a few limited sizes, and a few colors, and that was it, yet there was enormous potential to create all sorts of structures.
Data Vault, too, has several recognized ways of putting together the basic building blocks. A few are mentioned below, but there are more. I do encourage you to buy the books, attend the courses and conferences, and participate in forums. This Data Vault primer is most definitely not intended to replace any such formal knowledge acquisition. But the following topics may prove to be helpful in building your foundations for Data Vault success.
Hierarchical Links
In traditional data modeling, we encounter self-referencing relationships, where a Foreign Key points to the Primary Key of another row in the same table.
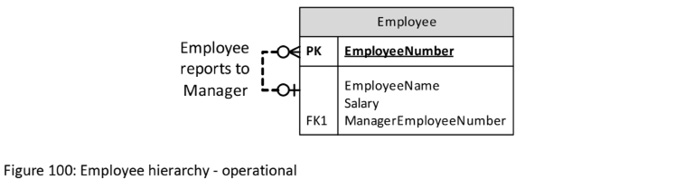
A simple example might be a table of Employees, with Employee Number as the Primary Key. Each Employee (other than the most senior “boss”) may identify their manager by using their manager’s Employee Number in a Foreign Key relationship. [Some might argue that the employment hierarchy should involve an Employee table and a Position table, but that’s a separate topic. For the sake of introducing Hierarchical Links in Data Vault, I am choosing to present a simpler model.]
Figure 100: Employee hierarchy - operational
Another example might be an Organization Unit table, where individual Organization Units reference another Organization Unit to which it “belongs”.
The Data Vault equivalent of these operational system self-referencing relationships is a Link known commonly as a “hierarchical” Link. In almost every aspect it really is just an ordinary Link, but with each instance in a hierarchical Link pointing to two Hub instances in the same Hub table, for example an Employee Hub instance for a subordinate and an Employee Hub instance for the related manager.
Figure 101: Employee Hierarchy – Data Vault

Same-As Links
One commonly quoted usage of a Same-As Link is to associate multiple customer instances in a Customer Hub that actually represent the same real-world customer. Maybe a few years ago Sam Smith dealt with the company, using Customer Number Cust123. Now, some years later, Sam turns up again and starts buying. The “correct” process may be to recognize Sam as the same person, and get them to use the old Customer Number, but the process breaks and Sam gets a new Customer Number Cust456.
The Data Vault ends up with history for purportedly two separate customers. Subsequently, a cleanup initiative involving the source systems spots the duplication, or maybe an operator identifies and records the duplication. We don’t want to rewrite history by merging data in the Data Vault. That breaks the trust in its audit trail. So what do we do? It’s simple. We create a Same-As Link that has two Foreign Key relationships, one to point to the “old” Customer Number, and one to point to the “new” Customer Number.
Figure 102: Customer Same-As Link

Reference data
Often our IT systems have what many call “reference data”. Examples could include a collection of country codes and names, a collection of order status codes and names, or a collection of employee gender codes and names. There are a variety of ways to manage reference data within a Data Vault. Let’s begin the discussion by looking at an example from a banking scenario. In the operational system, we’ve got Customers, and they are classified according to some Customer Type reference data. A simple reference table could look like this:
Figure 103: Customer Type - no history

We’ve already decided that the Customer from the operational system is to be loaded to a Data Vault Hub. But where do we load the Customer Type reference data?
One of the first questions to ask is whether or not the history of changes is to be kept. We could use the data structure from the above operational table structure directly in our Data Vault if we only want the current values for a given code. As an alternative, if we want our Data Vault to hold the history of slowly changing values in our reference table, the following table structure might do the trick. Each time a Customer Type Name or Description changes, we can add a new row holding a snapshot of the new values, while retaining the previous values, too.
Figure 104: Customer Type - slowly changing history

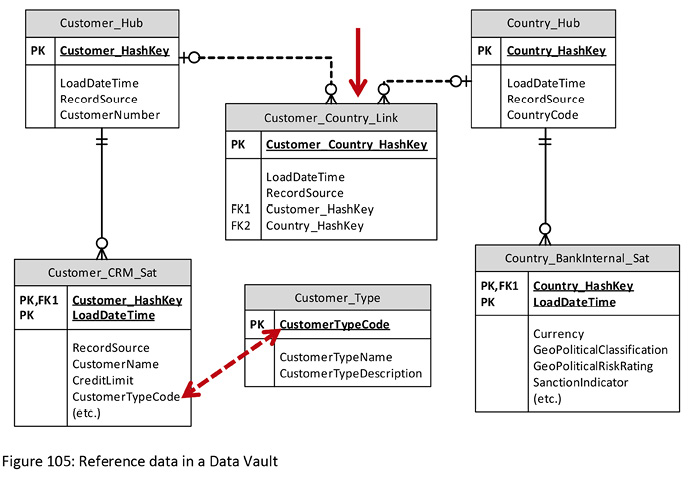
Maybe Country is another reference set for customers, recording their country of residence. In this scenario for the bank, let’s assume that Country is not just a simple code-&-description reference data set. Instead, it is its own business concept with a recognized business key, and its own rich set of attributes, including recording the currency for each country, a geopolitical classification, a perceived risk of lending to customers in that country, whether or not the bank’s head office recognizes political sanctions on trading with that country, and more. In such a case, maybe “country” could be seen as a Hub in its own right, especially if it has its own rich set of relationships with other Hubs.
The below diagram shows both scenarios. Country is modeled as a completely standard Data Vault Hub-&-Satellite structure, with a Link associating it to the Customer Hub. In contrast, the Customer Type Code attribute in the Customer’s Satellite holds just the code, and this can be joined to the identical code in the Customer Type table.
Figure 105: Reference data in a Data Vault
Two things are to be noted:
- The Customer Type table can be assumed to be a table within the database that also holds the Data Vault Hub, Link and Satellite tables, even though it does not follow the Data Vault construct.
- The dotted line does not represent a Foreign Key relationship defined within the database. It is a logical construct – the codes can be joined, and perhaps we may wish to create a relational view involving these codes, but in a Data Vault’s Satellite we most definitely do not want a Foreign Key definition, let alone attempt to enforce referential integrity. The reason for this is we don’t want to have expectations on what codes are “valid”, and have “invalid” codes rejected. Let’s take an example. Let’s say we have Customer Types of Manufacturer, Bank, and Retailer defined in our reference table. If we load a customer nominated as having a Customer Type of Primary Producer, if we enforced rejection of invalid records, that one would not get through. We don’t want the record rejected (in this case because our reference data is incomplete). Codes can arrive in the Satellite that don’t have a matching code in the reference table, and that’s OK – it is just a representation of reality.
There’s another variation that is commonly practiced. The Customer Type table can be replaced by a Hub-&-Satellite pair. As shown in the diagram, it is not connected by a formal Data Vault Link (it’s now become an “unconnected” Hub) but it has the advantage of having all the standard Data Vault mechanisms for data loading and recording audit trails.
Deletions
The baseline functionality of a Data Vault is great for capturing inserts into source system databases. A new Fire Truck is created, and it goes into a Hub. A new relationship between Fire Truck and a Fire is created, and it gets loaded into a Link, and any attributes describing these new instances get loaded into appropriate Satellites.
The baseline functionality of a Data Vault is also great for capturing updates as they occur in source system databases. The changes are reflected by new rows in the affected Satellites.
But deletions? If a Fire Truck is deleted in an operational system, how does a Data Vault respond? A bare-bones, minimalistic Data Vault will do nothing, but don’t get concerned – there are features within Data Vault for recording such activities if we need them.
Before we go any further, let’s see if we can get some clarity about so-called “deletions”. Some of the variations that may be of interest to us are listed below.
- There can be physical deletions at a database level. We’ve got a Fire Truck table, and one of the Fire Trucks has been sold, so perhaps we simply delete its record.
- There can be logical deletions within an application. If an Employee terminates, we are unlikely to physically delete their record straight away, but instead we might record their Termination Date.
- Within a Data Vault environment, the Staging Area can be set up to keep a record of what things were seen at the time of the previous full-snapshot load, and what things are seen in the latest full-snapshot load. For example, yesterday’s batch load of Employees had 10,000 rows. Today’s load has 10,005 rows. At first glance, that looks like we’ve got five new employees, but instead maybe we’ve got seven new employees, and two that we saw yesterday weren’t included in today’s extract. They are “No Longer Seen” – a form of implied deletion.
Now let’s immediately get one misconception out of the way. If we know something has been deleted in a source, we don’t try to mimic that action in our Data Vault. Data Vault architecture is intended to be “insert only”. We insert new Hub and Link instances to represent new business objects and new business relationships or new transactions. We insert new Satellite rows to represent observed updates. But if a deletion occurs back in the source system, we don’t delete the history for those things from the Data Vault. What we can do is insert some data so that we can keep a record of the fact that a “deletion” has been occurred.
There’s one other foundational matter regarding “deletions” that needs to be communicated. Any perceived “deletion” is a perception told to the Data Vault from a nominated source. Independent of the type of deletion (logical, physical, no longer seen), each and every source system can inform us of their different perceptions, at different times. The Human Resources system can, for example, tell us that an employee has been logically deleted on Monday by setting a termination date for last Friday. The Payroll system might inform us a year later of the termination, after the lucky ex-employee has received a year’s pay without doing any work! Then the source system for managing building access to employees has a different view, as does the system for managing computer network logins.
How is this separation of perceptions managed in the Data Vault? It’s simple, really, and it’s handled by Satellites. The recommended practice for Satellites hanging off a Hub (or Link) is that each source has its own Satellite. If we’ve got four sources of Employee information, we can expect at least four Satellites to be hanging off the Employee Hub. Let’s look quickly at the three types of “deletions” noted in the bullet list above.
Logical deletions such as an employee’s termination date are recorded in data, along with all sorts of other attributes. The dates can be put in an ordinary Satellite along with the other attributes, or if we like, we can split the Satellite out to create a so-called “Effectivity Satellite”. Either way, it’s just data from a source system feed ending up in a regular Satellite.
Physical deletions can be identified by mechanisms such as Change Data Capture (CDC) on a source system’s relational table. If we physically delete a row for an Employee from a system responsible for recording building access permissions, that action may be captured by the database CDC mechanism. If we subsequently expose the CDC results to the Data Vault, we can record the precise moment in time when the deletion occurred. Data Vaults can use what is called a “Status Tracking Satellite” to capture not only physical deletes, but also physical inserts and updates. Some CDC mechanisms even offer the ability to capture the details for each time a row is read!
No-Longer-Seen observations also have a standard Data Vault mechanism, known as a “Record Tracking Satellite”.
Status Tracking Satellites, Record Tracking Satellites, and Effectivity Satellites all have different structures. Some people may prefer a single structure to record “deletions”. This can be achieved as follows:
- Instead of Status Tracking Satellites, a simple solution is to let the Staging Area do some pre-processing to change the structure (not the content) of the incoming data feed, and flip it around so that a Status Code and a Status Date are supplied as simple data to be loaded into a Satellite just like any other Satellite.
- Instead of Record Tracking Satellites, the Staging Area which is already responsible for detecting changes between successive full extracts, can go one step further and create a Status Code and a Status Date in a similar structure to that used by the replacement for Status Tracking Satellites above.
- For Effectivity Satellites, we keep the standard Data Vault mechanism for handing the effective-from and effective to dates.
If we make the Staging Area work a bit harder, as described above, we could present different types of “deletions” in one standard data structure. We could go one step further and put all these “deletion” tracking milestones into one physical Satellite, even if they come from different sources. If we actually implemented the Tracking Satellites this way, there would problems. Standard Satellite update mechanisms simply wouldn’t work with (1) multiple source data feeds populating the one Satellite, and (2) even for one source data feed, having the data presented in a Name/Value Pair construct. It is not what I am suggesting. (Instead, I recommend one Tracking Satellite per source, with appropriately named specific columns.) However, for the sake of simple presentation in the worked example that follows, the data is presented as if all new data is added to the single, shared Tracking Satellite. Let’s look at an example.
There are only perhaps a dozen single-row data feeds, so the scenario isn’t too vast, but it has some interesting and subtle twists and turns. I encourage you to carefully follow the story as it unfolds. The details are a bit technical. If you are happy with the standard Data Vault mechanisms of Status Tracking Satellites, Record Tracking Satellites, and Effectivity Satellites, please read up on them in Dan and Michael’s book.38 However, if you have struggled with these basic building blocks and are looking for another way, there’s an alternative presented below. Either way, the following scenario will still be helpful to understand how these things fit together, even though the data structure presented below is the simplified one used to hold all types of deletions in a single form.
Also note that while the focus of this section is on capturing “deletions”, we could use the same mechanism to capture “insertions” by source system (as compared to the single-source “first seen” Data Vault dates and times). This can assist in constructing a whole-of-life view for nominated objects (Hubs or Links) in the Data Vault. Like with “deletions”, these “insertions” can capture logical insertions (via an Effective Start Date attribute), physical insertions (by using CDC records), and First-Seen insertions based on comparison of consecutive full batch extracts as seen in the Staging Area.
The worked example starts with a person successfully being accepted for a 9-month engagement. Some hard-working individual in the Human Resources (HR) department comes in on New Years’ Day (Monday January 1st), and loads the details for the expected new employee into their HR system. Employee Number 111 is assigned, and an intended start date of Monday January 8th is entered.
The Data Vault Satellite to capture this new employee’s dates is shown below, followed by an explanation of how the data got assembled. For the sake of brevity, date-&-time stamps are abbreviated to just month and day.
Table 19: Tracking Satellite after HR load on January 2nd
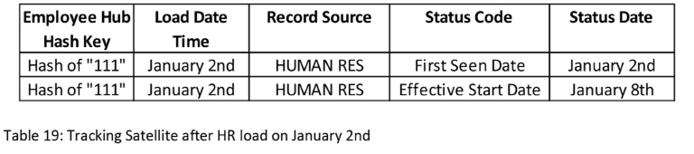
A batch job fires up a bit after midnight each night to take a full snapshot extract from the HR system. The Staging Area persists a copy of “active last time” Employee Numbers. Its pre-processing function for this batch noted that Employee 111 wasn’t in the last extract, but is now. It generated a row of data for loading to the Data Vault with a Status Code of “First Seen Date”, and its own Staging Area run date-&-time to declare that Employee 111 was first seen by the Staging Area at 1:00am on Tuesday January 2nd.
The intended Start Date for Employee 111 is just a piece of data that can be mapped to a Satellite. The Staging Area’s pre-processing simply assigns a Status Code of “Effective Start Date”. No End Date is nominated for the Employee, so the logic simply ignores a NULL value and does nothing in the way of generating an “Effective End Date” row.
After loading a new instance in the Employee Hub (a given), we also added rows to our special shared-records Satellite.
Now we swing our attention to the source system that issues passes to permit access to buildings. Instead of using a batch job for a full extract, this system runs on a database with the ability to generated Change Data Capture rows. The HR system had created a record for the new employee a week ahead of the expected start date. The person responsible for creating new building access passes normally waits until a new employee actually turns up on their first day. The source system then, by default, issues cards for six months from the actual date of the card’s creation. The Effective From and Effective To dates are generated and stored.
However, the person who issues cards is taking Monday off, so instead creates the access card ahead of time, on the Friday, and forgets to override the Effective From date, giving the impression that the new employee actually commenced on Friday the 5th. It’s a data quality mistake, but one that the Data Vault will faithfully record. On Friday January 5th, a new row is created in the Building Access system, and a CDC “insert” row is automatically generated by the CDC mechanism. Again we look at the Data Vault results, and then discuss them in more detail.
Table 20: Tracking Satellite after Building Access load on January 5th

The Staging Area pre-processing function generates a row of data for loading to the Data Vault with a Status Code of “CDC Physical Insert”, and the precise date and time, to a fraction of a second (not shown), when the physical insert actually took place in the source system. The Staging Area pre-processing also generates rows for the Effective From and Effective To dates.
Most employees like to get paid, but that doesn’t usually happen on day 1 of their employment. While company policy is to get the HR records loaded before the new employee arrives, and to create the building access card on their arrival, creation of the Payroll records can wait a bit. On Tuesday January 9th, the Payroll records are created, and exposed to the Staging Area early the next morning, Wednesday January 10th. Just like the HR system, a full extract is provided as a batch job. Like the HR system, the “First Seen Date” is generated, as is the “Effective Start Date”, matching that of the HR system. The Payroll worker also provided an “Effective To Date” of Monday October 8th to reflect the 9-month employment contract.
Table 21: Tracking Satellite after Payroll load on January 10th

Now the drama begins. Things haven’t worked out as expected in the relationship between the organization and the worker. The planned 9-month contract is being cut short. On Friday February 2nd, notice is given of premature termination, with an end date in a few weeks (February 23rd). This information is loaded into the HR system, which in turn is loaded to the Data Vault on Monday February 5th.
Table 22: Tracking Satellite after HR load on February 5th

In the turmoil of the unexpected departure, nobody thought to tell Payroll what was happening. The employee may no longer be active in the HR system, but is very much active in the Payroll system! They have continued to pay the ex-employee. It’s now July, in the new financial year.
The logic in the “full” batch extract of HR records isn’t actually a full extract. The extraction code says that if we’re in a new financial year, and an ex-employee was terminated in the previous financial year, exclude them from the extract. This is a beautiful example of one of the differences between a physical delete and “no longer seen”. As of the first working day in the new financial year (Monday July 2nd), Employee 111 is still in the HR system, but not in the extract file. When the file hits the Staging Areas and the business key comparison is performed, 111 is “no longer seen”, with the implication it may have been deleted.
Table 23: Tracking Satellite after HR load in July

A Data Vault is capable of executing business rules. Let’s assume that one very valuable rule is to generate an alert when a person has disappeared from view in the HR system but appears to be still active in the Payroll system. It is discovered on Tuesday 3rd July that in fact the ex-employee has continued to be paid since termination in February. Oops! Amongst other things, their Termination Date in the Payroll system is set after-the-fact back to February 23rd, and this information is loaded into the Data Vault early the following morning.
Table 24: Tracking Satellite after Payroll load in July

Another belated action is taken, this time by the Building Access system. The record for Employee 111 is physically deleted on Friday July 6th. They could have first updated the End Date, but if the record is being deleted, who cares.
Table 25: Tracking Satellite after Building Access load in July

If the scenario above seems a bit complicated, sadly it is a direct reflection of the complexity that sometimes occurs in the real world. So here’s a bit of good news. When the real-world systems disagree as to the “facts”, the Data Vault is well positioned to contribute to the resolution of data quality problems observed in source systems.
There’s another bit of good news. As noted earlier, the mechanisms put in place for tracking “deletions” can also track “insertions”, contributing to the building up of a picture of entity life cycle, as seen by multiple source systems with sometimes conflicting perspectives. This feature hasn’t been shown in the example, but it would be easy to add.
And the last bit of good news is that the three patterns described in this section (logical inserts/deletes, physical inserts/deletes, and first-seen/no-longer-seen), while requiring three separate bits of code, are a pattern for reuse across all Hub and Links, not just Employees as highlighted in this scenario.
Point-In-Time (PIT) and Bridge tables
Dan Linstedt has commented that Point-In-Time (PIT) tables and Bridge tables are “… the two most misunderstood, and misused, and misapplied modeling techniques in the Data Vault landscape today.”39 He elsewhere also stresses the value of these artifacts, especially to assist with simplicity and response time performance of queries for downstream users. So they’re important, but what do they look like?
Let’s start with PIT tables. I’ve come across people who really struggle to understand or explain them, but the fundamentals really aren’t that hard to grasp.
We’ll paint a hypothetical picture. Chris is an employee of Acme. The Data Vault has an Employee Hub, with two of the source systems being the Payroll system and the Human Resources (HR) system. The Hub has Satellites not only split by source system, but also by general topic and/or expected rate of change for the attribute values. A snippet of the Satellites and their values over time for Chris follows.
The first Satellite is from the Payroll system, and holds “Personal” slowly changing attributes such as Date-Of-Birth, Gender, Country-Of-Birth, and Name. Date-Of-Birth may never change unless a data entry mistake was made. Gender may change, but the Data Vault modeler does not expected this to be a frequent change. Country-Of-Birth may possibly change if the country itself changes name, but again this won’t be frequent. Finally, the Name attribute is expected to have occasional but infrequent changes for some employees. For the sake of simplicity, it is assumed that the only attribute in this set that changes for Chris is the Name, and this is the only attribute shown in the sample for the Payroll-sourced “Personal” Satellite.
Figure 106: Point-In-Time (PIT) sample data

The other Payroll Satellite holds many payroll “Rate” attributes such as frequency of pay (weekly or fortnightly), bank account details, grade and weekly pay rate. Chris, and all of the employees, hope that the pay rate is a frequently changing attribute! Again, only a subset of these attributes are shown in the table above.
Similarly, the Human Resource system’s data feed is split, this time into three Satellites, with some of the attributes shown.
Let’s walk through the timeline.
- At the start of 2001, Chris joins Acme. On his first day (1/1/2001), the Hub instance is created, along with values in all of the HR and Payroll Satellites.
- In February 2002, Chris gets a new mobile phone, and instead of transferring the old number to the new phone, gets a new mobile phone number. A new row is created in the HR / Phone Satellite. Note that, as is true of all Satellites, the unchanged values (in this case, the Home phone number for Chris) are captured in the new snapshot.
- March 2003 brings some good news – Chris gets a pay rise, moving from $1,111 per week to $1,222 per week. Only the Payroll-sourced “Rate” Satellite is needed to record this change.
- April 2004 comes around – time for another new mobile!
- May 2005 is another milestone for Chris, with completion of the Masters’ degree in Engineering, recorded in the HR-sourced “Personal” Satellite.
- … and the new qualification pays off. In June 2006 Chris gets a promotion from General Maintenance work to a Consultant Engineering role. This also means a regrading from 2 to 3, and a pay rise to $1,333. And to celebrate, why not get a brand new mobile phone? Several Satellites capture this happy scenario.
- July 2007 brings another major change, this time personal. Chris gets married and chooses to take the spouse’ family name, recorded in both the Payroll system and the HR system. The new matrimonial arrangement means Chris has shifted, and has a new Home phone number.
- August 2008 brings another pay rise.
- Unfortunately, the marriage doesn’t work out. Chis moves out (resulting in a new Home phone number), and reverts to the birth family name, which is recorded in the Payroll system but not updated in the HR system.
Now we get downstream users who want to submit queries.
Someone wants to compare the situation as at end of June this year (2009), for all employees. But focusing just on Chris, what is Chris’ Name (according to both systems), Grade, Weekly Pay, Education, Job Title, Home phone and Mobile phone as at that date?
Figure 107: Point-In-Time = end June 2009

When we look at the point-in-time line through the Satellite values, we can easily see the answer. But the code for finding the active Satellites at a given point-in-time can be a little trickier. So what if we construct that code, execute it, and store the results? We could hold all of the actual attribute values (Name = C. Jones, Grade = 3 …), but to avoid a bloated data set, a baseline Point-In-Time table instead holds the set of foreign keys that point to the Satellites that were active at the point-in-time.
That’s one example, based on a query for end of June, 2009. Maybe we might want to keep PIT rows for the end of every financial year, or for every month, or for every time any values changes in any of the Satellites. That’s fine. We can do that, too.
That’s the good news, but there’s a caution. The “point-in-time” relates to timestamps in the Data Vault recording when the data was loaded. These are technical dates, and shouldn’t be used for constructing a business view of when things happened. For that perspective, we need to look at dates in the Satellites’ data.
Now let’s talk about Bridge tables.
Earlier in our fire truck example, we saw a pair of Hubs, and one associated Link. It is copied below, with a “Bridge” table added.

In its simplest form, a Bridge table holds a set of foreign keys pointing to related Hubs and their Links, plus a date that records when the associations were applicable. The example shows two Hubs and one Link; the scope of a Bridge table can be much wider, involving lots of Hubs and Links.
Like for Point-In-Time tables, they exist primarily to improve performance. The heavy lifting for complex joins is resolved in a set of keys, ready to be used to support end-user queries.
There’s a bit more to PIT and Bridge tables, but for the Data Vault modeler, it might be enough to have a broad understanding of what they are and where they fit. If you want to read more, Chapter 6 in Dan Linstedt and Michael Olschimke’s book40 goes into greater (and more technical) detail.
Using a Data Vault to Shine Some Light on the “Process” World
Gap analysis using a Data Vault
We’ve already recognized the role of processes to assist in understanding, challenging, and extending the enterprise model. That’s an example of a process view of the world making a contribution to the Data Vault world. But can a Data Vault pay back the favor by making a contribution to the “process” world?
The answer is a resounding, “Yes”, and one way it does this is by giving us a measured and reliable view into the process world. Dan says, “Data Vault models are representative of business processes and are tied to the business through the business keys.”41 So how does this work, and how can we leverage Data Vault to deliver value?
I did some work at a water utility. At first glance, the business was so very simple. One way we could look at it was that they had two products. First, they sold clean water for drinking, cooking, and bathing. Second, they charged, in one way or another, for taking away less-than-clean water, including after people pressed the flush button. But they did have some problems they wanted help with, and water meters were at the heart of their issues.
Sometimes data people and process people don’t see eye to eye. Tommy was different. He’s a really nice bloke, and he’s great at his process stuff. Importantly, he understands “data” as well, and welcomed the opportunity for the two of us to work together. He asked if the Data Vault could provide some metrics to help track actual progress through a number of business processes.

Data Vaults are great at seeing when business keys (in Hubs) are created, when the relationships between them (in Links) are created, and when the Satellites that hold data about them reflect an update. They also have mechanisms for recording when things are deleted (logically or physically) in a source database. Let’s take an example of how we might use a Data Vault to inspect some business processes.
Figure 109: Data Vault objects for a water utility

We start by looking at the Data Vault model. We’ve got a couple of Hubs (shown as boxes):
- Meter: This is a physical device, installed at a customer’s premises, to measure the amount of clean water consumed, or waste water taken away.
- Remote Read Device (RRD): An attachment to a meter to allow electronic reading of the meter when we can’t safely get in to read the meter.
I’ve got lines representing relationships between the Hubs, and these would be implemented as Links in the Data Vault.
One is for a connection between major and minor water meters as might occur in a block of flats. The major meter measures total flow for the overall property, and the minor meters measure flow for individual houses. The difference between the sum of the minor meters and the total flow for the major meter records “property” use, perhaps for watering of the common garden.
The other relationship, shown as a dotted line between the Meter and the Remote Read Device (RRD), is for the relationship between a water meter and the remote read device. Please refer to the notes in “Hubs with more than one business key“ for further details of this relationship.
Now let’s look at a selected subset of business processes related to meters.
Figure 110: Data Vault and water utility processes

The sunny-day picture goes something like this.
The water utility holds a number of spare meters, and spare remote read devices, in stock. When the levels start to get low, the Order Placement process kicks in. The thing that’s unusual about this process is that the water utility orders ahead of time what the meter numbers are to be for the yet-to-be-manufactured meters. Most manufacturers deliver products with their own serial numbers assigned; here, the manufacturer delivers products with the customer’s serial numbers physically stamped on the meters. So the water utility’s internal records in the operational system (and in the Meter Hub in the Data Vault) can record meter instances before they are even manufactured!
If all goes according to plan, two weeks later the Order Fulfilment process records the delivery of the ordered meters and remote read devices, and they go into the warehouse. Almost immediately, the Asset Management system updates its records. This IT system is responsible for all corporate assets (company cars, laptop computers, … and yes, water meters and remote read devices). Even though it uses its own Asset Number business key for all assets, it also records the Meter Number for water meters and Remote Read Device Number for the RRDs. That’s taken care of the incoming assets. Now we engage with water utility customers. An order comes in for a Meter Installation. After the Meter Installation process is completed, additional details about the meter (in Satellites) and additional Links (for example, to the Customer) can be added.
If the meter is a simple, single meter for a residential customer, there is no need for a Customer Audit. However, if it’s for a large block of units, a factory, or a hospital, where there are multiple meters involved in the installation, an audit will be performed, amongst other things to make sure that the records are correct as to what meter number is connected where. Now the customer has connections, the schedule for meter readers is updated to include the new meters, and in due course, either Physical Reads or Remote Reads are performed.
That’s the sunny day scenario. But what might happen in reality? Orders can get placed, but the delivery can be way beyond the expected two weeks. Deliveries can be made, but the Asset Management system fails to “almost immediately” record the new assets (or maybe it never gets around to recording the new arrivals). Meters can be installed, but in situations where an audit is mandated, the audit process slips through the cracks. And though it may sound impossible, a customer can be connected, but the bills for usage never arrive because the meter is never read.
So how might a Data Vault help? In a blog,42 Dan Linstedt shares the following glimpse of hope: “The original Data Vault model provides pure business value by demonstrating the gaps between the business perception (of the way they THINK their business is running) and the reality (the way the data is actually captured and processed through business processes and systems).”
Dan and Michael go into more detail in their book, in the section titled “The value of bad data”.43 My attempt at summarizing their position goes like this:
- The business has a belief, and expectation, as to what is happening within their organization.
- IT systems record the data actually captured as business processes interact with those systems.
- A bit of analysis of the captured data might reveal that there is a gap between the business belief and the reality of what the IT systems reveal.
A Data Vault can be used to track what’s happening in source systems, facilitate comparison around business keys, and offer the results for downstream analysis. For the water utility, some simple examples follow:
- The Order Placement process records the creation of a Hub for meter 123 on the first of the month, some time last year. The Order Fulfilment process adds a Satellite for that Hub on the 22nd of the same month, three weeks later. A simple comparison of the dates recorded in the Data Vault indicate that the expectation of a 2-week turnaround from order placement to order fulfilment was not met.
- A Satellite (and associated Links) indicate that in January of this year Meter 123 was installed at a customer’s premises. Six months later, there are still no readings for use related to the meter. Seeing bills are meant to be produced quarterly, something looks wrong. A process somewhere seems to be broken.
They may be examples of pretty obvious sorts of analytics we could perform. A bit of good old fashioned detective work by Tommy found some more anomalies.
My first story relates to changes in subdivision plans. Maybe a property developer originally intended to build five houses on a large block of land, and to assist the builders, five water meters and taps were installed. Subsequently, the developer decided to build four larger houses instead of five crammed shoe-box dwellings. Permission was given for the changes, and the titles office and the local shire council knew about the new plans, but the water utility was not informed. We’ve got five meters now on four blocks, and one is never going to be connected.
Now the twist that will make you smile. The five meters get scheduled for reading. In due course, readings are taken, and of course, the one that’s not connected has a reading of zero usage. There’s another process that kicks in at this time. Sometimes meters get stuck and won’t turn. Water is still being delivered, but not billed, so there’s a targeted process to replace faulty or blocked meters with a brand new ones. The field worker does his or her job, and replaces the zero-read meter, but no one wakes up to the fact that it’s not turning because it’s not connected. And in due course, the new meter that also records zero usage is also replaced. And the new one also reports a zero read …!
To understand “Process”, we need more than a Data Vault
For us to deliver the full potential of performing analysis on processes, I suggest we need at least three things. The first is to see raw data in all of its glory. Some other approaches to data warehousing aim to clean up the data on the way in. In contrast, I’ve heard Dan talk about capturing “all the data, all the time”. Warts and all, the whole philosophy behind loading source-centric raw data into the Data Vault is to not hide perceived anomalies from view. That’s a tick for the first of my three requirements. Next, we want to perform analytics by source. The bare minimum of Data Vault capture of dates does provide some insight, but it might not be enough. For example, the Meter Hub will record the source of the first data feed to present Meter Number 123 to the Data Vault, and the date it was loaded, but it doesn’t record what other sources have also had visibility of Meter 123, or when. More advanced aspects of Data Vault, such as Status Tracking Satellites or Record Tracking Satellites, can provide insight into business keys, and their creation dates and even “deletion” dates, by source. This is what I wanted.
Lastly, we need to recognize that IT systems, the data they capture, and this data that then gets moved to a Data Vault, is only part of the picture. Yes, it’s important that a Data Vault is capable of faithfully capturing what’s being entered into the source systems. But things can happen in the business that are not even visible in the source systems. People do work-arounds. They capture stuff in spreadsheets. They have totally manual processes that breach the rules. This is the reality.
Dan and Michael are very precise when we look closely at what they say on this topic. They claim (emphasis mine) that, “… source systems provide the truth about the data being collected and what is really happening from a data perspective”.44 In this quote, Dan and Michael are not claiming that the source systems represent the truth, the whole truth, and nothing but the truth for processes that occur outside the view of the source systems.
I remember doing some data quality work for one of Australia’s largest telecommunications companies. The lead consultant, Bill, had a PhD in mathematics. He held the view that we could get some insight by looking at the data in IT systems, and comparing them. If two systems disagreed on a person’s date of birth, he concluded that at least one was wrong, but maybe both were wrong. The way to check was to go back to the real world. I remember a comparison across four systems, three of which agreed. One person at the company concluded that the three must be correct, and the fourth wrong. Bill challenged this assumption, and went on to prove that three were wrong, and one right. Bill had a sense of humor. He got a coffee cup made that portrayed him being at the company’s reception desk, with the receptionist saying something like, “Bill, you can’t be you – three out of four of our systems record the fact that you’re dead!”
Two more stories from my time working with Bill. The first was where a data analysis showed a spike in errors for the IT systems’ data from one phone exchange. Bill dug a bit deeper, and uncovered the fact that the staff at that particular exchange never updated the central records because they had all of the information they needed on a spreadsheet. Then there was the time when Bill’s dogged pursuit of the truth uncovered an illegal hard-wired patch between two telephone exchanges.
A number of us have seen less dramatic examples of where the IT systems don’t capture the facts. Maybe a “standard” process doesn’t work in fringe cases, so people “break the rules” to get the job done. A recent client is involved in forensic analysis related to deaths that the coroner wants investigated. I won’t confront you with the sad background, but sufficient to say that the central IT system simply can’t cope with some of the tragic real-world scenarios. To do their job, workarounds are absolutely essential, and totally ethical. But the key message is that if we were to load the data from operational systems into a Data Vault and then analyze it in isolation from the “real world”, we could come to some dangerously wrong conclusions. To try to protect the community by learning from the past, we must have solid analysis. In this forensics setting, lives depend on it.
What’s the key message from all of this? That while the Data Vault can facilitate data analytics by triggering lines of investigation, or providing detailed insight as the analyst drills down, we need to have a healthy skepticism and challenge what the data is telling us. A capable human being is required to drive what Dan and Michael call “gap analysis”. Don’t underestimate the value that the Data Vault can add to the equation in providing an integrated view, and dates that challenge how processes are really working, but I do encourage you to dig deeper. Bill used to require his team to “ride the trucks”, even if that meant crawling around a dirty, dusty phone exchange to understand what was really happening.
A bit on projects
Agility
Data Vault has the potential to be “agile”, but agility doesn’t just happen because someone thinks it’s a good idea. There’s a lot of stuff that needs to be in place for agile to succeed. Just some of the things we might need for any agile software development project include:
- Some idea of the goals. No, not hundreds of pages of excruciatingly detailed requirements’ specifications, but a broad idea of what success might look like.
- Some tooling. What’s the development environment (Java, .NET …)? Have we got an interactive development environment? What about automated / regression testing tools? Can we easily do DevOps rapid promotion to production? Have we got something as fundamental as a database to store our data! And on and on.
- A team. Pretty obvious? But in agile, it’s not about having a bunch of technical propeller-heads locked away. The business needs to be on board, too. And agile projects recommend the team be co-located, which leads to …
- Facilities – a work area, probably a whiteboard, some collaboration tools (even if they’re Post-it notes), computers already loaded with required software, … And a good coffee machine?
- Training. Sure we can learn on the job, but if we want to hit the ground running, have at least some of the team proficient in the languages, tools, and processes.
- Permission. You might wonder why I raise this, but I’ve seen projects threatened by people who say things like “You can’t have access to that data” or “You can’t use those tools” (because they’re not authorized by head office, so the resultant code will not be permitted to be moved to production) or “You can’t have Sam on the project because something more important has just come up”.
Much of the list above applies to any agile project, whether it is for a Data Vault build or not.
Platform & tooling projects versus the Data Vault project
There are two threats to Data Vault projects I’ve observed that relate to muddying the waters on project scope.
The first threat is confusing the project to build required infrastructure with the project to build a Data Vault. Maybe we want Hadoop as part of our architecture? Fine. And we need a project to get it in place in our organization? Fine again. And we want to fund and manage the Hadoop implementation as part of the Data Vault project? That’s where I see red lights and hear warning bells clanging.
No matter what the new software components might be (Hadoop as described above, or real-time mechanisms, or service-oriented architectures, or …), if they’re part of our strategy, identify the interdependences, but consider funding and managing them separately.
There’s an option we might want to consider: perhaps we can at least start the Data Vault project on an interim platform, deliver tangible value to the business, and accept we may have some technical debt to pay back when the other projects catch up with us. After all, much of the metadata we need (including for the design of Hubs, Links, and Satellites, and source-to-target mapping) should turn out to be relatively stable even if the underlying technology changes.
The second threat is similar, but closer to home for the Data Vault project, and it’s about confusing the Data Vault delivery project with the tool evaluation / acquisition / build project. Sooner or later (probably sooner), we will want to use a tool for moving the data from layer to layer, doing extract/transform/load, though not necessarily in that order!
We may choose to buy a tool, and that strategy has lots of merits. I encourage you to check out what’s on the market. Evaluate the candidates. Do we need to specifically model columns such as Source and Load Date-&-Time stamps, or is the tool smart enough to know these are part of the Data Vault package? Can we define, manage, and execute business rules? Do they integrate with our testing tools and DevOps strategies, or maybe they even include them? Lots of questions. And if we can find a tool that meets our requirements, or is at least “sufficient”, that’s great.
Alternatively, we might decide to build our own tool, or at least hard-code some bits while we do a Data Vault proof-of-concept.
I consulted to one organization that was very altruistic. It wanted to gift its entire Data Vault (less the data) to others in the same industry, and not have them need to get a license for the Data Vault toolset. They chose to develop the tools in-house so they could give them away. I take my hat off for their generosity. But I simply want to warn that building you own toolset does come at a price. And like with establishing other software infrastructure, I recommend that the build of a tool be separately funded and managed.
A few hints
OK, we’ve got everything in place. We’ve got the team, they’re trained, we’ve got the complementary software, a tool, and we’re ready to go. I’ve got a few final hints for us to consider as we build our Data Vault:
- At the very outset, check out the infrastructure bits we’ve been given to work with by creating a “walking skeleton” – some tiny bits of code that exercise the architecture, end-to-end. Yes, agile is meant to deliver business value as part of each iteration, but treat this as a technical spike to try to eliminate the possibility of architectural show-stoppers.
- Next, do something similar to give end-to-end visibility of some business data. Pump a tiny bit in from a source, and push it all of the way through to end-user consumption. Again, perhaps this might provide minimal business value, but it shows the business how the whole thing works. More importantly, it provides a baseline on which we can build to progressively deliver incremental business value.
- Now for the remaining iterations, keep delivering end-to-end, focused on tangible business value.
There’s one phrase that appeared in all of the above bullet points. It’s “end-to-end”. Why do I see this as being important? I’ve unfortunately seen tool vendors, and Data Vault consultants, who impress with how quickly they can load data into the Data Vault, but fail to give enough focus on actually delivering against business expectations. The good will that might be won by demonstrating a speedy load will sooner or later evaporate unless business value pops out the other end of the sausage machine.
One more suggestion. In the earlier section titled “Is “agile evolution” an option?“, I shared a confronting story. The lack of a data model hampered an agile project. The team took one iteration to assemble a relatively stable data model. Subsequent iterations resulted in a 12-fold increase in productivity.
My conclusion? For a Data Vault project, I suggest that the data modeler(s) on the team try to think about what’s coming up, at least one sprint ahead of the development.
A few controversies

There are a number of well-recognized voices in the Data Vault community in addition to that of Dan Linstedt, the founder of Data Vault. I’ve heard a joke that goes something like this: “If you’ve got three data modelers in a room, you’ll get at least four opinions.” Oops.
I take heart from the PhD of Graeme Simsion on a related matter, as adapted for publication in his book, “Data Modeling Theory and Practice”.45 I can’t do an entire book justice in a few sentences, but here’s my take-away from his work. If we’ve got a bunch of data modelers, and each one thinks there can only be one “correct” solution for a given problem, don’t be surprised if there is heated disagreement. Conversely, if all accept that several variations may actually “work”, a more balanced consideration of alternatives and their relative merits is possible.
I think it is healthy if there is room for respectful discussion on alternatives to Data Vault modeling standards. For me, my baseline is the Data Vault 2.0 standard, but I welcome objective consideration of variations, especially as they may suit specific circumstances. Dan Linstedt also welcomes the standards being challenged. He just, quite rightly, warns against changes without due consideration as to unwelcome side effects.
Modeling a Link or a Hub?
We may encounter debates as to when something could or should be modeled as a Hub versus modeling it as a Link. I know this is contentious in some quarters. Part of me would prefer to not even raise the topic, as whatever position I take, I suspect someone will disagree. Nonetheless, avoidance of the issue won’t make it go away, so I will stick my neck out, hopefully in a manner that is respectful of the views of others.
I would like to share two scenarios that might help shed some light on this topic.
In the first scenario, there is an accident on a highway. Cars are damaged, drivers are upset, insurance companies may be faced with claims, but thankfully no one has died. From the perspective of one of my clients, there may be a police report with “links” to cars and their registration numbers, drivers and their driver’s license numbers, health practitioners who may assist, police force members identified by their member number, and so on. The “key” message (pun intended) is that there is no business key for the accident itself. However, in our Data Vault, we can create a Link (and maybe a Satellite – see the next “controversy” for comments on Links with Satellites) to associate the accident with the cars, drivers, health practitioners, police members, and more.
In the second scenario, a fatality occurs and forensic examination of the deceased is required. A “Case Number” business key is assigned. In the Data Vault, there is a Case Hub. We can create an instance in the Case Hub, populate its Satellite, and also populate Links to the cars, drivers, health practitioners, police members, and so on.
Which model is correct, or are both models OK? Here are my starting-point rule-of-thumb guidelines for choosing Hubs versus Links, at least as they relate to business views of the world:
- If the thing to be modeled is recognized by the business as a tangible concept, with an identifiable business key, it’s a Hub.
- If the thing to be modeled looks like an “event” or a “transaction” that references several Hubs via their business keys, but doesn’t have its own independent business key, it’s a Link.
There we are. Some nice, clean guidelines.
But what about an event or transaction that also has a clearly recognized business key? It seems to span my two definitions; it’s an event so it’s a Link, but it has an independent business key so it’s a Hub! For example, maybe an engineering workshop has “transactions” that are work orders, with a Work Order Number.
If the work orders are “recognized by the business as a tangible concept, with an identifiable business key” (such as a Work Order Number given to the customer so he/she can enquire on progress), then to me, the work orders look like they belong to a Hub. (If something walks like a duck, quacks like a duck, and swims like a duck, maybe it is a duck.) But if the transaction didn’t have a Work Order Number and was identified by nothing more than the collection of business keys in related Hubs, the work orders look like they belong to a Link.
Even if my guidelines are helpful, please recognize that, as noted by Graeme Simsion’s research, there might still be times when experienced modelers may have to agree to disagree, take a position, and see how it works.
Roelant Vos also adds a valuable perspective. We can start by modeling at a higher level of abstraction, capturing how the business sees their world. From this position, if we have flexible tools, we may be able to generate variations of the physical Data Vault tables while having a single, agreed logical view. That approach may actually defuse some of the tension in the following topics. Thanks, Roelant!
Modeling a Satellite on a Link?
I’ve got another controversy to share at this point. Some suggest that a Link should never have a Satellite, apart from maybe an “Effectivity Satellite” that has a From Date and a To Date to record the period the relationship was active. Those who hold this view seem to suggest that if a “thing” has attributes, it has to be a Hub.
Conversely, others happily model Satellites against Links.
For a moment, I want to step back to traditional data modeling, then to the Unified Modeling Language (UML) to see if we can get some clues to help us decide which way to go.
In a traditional data model, we have relationships, and these somewhat approximate a point-in-time equivalent of a Data Vault Link. If an operational system has a one-to-one or one-to-many relationship, the relationship itself is represented by the presence of a Foreign Key in one entity. This type of relationship is unlikely to have associated attributes, and if it does, they will be mixed in with other attributes in the entity holding the Foreign Key. If data from this operational system maps to a Data Vault Link, there is probably no data to even put in a Satellite off the Link.
Conversely, if the relationship is a many-to-many relationship, modeled as a resolution entity, it can have attributes in addition to the Foreign Keys that point to the participating “parent” entities. When we map this resolution entity into a Data Vault, I think most if not all people are happy that the additional attributes go into a Satellite. But is it a Satellite hanging off a Link, or a Satellite hanging off a Hub?
Before we make a decision, let’s quickly look at the UML Class Diagram notation – a modeling style with some correlation to a data modeler’s Entity-Relationship Diagram. A UML class approximates an ERD entity, and a UML association approximates an ERD relationship. Now if the association has its own attributes, a new type of object appears – an “association class”. It’s an association (a relationship) that can have its own attributes in a dedicated class (entity). It looks something like a data modeler’s resolution entity, but can hold attributes for an association (relationship) even if the cardinality is not many-to-many.
So where does all of this lead us? One answer is that there are many answers! Dan Linstedt’s Data Vault 2.0 standard of allowing Satellites to hang off a Link looks like it’s got good company with data modeling resolution entities, and with UML association classes. Others may argue that the UML association class gives us a hint that the moment an association / relationship has attributes, it needs a class, and does that hint at a Hub in the Data Vault world?
OK, I will share my opinion; for me, I like to start by considering whether a “thing” looks like a Hub or a Link (see the section immediately above), independent of whether it has its own attributes or not. And if it turns out to look like a good Link, and it has attributes, I am happy to create a Satellite on the Link. I think this approach is clean, simple, consistent, and it aligns with much of what I observe in both data modeling and class modeling (UML) practices.
Having said that, you may reach a different conclusion, and hopefully we can still be friends!
Normalization for Links, and Links-on-Links
We may encounter guidelines on Links that encourage the structure to be “de-normalized”. A purist data modeler may look at the examples, and suggest that in fact the structures are being “normalized”.
In some ways, it’s simply not worth the debate. Very few can quote precise definitions for first, second and third normal form, let alone Boyce-Codd normal form, or fourth or fifth normal form. And I suspect few care about such abstract terminology anyhow. It is arguable that a working knowledge of these levels of normalization is more important than their definitions. In another way, precision as to whether something is normalized or not does matter. But before we get to that, let me note that the examples I’ve seen on Data Vault modeling sometimes touch on the more advanced levels of normalization, such as 5th Normal Form (5NF). That may sound scary to some, so let me please share a very simple example from a cut-down model for the airline industry. The examples given in the text below the diagram are not meant to be necessarily correct, but just indicative of the types of information that could be held.
Figure 111: Example of normalization for Links

The large circles represent core business concepts for airlines. They could be relational tables in an operational source system, or Hubs in a Data Vault.
- The Airport table/Hub holds instances for the airports of interest – Melbourne, in Australia (MEL), Los Angeles in the USA (LAX), Heathrow in the UK (LHR), and even the tiny airport I’ve used in a remote part of Australia, the Olympic Dam airport (OLP).
- The Airline table/Hub holds instances for participating airlines such as Qantas, United, and British.
- The Aircraft Type table/Hub holds instances for types of aircraft such as Airbus A380, Boeing 747, Being 767, and maybe the Cessna 172.
Forming an outer ring are three boxes with arrows to the core entities. They could be many-to-many resolution entities in the operational system’s relational database, or Links in a Data Vault.
- The Terminal Rights table/Link holds pairs of codes from the Airport and Airline entities, defining which Airlines have terminal rights at which Airports. Examples might include that Qantas has landing rights in Melbourne and Los Angeles, United has rights in Los Angeles, and British Airways has rights in Heathrow and Melbourne.
- The Landing Authorization table/Link holds pairs of codes from the Airport and Aircraft Type entities, defining which Aircraft Types are authorized to land at which Airports. Examples might include that Airbus A380s and Boeing 747s are authorized to land at Melbourne airport. Not in the list might be Cessna 172s at Heathrow (emergencies aside, it’s too busy to permit regular use by light aircraft), and Boeing 767s at Olympic Dam (it’s just a dirt airstrip next to an outback mine).
- The Ownership table/Link holds pairs of codes from the Airline and Aircraft Type entities, defining which Aircraft Types are owned by nominated Airlines. Qantas owns A380s, …
Each of the above three tables relates to just two “parent” tables. They are normalized. If we tried to have a single three-way table that held the Cartesian product of all combinations from the three separate tables, it would not only cease to be normalized, but it may hold combinations that are not valid. For example:
- Maybe Qantas has landing rights in Melbourne (MEL), Los Angeles (LAX), and Heathrow (LHR).
- Maybe Qantas owns Boeing 747s, 767s and Airbus A380s.
- Maybe Melbourne (MEL), Los Angeles (LAX), and Heathrow (LHR) can handle Boeing 747s, 767s and Airbus A380s.
But a Cartesian product of all of these data sets may be misleading. Perhaps Qantas chooses to only operate its A380s between Melbourne and Los Angeles (not its 767s). Maybe it operates 767s between Melbourne and Heathrow (not its A380s). It is misleading to create a 3-way Link between the three Hubs, based on possible combinations; retaining the set of three 2-way Links is actually holding the relationships in a normalized form.
Now we turn the example on its head.
The single 3-way Operations table/Link holds triplets of codes from the Airport, Aircraft Type, and Airline entities, defining which Airlines actually operate which Aircraft Types out of which Airports. One of the examples above was Qantas operating its A380s into and out of Los Angeles.
It was dangerous to assume we could take all combinations of the three 2-way Links to generate a single 3-way Link to represent which airline flew what aircraft types in and out of what airports. Likewise, we can’t simply take the single 3-way Link and assume it represents all combinations for the other 2-way Links. Maybe no airlines actually operate out of Roxby Down with a Cessna 172, but the Airport is capable of handling them. This time, retaining the single 3-way Link is actually holding the relationships in a normalized form!
We could have included another Link on the diagram, showing Flights. It would be a 4-way Link, involving the Airport table/Hub twice (From, and To), plus the Airline and the Aircraft Type. It too would be normalized for this purpose. So what are the take-away messages?
- The logical model of the business concepts and the business relationships should be assembled as a normalized view.
- The Data Vault model can have multiple Links that in part share common “parent” Hubs, and that’s fine. There is no need to have Link-to-Link relationships – keep them separate, just like the 3-way Link and the set of 2-way Links have independent lives as shown in the diagram.
Closing comments on controversies
I’ve seen divisive debates on alternative approaches. My own opinion is that while the differences are important, there is much in common. Let’s leverage off what is truly common, and respectfully and objectively evaluate the differences.
More uses for top-down models
Remember that Dan Linstedt said that if we have an enterprise ontology, we should use it? That’s great if we have one. But what if we don’t? The section of this book titled “Task #1: Form the Enterprise View” was written to help people who didn’t already have an enterprise data model to create it quickly, without comprising the quality.
But can the same enterprise data model be used for other purposes? The good news is there may be many initiatives within an organization where an enterprise data model can potentially make a contribution. Some of these are listed below.
- Strategic planning: I’ve participated in several projects where strategic planning, for the entire enterprise or just for the IT department, was assisted by the development and application of an enterprise data model. In each case, a “sufficient” enterprise (top-down) model was developed in a few weeks.
- Enterprise data integration: One of my clients was involved in the merging of 83 separate organizations. The management did an amazing job given the pressing time frames mandated by an act of parliament. But after the dust settled, an enterprise data model gave them a long-term framework for integrating the multitude of data to provide a single, consistent view.
- Master Data Management (MDM) and Reference Data Management (RDM): It’s probably a self-evident fact to say that management of data as a corporate asset requires a corporate vision! An enterprise data model can provide the consistent framework for Master Data Management and Reference Data Management initiatives.
- Benchmarking candidate IT package solutions: A company engaged me to develop an independent view of their data. They didn’t want their target model to be influenced by assumptions consciously or unconsciously incorporated in any vendor software packages that had been shortlisted for selection. The top-of-the-list package was ruled out when compared to the essential features of the benchmark model. It was estimated that the cost savings from this insight could be measured in millions of dollars.
- Facilitating IT in-house development solutions: One client wanted an enterprise data model to drive the design for their service-oriented architecture, particularly the data structure of the data payloads in XML. Another wanted a UML class model to drive a Java development, and the enterprise model (using the UML notation), was the kick-start they needed.
- Facilitating communication: Most if not all of the above uses have a technical aspect. What I have seen again and again is the participation of business and IT people in the development of an enterprise data model delivering a massive beneficial side effect – the two sides now talk the same language!
- Process modeling: Further to the above, the existence of a common language can facilitate the development of process definitions.
… and last but not least, we return to the catalyst for this book – using the enterprise data model to shape a Data Vault design.
So an enterprise data model can be used for many purposes. But what happens when it is used for more than one of these reasons, in a single organization?
Even if our motivation for pursuing top-down big-picture enterprise modeling had been for only one of the above reasons, that’s enough. But if the model is used across two or more such initiatives, the multiplier effect kicks in as the investment in one area contributes to another related area. For example, if several agile in-house development projects also produce source data that will be required in a Data Vault, why not base all such projects on a common data architecture? Everybody wins.
In conclusion
Australia has some cities that grew somewhat organically, and their origin is reflected in some chaotic aspects! Australia also has some major cities that were planned from the outset, where the designers articulated a vision for the end-state, and the authorities defined a clear path to get there.
Some Data Vault practitioners appear to follow a simplistic bottom-up raw source-centric Data Vault design and hope the business-centric Data Vault solution will magically appear. Like the source-driven tool vendors, they can impress with their speedy delivery of something, but subsequent delivery of tangible business value may be much slower, and the project, and therefore the Data Vault initiative, may fail.
Of course, the Data Vault is flexible, adaptive, and agile. You can create source specific Hubs and Links, and later create business-centric Data Vault artifacts to prepare the raw data for business consumption. But if you head down this route, don’t be surprised if you experience an explosion of source-specific Hubs, followed by a matching explosion of source-specific Links.
Data Vault is about integration. Just because Data Vault can use the business rules layer to untangle a messy gap between source-specific Hubs and Links, and ready-for-consumption artifacts, why should it? Why not create a small number of clean, agreed, business-centric Hubs, and then define business-centric Links around them to represent the more stable business relationships? If you take this approach of identifying business-centric Hubs and Links, the source-specific Data Vault Satellites can now be loaded happily against this framework, immediately providing a useful level of integration.
The good news is that this can be done. By properly designing the Data Vault, from the very outset, based on an enterprise data model, you can expect to reduce “business debt”. And hopefully this book will help you achieve tangible business value both initially and in the longer term.
And now a parting thought. While Data Vault is capable of contributing to the cleaning up problems in the source operational systems, let’s not forget the role of data governance in moving resolutions back to the source where reasonably possible. Operational staff who use these source systems will thank you. But to guide such an endeavor, you’ll benefit if you start with a top-down enterprise model.