CHAPTER FIVE
What's Ahead for Solar Energy
So far, we've looked at the history of solar energy, how modern solar energy systems produce electricity, whether or not a solar energy system makes sense for the reader, and the rise in utility-scale solar. In this final chapter on solar, we're going to cover what's ahead for what is quickly becoming the world's most ubiquitous energy source.
SOLAR GROWTH, SMASHING RECORDS
In 2016 solar energy in the United States nearly doubled the previous year's installation record, adding 14,626 megawatts (MW) of solar PV. That's a 95 percent increase over 2015's 7,493 MW1 (see Figure 5.1).

FIGURE 5.1 US SOLAR PV INSTALLATIONS, 2010–2016
Data source: www.greentechmedia.com/articles/read/us-solar-market-grows-95-in-2016-smashes-records.
On an annual basis, US solar PV was the top source of new capacity additions for electric generation. This is the first time in history solar ranked as number one. It was 39 percent of all new generating capacity in 2016.
Abigail Ross Hopper, the president and CEO of the Solar Energy Industry Association (SEIA), put solar's record rise into the proper perspective: “What these numbers tell you is that the solar industry is a force to be reckoned with. Solar's economically winning hand is generating strong growth across all market segments nationwide, leading to more than 260,000 Americans now employed in solar.”2 The US solar industry now employs more than twice as many people as it did just five years ago. These workers are at over 9,000 companies located in every state. By 2021, the SEIA expects the US solar sector will employ more than 360,000 Americans.3
THE GRAND COMPROMISE
At the end of 2015, the future for renewable energy was in doubt. The Production Tax Credit (PTC), which benefited wind, expired at the end of 2014. The Investment Tax Credit (ITC), which benefited solar, was set to expire at the end of 2016. That would have been a huge blow to what was a great start to renewable energy. Over the previous decade, wind and solar attracted investments of more than $400 billion.
Analysts and industry experts predicted that wind and solar would reach “grid parity” pricing by 2020. By that time, they'll be at or below the price of other forms of power generation. A financial incentive was clearly needed, one that would bridge the five-year gap. Without it, investment in renewables would slow down significantly, and grid parity would take much longer.
But in a late December 2015 “grand compromise,” as it is now referred to, Congress agreed to reinstate the PTC and extend the ITC in exchange for lifting the 40-year ban on the export of American crude oil dating back to the oil embargo crisis of the 1970s, thus avoiding the potential “valley of death” that would have resulted if the ITC and PTC were not renewed.
Congress voted to extend the solar ITC at its current 30 percent rate through the end of 2019. Any project that is under construction before the end of 2019 qualifies. The ITC drops to 26 percent in 2020, 22 percent in 2021 and 10 percent in 2022. Any project that is under development before 2024 will receive the 10 percent credit. The PTC for wind was applied retroactively to any project under development or constructed in 2015 and 2016. After 2016, it declines each year until it completely expires in 2020.
Extending the ITC and renewing the PTC ensures renewable energy development will continue along its rapidly declining cost curve. It's great news for the big corporations that are adding significant renewable generation capacity in the United States. In 2017 alone, they've signed deals with energy providers to construct 2.78 GW of large, utility-scale renewable capacity.4
Perhaps the best thing to come from the extension of the ITC and PTC is the ability for all the companies in the renewable energy business to plan for and forecast their future business levels accurately. They'll be able to secure financing, cut costs, and prepare project pipelines. In another few years, when the subsidies expire, costs will be low enough so that solar and wind will be the go to energy sources. It's a watershed moment for solar.
How far away from grid parity are renewables? Wind is already past grid parity, which explains why wind farms now appear in all 50 states in favorable locations. Utility-scale solar is also on par or below natural gas–fired generation. Community solar gardens and rooftop installations on commercial and industrial buildings are also on par with natural gas–generating plants. Residential rooftop solar must still come down in price to be at or below grid parity.
The utility-scale segment of solar was the big growth driver for 2017 and 2018. During Q2 2018 the US installed 2.3 GW of solar capacity.5 Some of those projects moved forward in anticipation of the end of the federal ITC for solar which was set to expire at the end of 2016. Congress then extended it through the end of 2019, as long as the project construction starts before the end of 2019.
But the growth in utility-scale solar can also be contributed to its cost-competitiveness with natural gas–fired power plants. For instance, the average generation rate in dollars per Megawatt-hour (MWh) for Boston is $126. That compares to $51 per MWh for thin-film utility-scale solar. A natural gas–fired peaker plant can cost as much as $191 per MWh depending on the cost of natural gas at the plant's location.6 As a result of 2017's remarkable growth in solar PV, the United States now boasts over 1.8 million solar PV installations. The total cumulative capacity is more than 58 GWs.7 As we'll soon see, the growth in utility-scale solar is just getting started, with the addition of new, smaller installations complementing the large, 100 MW-plus solar farms.
SOLAR ENERGY UNDER TRUMP
As I write in 2018, the cost of solar power continues to drop, and more US electric utilities are installing solar. But they are doing it just when our president, Donald Trump, wants to boost coal, oil, and natural gas. Trump's full-on support of fossil fuels and his disbelief in climate change have raised concerns of supporters of renewable energy in the United States.
In his 2015 book Crippled America, Trump made it clear that he thinks investing in renewable energy is a bad idea. He even thinks the development of alternative forms of energy using renewable resources is “a big mistake.”
In his book he writes: “To begin with, the whole push for renewable energy is being driven by the wrong motivation, the mistaken belief that global climate change is being caused by carbon emissions. If you don't buy that—and I don't—then what we have is really just an expensive way of making the tree-huggers feel good about themselves.”
Since becoming president, Trump hasn't said much at all regarding solar energy. The White House website has a link to the “America First Energy Plan,” the Trump administration's plan for US energy. It won't take you long to read it. It's a paltry 361 words long. The words, “solar,” “wind,” and “renewable” are not mentioned at all.
However, the administration provided a list of 50 infrastructure projects, totaling more than $137 billion, to the National Governor's Association. These are projects that would presumably get funded first if and when the president gets his infrastructure-spending plan through Congress. The document, first obtained by the Kansas City Star and the News Tribune, is titled, “Priority List – Emergency & National Security Projects.”
While the federal spending is $137 billion, Trump is looking for private-sector investments of that much or more in order to fund the projects. The document lists the number of “job years” that would be created. Direct job years would be 193,350 and there would be an additional 241,700 indirect job years created. Interestingly, the number of long-term jobs created is there, but is blank.
The list of projects is impressive, and covers US infrastructure from A to Z, including 12 road and bridge replacement projects. Of the 50 projects, 7 are electrical power grid upgrade and expansion projects. Many are necessary to deliver clean, renewable wind energy from the Midwest to load centers in California, Nevada, and the Southeast. There's even an energy storage project underway in California. Concerned over power blackouts, the California Public Utilities Commission is expediting the construction of energy storage systems in critical locations.
But the president isn't the only one with an infrastructure-improvement plan. The Senate Democrats, led by Chuck Schumer, have their own infrastructure plan. The “Blueprint to Rebuild America's Infrastructure” touts it will create over 15 million jobs. It will also spend $1 trillion, but that would all come out of the federal treasury (taxpayer pockets). The Democrat's plan addresses everything the Trump plan does, and a lot more.
Like the Trump plan, the Democrats want to invest $100 billion in upgrades to the power grid in the United States. In addition, their plan would create a permanent incentive for renewable energy generation, biofuels, and improvements in energy efficiency. Energy tax credits would reward the use and generation of clean energy and promote investment and inventiveness in both energy conservation and renewable energy.
The Democrats believe that this new certainty in the US tax code will enable viable, large investments that support next generation energy and energy infrastructure. These will bring down energy costs for consumers, protect the environment, and increase energy efficiency.
Trump has talked about axing the Obama administration's Clean Power Plan. That would be unfortunate, but it wasn't supposed to take effect until 2020. But even if he does manage to kill it, it won't matter. Whether he likes it or not, the solar energy train has already left the station.
Even though the word “solar” doesn't appear in Trump's America First Energy Plan, the solar industry is racking up some dramatic job growth numbers. The Solar Foundation, a nonprofit industry support group, indicated that 2016 saw the creation of over 51,000 new solar industry jobs. That's a 24.5 percent jump over 2015. The report states that the solar sector now employs over 260,000 workers at more than 9,000 companies in every US state.8 And 2016 was the fourth consecutive year of 20 percent-plus job growth for the solar industry.9 In 2017, the solar sector pumped $17 billion into the US economy.10 The growth in large part is a direct reflection of the increasing number of American businesses and families that are installing solar.
Solar has another thing going for it. That is the unstoppable force of technological innovation. And all the technologies surrounding solar are clean, very reliable and getting more affordable every day. The price of solar panels in dollars per watt in 2018 ranges from $0.28 to $0.45.11 That's more than competitive with every other form of generation. That's Fessler's First Law of Technology, “Technology marches on,” in action. The pace of improvements in technology, and solar in particular, happens independently of what's going on in politics or who is directing policy. If it makes good common sense, it's going to happen no matter what any one person thinks about it or says in public.
SAN FRANCISCO BREAKS NEW GROUND
I've mentioned in previous chapters that California has led the US adoption of renewables, in everything from geothermal to wind. But nowhere has it been more evident than with solar. And in 2016, San Francisco was the first city in the nation to have an ordinance requiring all new buildings to install solar panels on their roofs.
San Francisco's Board of Supervisors passed this ordinance unanimously and it went into effect at the beginning of 2017. The law is applicable to all commercial and residential buildings that are 10 stories or fewer in height. Before this ordinance, builders had to make buildings “solar-ready,” which meant that 15 percent of the roof had to be clear and unshaded. The new ordinance means builders actually have to install either thermal or electrical solar panels that produce either heated water or electricity. The city has a long-term goal of meeting its electrical demand with all renewable sources by 2025.
I've always maintained that there is so much wasted and available roof space that could be used for solar panels. In a statement announcing the ordinance, Scott Weiner, the city supervisor who introduced the legislation, apparently agrees, “Activating underutilized roof space is a smart and efficient way to promote the use of solar energy and improve our environment. We need to continue to pursue aggressive renewable energy policies to ensure a sustainable future for our city and our region.”12 Since San Francisco adopted its new legislation, the cities of Lancaster and Sebastopol, California, have passed similar laws.
It's another great example of cities and states moving faster than Washington, DC. I expect that will continue to be the case with renewables. Local and state governments are not as gridlocked as Washington is. And if you ask the average person about solar, most have no issue with it and generally feel it is good for the environment. No wonder solar is fast becoming a mainstream source of power.
YOU CAN'T PUT THE SOLAR GENIE BACK IN THE BOTTLE
Implied in all of this is more investment in solar. Even if the Trump energy “plan” is the one we end up living with, very little is going to change concerning solar. That's because renewable energy adoption has become popular with many Americans. In addition, many states have renewable portfolio standards that encourage the adoption of solar. This is happening with increasing frequency, as the cost for wind and solar continue to fall.
As of this writing, 29 states and the District of Columbia have renewable portfolio standards (see Figure 5.2). But Washington and the White House in particular have little or no influence on state and local policies, regulations, and incentives regarding renewable energy. So I expect the rollout of solar to continue at a robust pace. Even with the flurry of new installations, solar power generates only a little over 1 percent of all the power in the United States right now.
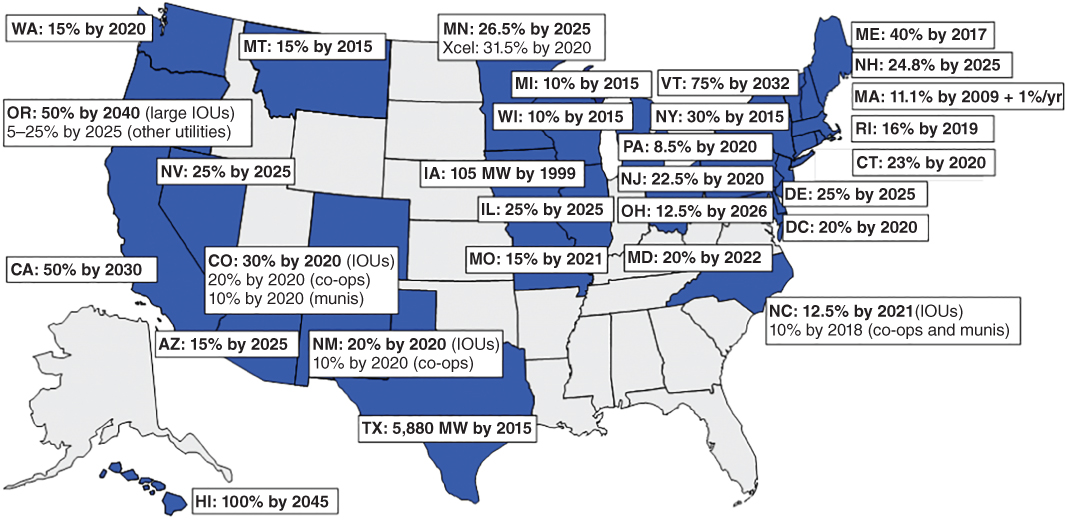
FIGURE 5.2 RENEWABLE PORTFOLIO STANDARDS
I expect this will grow rapidly, however, as utilities move from large utility-scale installations into smaller solar installations. Known as solar farms, many of these are under development by nonprofit organizations and local cooperatives. Why are utilities going smaller? To combat homeowners installing their own systems.
Solar energy systems have become so inexpensive, so fast, that utilities are scrambling to preserve their core business: generating and selling power. The more competition they have from homeowners, the fewer dollars available to recoup their plant and grid maintenance costs.
But even a president who “digs coal” can't stop the trend as utilities move away from dirty, coal-fired power plants. Even if federal policies manage to lower or even scrap current greenhouse gas emissions levels, utilities are moving in the direction of natural gas, wind, and solar. Lazard, a financial advisory firm, undertook an apples-to-apples study that compared the cost of all generation types without any of their federal subsidies. They found that the average lifetime cost of utility-scale solar and wind is now cheaper than nuclear and coal, and about the same as natural gas.
Not only that, the study found solar's costs are continuing to decline. Utility-scale solar's median levelized cost of energy (LCOE) is down 11 percent from 2015 to 2016. Rooftop solar PV technology dropped 26 percent during the same timeframe. But it's not quite cost-competitive without government subsidies.
In 2016 wind and solar accounted for roughly 66 percent of new generation capacity in the United States. That was more than fossil fuels for the third year in a row, according to the Department of Energy (see Figure 5.3).
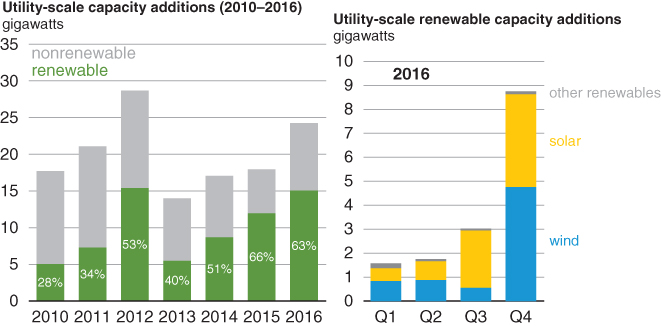
FIGURE 5.3 RENEWABLE GENERATION CAPACITY ADDITIONS, 2010–2016
As I mentioned earlier, utilities are concerned that too many homeowners installing rooftop solar could impede their ability to finance and maintain their grids and power plants. That's why they've taken such an interest in “shared solar,” also called community solar.
THE COMMUNITY SOLAR GARDEN MODEL
Under this model, a utility has a large solar array built for itself. It then gets customers to sign up and lease some number of panels from the array or agree to buy the power that they produce. The utility then credits this electricity to customers' bills. Utilities typically get customers to sign contracts that lock in rates for 10 to 20 years. Electricity from utility-run solar plants feeds into the utility's grid, not directly to an individual homeowner or business owner.
In many cases, utility-run shared solar is the only option for roughly half of the US households and businesses. A study done by the National Renewable Energy Laboratory found that 48 percent of businesses and 49 percent of all US households aren't able to install a solar PV system.13 That's because the homeowner or business doesn't own the structure, lacks good credit, doesn't have enough roof space, or the roof is facing the wrong direction.
Up until recently, small nonprofit groups, membership-based electric co-ops, and small municipal utilities came together and ran many of the shared solar “gardens” or “parks.”
But now, having been pushed into them by state renewable portfolio standards, utilities are now quickly adopting the shared solar model. In early 2017 about 20 percent of all US community solar programs in 32 states were owned by utilities. These investor-owned utility solar farms represent about 70 percent of the total power output of all of the nation's solar farms.
The state with the largest number of community solar project applications is Minnesota. Xcel Energy is the largest utility in the state and had nearly 2,000 applications totaling 2 GW worth of power for community solar garden projects. At the beginning of 2017, roughly 318 MW worth of applications were in the design phase. Another 178 MW across 49 sites were under construction.
A total of 17 community solar gardens were up and running with 57 MWs of capacity. The projects were installed by Geronimo Energy and financed by BHE Renewables, a division of Berkshire Hathaway. Xcel Energy had about 700 MWs of utility-scale solar projects and roughly 700 MW of community and residential solar up and running by the end of 2017.14 Xcel Energy plans to have almost 10 percent of its energy produced from solar by 2030. Minnesota's community solar program is off to a good start, and several other states are getting into the community solar program as well.
New York calls its program Community Distributed Generation (CDG). It has almost 2 GW worth of project applications among its participating utilities. New York's CDG program is available to homeowners, renters, businesses, and even entire municipalities.15 Maryland has a new three-year pilot community solar program. The state expects it will result in the development of 192 MW of community solar.16
In Colorado, utilities have a state mandate to obtain 30 percent of their electrical generation from renewables by 2020. While Colorado has a lot of wind generation, it's now focusing on community solar. It already has 28 community solar gardens up and running, thus generating over 16 MW. Another 26 are under construction and will generate an additional 31 MW when completed.17
A common thread running through all of the state community solar programs is the accessibility by low- and moderate-income customers and renters. These are groups of customers who in all likelihood would not have access to solar energy via any other means. Participating in a community solar project gives these individuals an immediate reduction in their electricity bills.
The big question is how much of a credit can a typical homeowner expect to receive by participating in a community solar program? The answer varies, depending on the state and the utility involved in the community solar program where the homeowner lives.
In Minnesota, the rates were initially based on the retail electric rate. Credits ranged from $0.12 per kilowatt-hour (kWh) to $0.15 per kWh, depending on the class of the subscriber and a number of other factors. However, Minnesota switched over to a value of solar (VOS) rate at the beginning of 2017. The VOS rate attempts to total all of the benefits and costs of distributed solar and assign a true cost. In Minnesota, the initial VOS rate for community solar programs run by Xcel Energy was established at slightly more than $0.10 per kWh. It will be adjusted every year for inflation.
In Maryland and New York, community solar project subscriber reimbursement rates vary by contract. The membership terms, bill credit rates, and any provisions for exiting membership are included in the contract between the sponsor and the subscriber. In Maryland, any individual subscriber cannot receive credit for over 200 percent of their average annual usage.
As of this writing, 25 states have at least one community solar garden. Twelve states and the District of Columbia have policies and programs in place encouraging the growth of community solar projects. It looks like utilities, municipalities, and businesses are all currently focused on the community solar garden model as a means of advancing solar energy in particular and renewables in general. State renewable portfolio requirements will continue to drive solar energy demand at the utility level.
I expect community solar projects will be one of the big drivers of solar adoption, especially in the United States. As more states adopt community solar models and more projects begin operating, it will become readily apparent that solar has definitely arrived as a mainstream energy source.
THE GLOBAL GROWTH OF SOLAR
While it's clear that solar is on a growth tear here in the United States, the global demand for solar is greater than any time during the past seven years. In 2017, 73 percent of all solar PV installations will be in the top four markets (the US, India, China, and Japan). In 2017, India, the world's fastest growing economy increased its solar installations by 9.5 GW. The country is aiming for 28 GW of installed solar by the end of 2018.18 Overall, the global solar PV market grew nearly 30 percent in 2017. The total global installed solar PV is now 405 GW. Fully 89 percent of that was installed since 2010.19
The global demand driver is no different than what it is here in the United States: Solar is dropping PV module prices. A glut of Chinese modules flooded the market in late 2016 and early 2017. The result? Module prices are being quoted between $0.28 and $0.45 per watt. That is very competitive with any other traditional power source. And remember, solar power price agreements (PPAs) lock in electricity pricing for 20 to 30 years. Except for wind power, there is no similar pricing lock-in for any other form of electrical generation. That makes solar look increasingly competitive when thinking long-term.
According to the industry research firm SolarPower Europe, 2017 marked the 11th year of global demand growth for solar PV. In 2017, installers added 98.9 GW of new capacity around the world, a 30 percent year-over-year growth from 2016.20
The United States grew at record rates in 2016 (95 percent year-over-year). But India was the top growth market in 2017, with the US market coming in second. Following them will be Africa, the Middle East, China, and finally Mexico. On the other hand, UK, Japanese, Australian, and German markets, viewed by analysts as more mature, are expected to remain flat or contract slightly.
The world saw an additional 95 GW of solar capacity installations during 2017. Interestingly, IHS Markit expects 2018's growth will slow to a mere 8 percent. We should see a much stronger recovery in 2019.
Around the globe, solar project developers are thinking big. More than 67 percent of the global project pipeline for solar PV consists of projects larger than 50 MW in size. Developers in China and the United States are taking advantage of abundant land in areas where solar radiation is the greatest. In the states, that's the Southwest. According to IHS, there are over 45,000 PV projects around the world in pipeline, under construction, or completed.21
From a financial standpoint, solar is in great shape. Over half of the largest infrastructure funds poured money into renewable energy in the first quarter of 2017. Roughly 69 percent invested in energy and 52 percent invested strictly in renewables. That translates to over $100 billion that is waiting to be put to work. I'll bet a good portion of that is ultimately going to be put to work on renewable projects.
Another major kick to renewable energy generation is coming from the corporate sector. There is an increasing trend toward investing in renewable energy. Google hit its 100 percent renewable energy target by the end of 2017.22 The RE100, a list of companies committing to go “100 percent renewable,” now has 152 members. The list is impressive in its scope and size. It's rapidly growing, too, with 13 new companies joining in September 2018.23 Of course, the easiest way for most of these companies to go 100 percent renewable is to cover their roofs with solar panels. Going 100 percent renewable is now viewed as good corporate environmental stewardship. I expect we'll see this list continue to rapidly grow annually.
A NEW LOOK FOR SOLAR: BUILDING-INTEGRATED PHOTOVOLTAICS
While the big solar manufacturers continue to make panels by the millions, there are new products on the horizon that are making their debut. I'm talking about building-integrated photovoltaic (BIPV) products. Roofing tiles, building siding, and even solar PV glass windows are all either on the drawing boards or available today.
Perhaps the most innovative product to hit the market in 2017 is Tesla, Inc.'s new solar PV roofing tiles. Tesla isn't the first company to market solar shingle products. Other companies including Dow, PowerLight, AstroPower, UniSolar, Atlantis, BP Solar, CertainTeed, and Suntegra have all introduced solar shingle products. As of this writing, only Atlantis, CertainTeed, and Suntegra solar roof shingles are still on the market. Solar shingles have not taken off as much as manufacturers would like. This has been primarily due to the high costs of the shingles themselves as well as steep installation costs.
Tesla believes its shingles are far better than what's been offered so far. Every shingle has a 6-inch, high efficiency solar cell behind a colored louver film and a coating of protective, tempered glass. The tempered glass layer makes Tesla's cells extremely durable. From below, Tesla's cells are not visible to the naked eye. The roof looks just like any other roof in the neighborhood. As of 2018, Tesla offered four different styles of roofing tiles: Smooth Glass, Slate Glass, Textured Glass, and Tuscan Glass (see Figure 5.4).
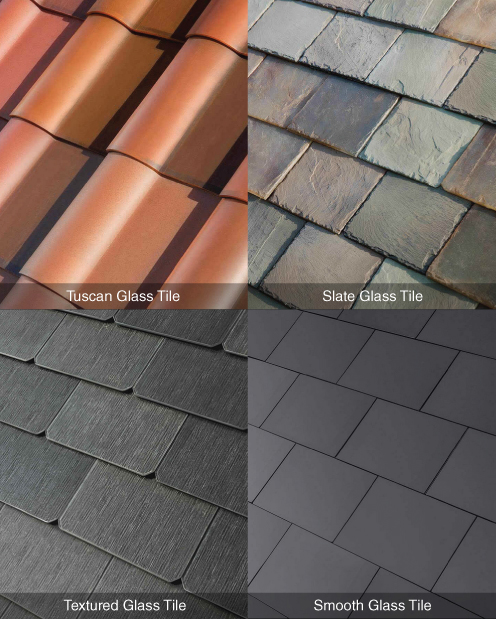
FIGURE 5.4 TESLA SOLAR ROOF TILES
Source: Tesla, Inc. Reproduced with permission.
The big difference between other roofing tiles and what Tesla offers is simple. Competitive tiles are still installed over an existing roof. Tesla's roofing tiles are the roof. Tesla's initial problem is that roofers aren't trained to work with electrical wires and connectors and solar installers aren't roofers. Anyone installing Tesla's products has to be trained by Tesla on installation procedures.
Beyond solar roof tiles, manufacturers have yet to make home siding or building glass that is able to turn the sun's rays into usable electricity. I believe that's in our future, but is in all likelihood at least a decade away. Remember, not all technologies that work in a laboratory or on a small scale are able to be manufactured at a scale that brings profitability.
THE FUTURE OF SOLAR CELL TECHNOLOGY
There are many emerging photovoltaic technologies. It's an exciting time in the field of solar energy. Not all of the emerging technologies I'll review below will become “photovoltaic blockbusters.” Silicon photovoltaics are still being used in many of the panels sold today. But some of the emerging cell technologies could be used in niche applications or create other offshoot cell technologies.
Before I review existing and new solar cell technologies, a paragraph or two about cell conversion efficiency is in order. Conversion efficiency is a measure of how well a solar cell converts the sun's energy into electricity. It does this by converting photons into electrons. The majority of solar panels produced today use polycrystalline silicon solar cells. Silicon, often referred to as the “first generation” solar cell technology, is still the solar module material of choice, and has been for some time. The theoretical conversion efficiency for a traditional single-junction silicon solar cell is about 30 percent. That's because the bulk of the sun's energy that strikes the solar cell passes through it without being absorbed, or it changes into heat energy that simply heats up the cell and the surrounding material.
In universities around the world, however, engineers are experimenting with new solar cell designs that will raise the current limitation on conversion efficiency. They are doing this by creating silicon solar cells with multiple junctions. Having multiple junctions that are sensitive to more bands of light beyond visible (infrared and ultraviolet, to name a few), means more of the sun's energy hitting the cell can be converted into electricity. The current world record for conversion efficiency for a single-junction solar cell is 46 percent. A Japanese research team led by Professor Kita Takashi at the Kobe University Graduate School of Engineering designed and created the cell. The team leapfrogged the theoretical 30 percent limit for a single-junction cell by using two photons instead of one. This new mechanism is unique to the team's cell design. Takashi's team demonstrated theoretical efficiencies of 63 percent using the two-photon design.24 The team continues to work on new solar cell designs with an eye toward creating low-cost, high-efficiency silicon solar cells. Aside from advances in conversion efficiency in silicon solar cells, there are “second generation” solar cell technologies that could soon supplant polycrystalline silicon. I'll review some of the most promising ones here.
Today's solar panels are a collection of interconnected silicon wafers (solar cells). However, there are three other technologies, collectively called “thin-film” technologies, that eliminate silicon wafers. They are copper-indium-gallium-diselenide (CIGS), cadmium-telluride (CdTe), and amorphous thin-film silicon (a-Si, TF-Si). These present a huge opportunity for a reduction in material costs.
The film thickness is as thin as a few nanometers to tens of micrometers. That's much thinner than conventional silicon solar cells that are about 200 micrometers thick. Thin-film's advantage allows cells and modules to be flexible, semi-transparent and much lighter than conventional first-generation cells. As a result, building-integrated photovoltaic (BIPV) product manufacturers use thin-film cells. Some semi-transparent films are laminated onto glass windows. Thin-film solar panels are constructed by sandwiching the film between two panes of glass.
While thin-film solar panels have always cost less than their first-generation silicon-cell counterparts, they have always lagged conventional cells in conversion efficiency. The nonprofit foundation, Centre for Solar Energy and Hydrogen Research Baden-Württemberg (ZSW), holds the current efficiency record for a CIGS thin-film cell. Based in Stuttgart and Ulm, Germany, ZSW is a pioneer of solar research. Its goal is to transfer technology research results to practical applications for use by German companies. The head of the Photovoltaics division is Professor Michael Powalla. Powalla believes CIGS efficiencies of 25 percent will be achievable “in the next few years.”25
Some of the world's largest solar PV power stations (the Topaz Solar Farm) use cadmium telluride (CdTe) photovoltaic solar panels because CdTe technology is extremely cost-competitive, even when pitted against low-cost Chinese silicon solar panels. CdTe panels being made and sold today have efficiencies of 17 percent. First Solar is a large US manufacturer of CdTe solar panels. It currently holds the world record for conversion efficiency of a CdTe panel at 22.1 percent. According to First Solar, “The achievement validates CdTe's continuing competitive advantage over traditional crystalline silicon technology.” Right now, most CdTe panels are used in large, utility-scale installations. However, a real possibility exists that CdTe solar panels may supplant silicon solar panels in the not too distant future.
Amorphous silicon (a-Si, TF-Si), the third of thin-film technologies discussed here, has the lowest efficiency compared to CIGS and CdTe cells. Its lower efficiency has relegated its use for devices that require small amounts of power. Solar pocket calculators are an example of a-Si use. Energy Conversion Devices, the only manufacturer of a-Si solar panels and a-Si BIPV products filed for Chapter 11 bankruptcy in February 2012. The company simply could not compete with the continuing drop in the cost of conventional silicon solar panels.
Another emerging solar cell technology is dye-sensitized solar cells (DSSC). So far, the National Renewable Energy Laboratory (NREL) has certified the maximum efficiency of DSSCs at 11.9 percent. DSSCs work differently than conventional silicon cells (see Figure 5.5).
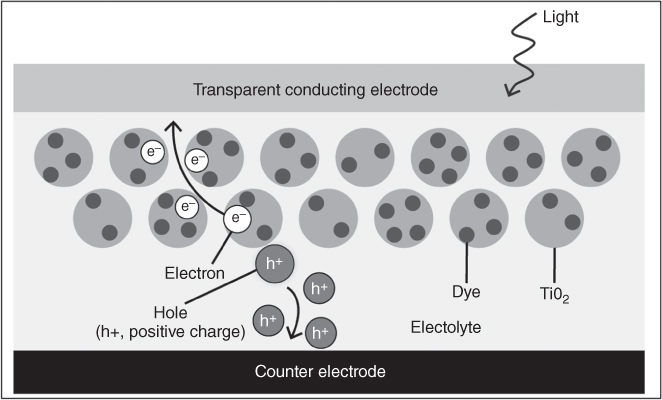
FIGURE 5.5 DYE-SENSITIZED SOLAR CELL ARCHITECTURE
Light (photons) transmitted through a transparent conducting electrode is absorbed by light-harvesting red dye molecules that are coating titanium dioxide (TiO2) nanoparticles. Electron-hole pairs (e–/h+) are formed. Electrons are injected into the TiO2 particles and are transported to the top-conducting electrode. Positive charges (holes) migrate through the electrolyte to the lower counter electrode. This generates an electrical current.
DSSCs, while lower in efficiency that silicon cells, can be manufactured in very thin films that are low in weight, extremely thin, and translucent. This allows DSSCs to be used in BIPV applications like window glazing. A DSSC film can be sandwiched between two panes of glass. This effectively turns every south-facing window into a solar panel. Dongjin Semichem, a South Korean company, has been manufacturing glass-based DSSC modules since 2010. The company markets its glass panels to architects, window manufacturers and construction materials companies.
The quantum dot solar cell (QDSC) is another cell technology that a number of academic researchers believe holds promise. In QDSCs, nanocrystals of semiconducting metal (lead sulfide, cadmium sulfide, cadmium selenide, or lead selenide) is the light-absorbing layer (see Figure 5.6).
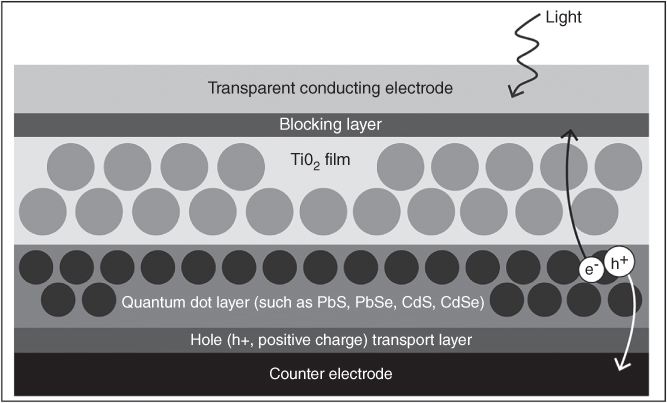
FIGURE 5.6 QUANTUM DOT SOLAR CELL ARCHITECTURE
Similar to a DSSC, light shines through a transparent conducting electrode onto the photosensitive layer of nanocrystals. This creates electron-hole pairs (e–/h+), and the charged particles flow to their respective electrodes as in a DSSC. The maximum NREL certified efficiency of QDSCs is 11.3 percent. As of this writing, there are no commercial products based on QDSC technology. However, Solterra Renewable Technologies in San Marcos, Texas, is working on a prototype QDSC. It hopes to demonstrate a multi-cell module by 2018. It is also working to improve its manufacturing process to be able to produce QDSC film in high volumes.
Organic photovoltaic modules are quite different from other photovoltaic technologies. In an organic photovoltaic device, a combination of light-sensitive polymers mixed together absorb light, setting their electricity generating abilities in motion (see Figure 5.7).

FIGURE 5.7 ORGANIC SOLAR CELL ARCHITECTURE
When the sun shines on an organic solar cell, photons pass through a transparent protective coating and a transparent conducting electrode. The photons stimulate electron-hole pairs (e–/h+) in the photoactive layer (see enlarged area in Figure 5.7). Once the pairs reach the interface between the conductive polymer (dark dots) and a fullerene (light dots) the pair splits. Electrons migrate down to the counter electrode while holes migrate up through the hole transport layer to the upper conducting electrode, generating an electrical current.
As of today, the NREL certified maximum efficiency for an organic photovoltaic device is 11.5 percent. Organic photovoltaic modules are also thin, flexible, and lightweight. Companies have placed them on building exteriors and integrated them into fabrics for use on tents and even backpacks. One of the world's leading producers of organic photovoltaic modules is Heliatek. Based in Dresden, Germany, Heliatek holds the world efficiency record for an organic photovoltaic device of 13.2 percent.26 Currently, the company is ramping up production. It expects to eventually manufacture solar films in high volume.
Gallium arsenide (GaAs) solar cells have a history dating back to the early 1970s. That's when GaAs solar cells were first developed. GaAs has a number of advantages that are unique to this technology. It has a strong resistance to both UV radiation and moisture, making cells and panels extremely durable. The cell design allows for high output power density and very efficient photon absorption. So, it's not surprising that GaAs solar cells (built by Alta Devices) hold both the single and dual junction conversion efficiency records at 28.8 percent and 31.6 percent, respectively. It also performs well in low temperatures and low light. This allows more solar energy to be captured on the front and back ends of the solar day.
Instead of a silicon wafer, a GaAs solar cell is built on a GaAs wafer. In the cell design pictured in Figure 5.8, some photons bounce off the back of the solar cell. This allows the creation of more electron-hole pairs (e–/h+) in the photoactive layer. This is why GaAs solar cells have achieved much higher conversion efficiencies.

FIGURE 5.8 GALLIUM ARSENIDE SOLAR CELL ARCHITECTURE
The final solar cell technology I want to review may indeed be the face of the future when it comes to solar cell design. I'm talking about the perovskite solar cell. Most emerging solar cell technologies have taken years for manufacturers to increase their conversion efficiencies. But perovskite solar cell conversion efficiencies have skyrocketed in just a few years' time to over 27.3 percent.27 It's all because perovskite materials have a special type of crystalline structure. What are perovskite crystals? The one used most for solar applications has the chemical compound (CH3NH3)PbI3. Interestingly, scientists don't know why or how the positive and negative charges generated by photoexcitation in perovskite crystals reach their respective destination electrodes as efficiently as they do. This is why many researchers have dropped research activities on other solar technologies in favor of studying perovskite solar cells.
The structure of a perovskite solar cell is deceptively simple (see Figure 5.9).

FIGURE 5.9 PEROVSKITE SOLAR CELL ARCHITECTURE
In operation, photons pass through the transparent conducting electrode and a dense layer of titanium dioxide (TiO2) and land on the photosensitive perovskite material. That creates electron-hole pairs (e–/h+). How and why that happens is the mysterious part of the process. In the end, electrons migrate through the dense TiO2 layer to the upper conducting electrode and holes migrate to the bottom counter electrode. This generates an electrical current. Presently, the NREL-certified conversion efficiency for a perovskite solar cell is 22.1 percent.
There are no perovskite cells in commercial production now, although I would expect to see commercialization of this technology in the next several years. Perovskite crystals are translucent and convert solar radiation into electricity at a different wavelength than silicon solar cells. For this reason, perovskite solar cell technology could potentially be layered on top of today's high efficiency silicon solar cells. This would drastically increase the overall efficiency of the hybrid solar cell.
As you can see, there are plenty of emerging solar technologies that are being researched by academia and existing solar module manufacturers. It tells me that the future of solar is bright indeed.
SOLAR ENERGY: DISRUPTING HOW WE GENERATE ELECTRICITY
While it's still relatively in its “early days,” solar energy is already well on its way to achieving disruptor status in the electrical generation sector. Solar was the largest source of new generating capacity additions (36 percent) during 2016.28 In 20 years' time, Elon Musk predicts we'll be getting 50 percent of our electricity from solar. Known futurist Ray Kurzweil believes we'll be getting 100 percent of our energy from solar by then. Even if both are off by 50 percent, that means solar will provide somewhere between 25 and 50 percent of our energy needs. That compares to about 1.3 percent from solar as of October 2018.29 So, you might think that Musk and Kurzweil are off their collective rockers. But consider this: Over the past decade, solar energy has achieved a compound annual growth rate (CAGR) of more than 60 percent.30
But let's take a very pessimistic view and assume solar energy only grows at a CAGR of 30 percent over the next 20 years. That means it will double seven times, which equals a 128-fold increase. So, solar's current 0.9 percent share of energy production will grow to 115.2 percent, or more than enough to meet all of America's energy needs. So you see, solar's future looks extremely bright. Its costs continue to drop (67 percent since 2011 and 29 percent in 2016 alone), and its adoption continues to increase. Adoption by Fortune 500 companies (like Apple, Target, and Walmart) is happening at breakneck speeds. The largest 25 corporate solar users in the United States have installed more than 1.1 GW of capacity. They've done it at more than 2,000 different locations around the United States.31
But solar is about to undergo an even more radical change than it has already. Solar energy systems are being paired with a capability that makes solar even more attractive. I'm talking about energy storage. Adding energy storage to a solar energy system allows the energy that's captured during the solar day to be time-shifted into the solar night. Up until now, cheap battery storage didn't exist. But the drop in the cost of battery storage has been just as dramatic as the rise in solar energy adoption. Cheap battery storage is driving the electric vehicle (EV) boom as well as the solar-plus-storage market. Both EVs and solar plus storage are in their infancy. I examine EVs from the early days to the present in Section 2. You'll see how they will ultimately play a big part in meeting America's energy storage needs.
By the time you get to the end of this book, you'll see how solar, EVs, and energy storage are going to totally disrupt how we generate, use, and store energy. Billions of people will have access to inexpensive, carbon-free energy. Energy production will, in effect, undergo democratization. Everyone will be able to participate in generating their own energy.