
5. THE HISTOGRAM
![]()
THE HISTOGRAM IS a graphic display of the amount of light striking the sensor. It’s a more modern and detailed method of determining the incoming light than the traditional light meter. The shape of the histogram shows us information about the range of brightness and how the tonal areas are related.
The traditional light meter measures light in a specific area, then indicates the average with a single number on a scale that typically ranges from -3 to +3. This simplistic system fails to convey the complex subtitles of light in many scenes. The histogram does a much better job of offering an easy-to-read analysis of both the amount and the range of light.
The histogram comes in two styles: brightness and RGB. (Check your camera’s menu to see if you have the option to switch between the two.) The brightness histogram shows the range of pixel brightness of a particular scene; the RGB histogram separates that same information into red, green, and blue color channels.
What Am I Looking At?
The histogram is a rectangular graph in which the X-axis (along the bottom of the graph) represents the range of brightness in pixels, with pure black on the far left and pure white on the far right. The Y-axis (along the vertical side of the graph) represents the relative number of pixels at a particular level of brightness. The taller the row, the more pixels there are with a certain tonal value. Pure black pixels (those that have received zero light) are at the far left. (This could mean that the object is either black or has not received enough exposure for its true brightness to be apparent.) The right end of the spectrum represents pixels that are pure white, either because there is a pure white object in the frame or because that object has been overexposed.
Pixels in the middle of the histogram are somewhere between white and black. If we want to work with our images after we have taken them, it’s these pixels in the middle that are the most pliable. We can make them a bit darker or a bit lighter quite easily.
Pixels on the far left or the far right are limited in how much they can be manipulated. We therefore want to capture an exposure that puts as much information as possible in the middle of the histogram.
If we increase our exposure, we are making our image brighter. In such cases, the histogram shape will trend to the right. If we decrease our exposure, the histogram shape will be denser on the left side of the graph, indicating the image is darker than average.
Most cameras offer the option to see a histogram of any image that is played back, but you may need to make a setting change on your camera to bring up this information. Many (mirrorless) cameras can show a live histogram in the electronic viewfinder while you are composing your image. Check your camera to see if this is possible.
Capturing exposures in which everything is represented by points in the middle of the histogram isn’t always possible, since the range of brightness in the real world is greater than what sensors can record. In these situations we’ll need to make a compromise on the exposure by adjusting it a little to the left (dark) or to the right (bright), depending on what is most important to us in the photo.
The Right Side
The most critical area to look at in most histograms is the right edge (the highlights). In most cases, we don’t want pixels that are pure white unless we are photographing a light source or a shiny reflection. Many photographers “protect the highlights” by making sure the histogram doesn’t have any points touching the far right barrier.
Blinkies
Some cameras offer a feature called Highlight Alert (or similar), sometimes referred to as “blinkies.” With this mode engaged, all pixels that are overexposed will blink in the image on the LCD. With the blinkies turned on, it’s very easy to see what data is being lost to overexposure. It will be up to you to change the exposure if this overexposure isn’t acceptable. You’ll need to look at the real scene with your own eyes and determine if that information is important and how bright it should actually be. In general, if you see a large area of blinkies, it means you need to darken your exposure.
The Left Side
The second most important area on the histogram is the far left, where the black pixels are represented. We usually don’t want to see areas of pure black in the scene. However, dark areas in a photograph are far more common than bright areas. These dark areas are frequently shadows, and you’ll need to determine how important it is to see detail in that shadowed area. If you do want to see information in the shadows, you’ll need to adjust your exposure so that the histogram is not weighted too far to the left.
Examples
A graph with a big hump on the left shows the brightness of a photo with lots of dark pixels. A graph with a big hump on the right means a photo with lots of light pixels. A photo of a panda or zebra would result in a spike on the left (dark pixels) and a spike on the right (light pixels). A photo of an elephant would likely have a big hump of information in the middle, indicating middle gray. Every image is unique, as is every accompanying histogram. The more you study the histograms of your images, the more you’ll be able to comprehend their information.
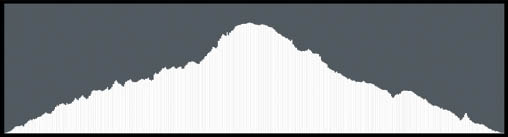
5.1 A typical histogram will have a mound of information in the middle, often tapering off as it reaches the edges.
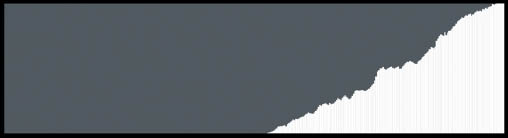
5.2 A histogram that represents an image of overexposure, or excessive brightness, will be “piled” up on the right side of the graph.
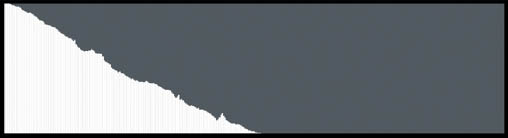
5.3 A histogram that indicates too much darkness, or underexposure, will be shifted far to the left side of the graph.
Histogram General Guidelines
- Try to keep most of the information in the middle of the graph.
- Remember that pixels on the far right are pure white.
- Remember that pixels on the far left will be pure black.
- It’s better to give your subject more light than less light (so long as you don’t overexpose important areas).